

Review
doi: 10.21037/qims.2019.03.10.
Combined native magnetic resonance angiography, flow-quantifying, and perfusion-imaging for impending second-stroke assessment
Affiliations
- PMID: 31032198
- PMCID: PMC6462574
- DOI: 10.21037/qims.2019.03.10
Item in Clipboard
Review
Combined native magnetic resonance angiography, flow-quantifying, and perfusion-imaging for impending second-stroke assessment
Quant Imaging Med Surg.
2019 Mar.
Abstract
This special report introduces native flow quantitative imaging for evaluating stroke risk. Moreover, the advantage of combining three imaging techniques [magnetic resonance angiography (MRA), phase-contrast (PC) flow imaging, and arterial spin-labeling imaging] is shown to be beneficial for responding to ischemia and preserving viable neurons. These quantitative imaging techniques provide authoritative information for diagnosing impending stroke and selecting appropriate treatment.
Keywords: Blood flow velocity; brain; magnetic resonance imaging (MRI); quantitative medicine.
Conflict of interest statement
Conflicts of Interest: The authors have no conflicts of interest to declare.
Figures
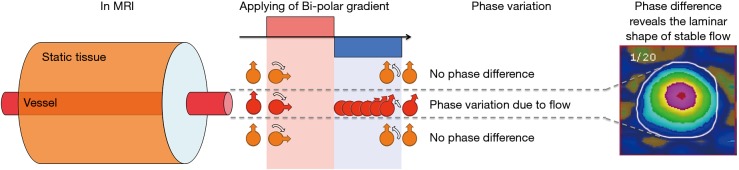
Phase contrast and flow rate. Applied with one bipolar gradient, the static tissue would not accumulate and generated no phase contrast. In contrast, the phase generated by the positive part of the bipolar gradient cannot be eliminated by the negative part in the dynamic tissue, and the phase shift was proportional to the velocity.
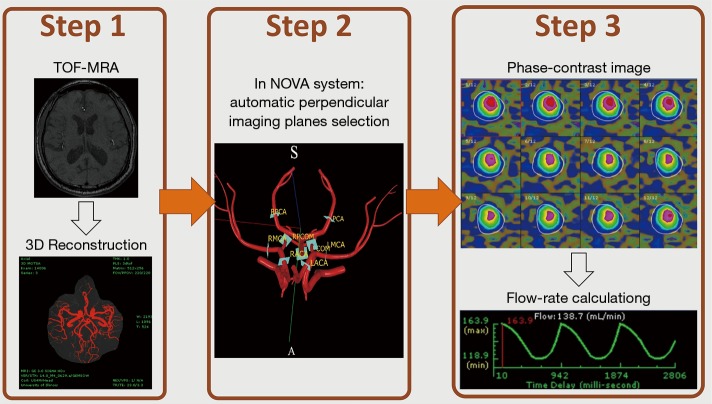
Flowchart of measurements. First, one time-of-flight MR angiogram is acquired to establish a view of the entire cerebral arterial location. Second, the NOVA system automatically sets up the optimized parameters for phase-contrast imaging in the MR console system after the operator selects the location of interest. Third, after scanning, it calculates the arterial flow rate during the cardiac cycles. NOVA, Non-Invasive Optimal Vessel Analysis; MR, magnetic resonance.
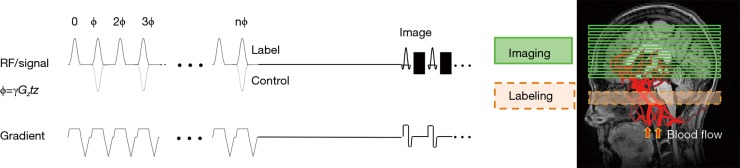
The pulse sequence of an arterial spin labeling scan. During image acquisition, one train of inversion-recovery RF pulses is used to “label” the flowing blood in the neck region. During control image acquisition, the inversion-recovery RF pulse is placed in the distal region where the inflow blood cannot be labeled. RF, ratio frequency.
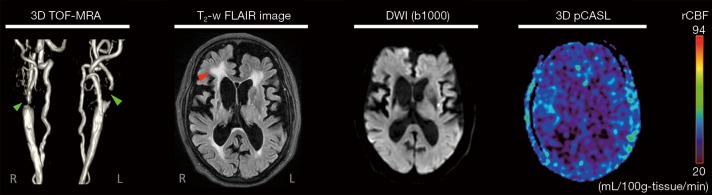
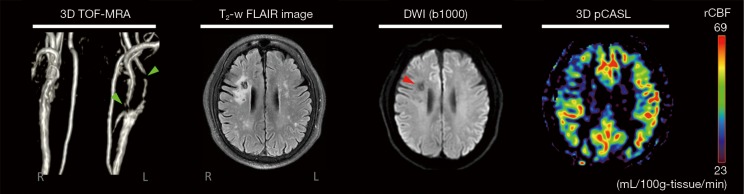
Magnetic resonance images of patient 1. Severe stenoses are located in the bilateral internal carotid arteries (green arrows), an acute infarct in the left corona radiates on diffusion-weighted images, and a subcortical arteriosclerotic encephalopathy is seen on the fluid-attenuated inversion recovery image (red arrow). In the regional cerebral blood flow map acquired by the pseudo-continuous labeling scan, lower perfusion was observed in the entire cerebral region, agreeing with the arterial flow rate result obtained using Non-Invasive Optimal Vessel Analysis. (This patient suffered from an emergency condition, and further surgery was necessary).
Magnetic resonance images of patient 2. Severe stenoses are located in the left external carotid artery and proximal internal carotid artery (green arrows), and a chronic infarct was visualized in the right centrum semiovale as a bright signal on the fluid-attenuated inversion recovery images and low signal on diffusion-weighted images (red arrow). In the regional cerebral blood flow map acquired by the pseudo-continuous labeling scan, the stroke lesion region showed lower perfusion than the contralateral side.
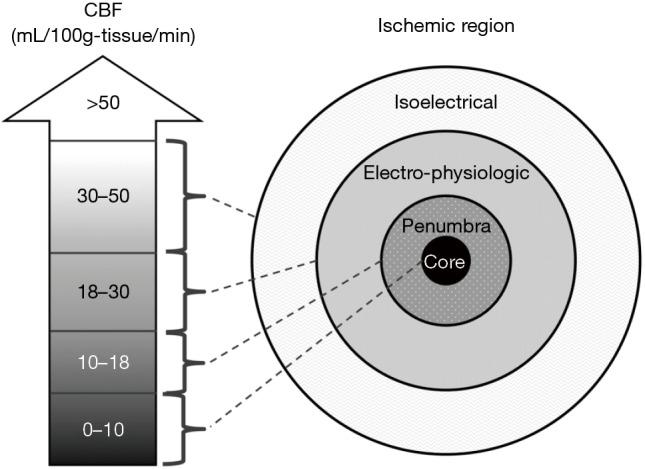
The ischemic penumbra (adapted from the Oxford Medicine website, Available online: http://m.oxfordmedicine.com/ ). In 1948, Kety and Schmidt quantified the normal CBF in healthy normal men as 54 mL/100 g-tissue/min (8,9). Sundt and others noted that a minimal CBF of 18 mL/100 g-tissue/min is needed to maintain normal electroencephalographic parameters during carotid endarterectomy (10-13). A further decrease in CBF causes neuronal electrical silence and decreased synaptic activity to preserve energy stores. Irreversible cellular damage occurs when CBF is below 10 mL/100 g-tissue/min. In response to ischemia, the cerebral vessel autoregulatory mechanism induces vasodilation to increase collateral blood flow and thereby increase oxygen and glucose extraction for the preservation of viable neurons.
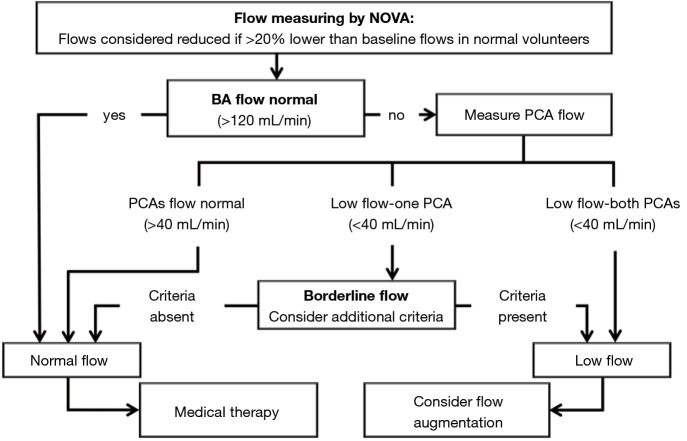
Flow algorithm for symptomatic vertebrobasilar disease (adapted from the article published by Amin-Hanjani et al., 2005) (14). The flow status can be determined as follows. If 1 cerebral artery is lower than baseline, only the flow in the contralateral artery is considered; if both sides of the cerebral artery are fetal, only flow in the BA is considered. Additional criteria in borderline cases: ominous BA flow waveform oscillation nearly equal to 0, ominous symptom complex (symptoms exacerbated with head position, cannot be on anticoagulation/antiplatelets, requires very elevated blood pressure to avert symptoms), and flow in the non-occluded proximal BA is lower than 40 mL/min. BA, basilar artery.
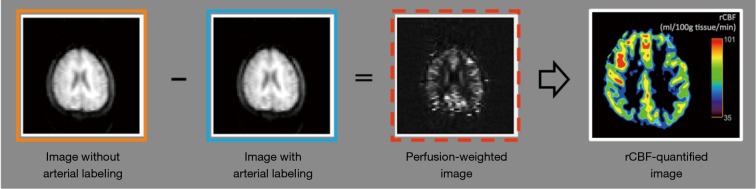
The image-subtraction procedure of an ASL scan. The labeled image was subtracted from a control image that was acquired without the blood labeled to generate perfusion-weighted ASL images. The regional CBF map could then be analyzed by the control image and the perfusion-weighted image (22). ASL, arterial spin labeling; CBF, Cerebral blood flow.
References
Publication types
LinkOut - more resources
Full Text Sources