. 2019 Mar 27:2019:1409383.
doi: 10.1155/2019/1409383. eCollection 2019.

Absence of Nonclassical Monocytes in Hemolytic Patients: Free Hb and NO-Mediated Mechanism

Affiliations

Absence of Nonclassical Monocytes in Hemolytic Patients: Free Hb and NO-Mediated Mechanism

Rashi Singhal et al. J Immunol Res. .

Abstract

In a recent work, we have described the kinetics among the monocyte subsets in the peripheral blood of hemolytic patients including paroxysmal nocturnal hemoglobinuria (PNH) and sickle cell disease (SCD). After engulfing Hb-activated platelets, classical monocytes (CD14+CD16-) significantly transformed into highly inflammatory (CD14+CD16hi) subsets in vitro. An estimated 40% of total circulating monocytes in PNH and 70% in SCD patients existed as CD14+CD16hi subsets. In this study, we show that the nonclassical (CD14dimCD16+) monocyte subsets are nearly absent in patients with PNH or SCD, compared to 10-12% cells in healthy individuals. In mechanism, we have described the unique role of both free Hb and nitric oxide (NO) in reducing number of nonclassical subsets more than classical monocytes. After engulfing Hb-activated platelets, the monocytes including nonclassical subsets acquired rapid cell death within 12 h in vitro. Further, the treatment to monocytes either with the secretome of Hb-activated platelets containing NO and free Hb or purified free Hb along with GSNO (a physiological NO donor) enhanced rapid cell death. Besides, our data from both PNH and SCD patients exhibited a direct correlation between intracellular NO and cell death marker 7AAD in monocytes from the peripheral blood. Our data together suggest that due to the immune surveillance nature, the nonclassical or patrolling monocytes are encountered frequently by Hb-activated platelets, free Hb, and NO in the circulation of hemolytic patients and are predisposed to die rapidly.


Figures

Figure 1
Figure 1
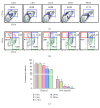
The absence of nonclassical monocyte subset in SCD and PNH patients. (a) Using flow cytometry, total leukocytes were gated as CD45+ and monocytes were gated as CD14+CD11c+ cells. Monocyte subsets were identified as CD14dimCD16+ nonclassical (red gated), CD14+CD16+ intermediate (blue gated), and CD14+CD16 classical (green gated). (b) Representative flow cytometry plots of 3 individuals each from healthy, SCD, and PNH patients showed profiles of the nonclassical subset (red gate on both CD14 vs. CD11c plot and CD14 vs. CD16 plot). (c) Scattered dot plot showing frequencies of nonclassical monocyte subsets in healthy, SCD, and PNH patients (n = 10 each). Each dot represents percent-positive cells for an individual. The Mann–Whitney U test was used for the comparison between the groups (∗∗∗ P < 0.0001). (d) Representative histogram plots showing the expression of CD11c on monocytes of SCD, PNH, and healthy individuals.
Figure 2
Figure 2
Dynamic changes in nonclassical monocytes after incubation with Hb-activated platelets in vitro. Monocytes from healthy individuals were incubated with Hb-activated platelets (0-48 h). After incubation with Hb-activated platelets, cells were harvested and processed for surface staining. (a) FACS plots showing the percentage of monocytes (CD11c+CD14+) at different time points and (b) percentage of nonclassical (red gated), intermediate (blue), and classical (green) monocyte subsets at 0, 2, 12, 24, and 48 h. (c) A bar diagram showing the percentage of nonclassical and classical monocyte subsets at different time points. Data are the mean ± SEM from three different experiments. The statistical significance was calculated using a paired t-test. P < 0.05, ∗∗ P < 0.01, and ∗∗∗ P < 0.001 compared to monocytes at 0 h.
Figure 3
Figure 3
Effect of Hb and NO on monocytes. Washed platelets isolated from healthy individuals were stimulated with Hb, collagen, or thrombin for 30 minutes at 37°C with gentle rotation and further incubated with DAF-FM-DA dye for measuring NO levels using flow cytometry. (a) Data represent mean ± SEM from three different experiments showing the percentage of NO-positive platelets after incubation with the above agonists. ∗∗∗ P < 0.001, analyzed using a paired t-test. (b) DAN assay was performed to quantify nitric oxide release from platelets. DAN (2,3-diaminonaphthalene) reacts with nitric oxide (NO) to form fluorescent napthotriazole (NAT), which was quantified by fluorescence spectroscopy with an excitation at 375 nm and emission at 450 nm. NO was quantified from the supernatant of platelets incubated with either Hb (3 μM) or thrombin (1 U/ml). Thrombin was used as a positive control. GSNO was used to prepare the standard curve for the quantification of NO release. Data are the mean ± SEM from 3 experiments. ∗∗ P < 0.01 and ∗∗∗ P < 0.001 compared to unstimulated platelets. Hb (0 μM) was analyzed using one way analysis of variance with a Bonferroni post hoc test. (c) Monocytes isolated from the peripheral blood of healthy individuals were treated with either media alone, Hb, GSNO, or Hb+GSNO for 2, 24, and 48 h. After incubation, cells were harvested and processed for surface staining. Representative FACS plots from 3 independent experiments showing the percentage of CD14dimCD16+ nonclassical monocytes (red gated). (d) A bar diagram showing the percentage of nonclassical monocyte subsets at different time points. Data are the mean ± SEM from three different experiments. The statistical significance was calculated using a paired t-test. P < 0.05 and ∗∗ P < 0.01; ns = nonsignificant.
Figure 4
Figure 4
Hb and NO mediate the death of nonclassical monocytes. Total monocytes or separately nonclassical and classical monocytes from healthy individuals were incubated with media alone, Hb, Hb+collagen, Hb+thrombospondin, and Hb+GSNO for 2, 24, and 48 h. After incubation, cells were harvested and processed for 7-AAD staining to assess cell death using flow cytometry. (a) Representative FACS plots from 3 independent experiments showing the percentage of 7-AAD-positive monocytes. (b) A bar diagram showing the percentage of 7-AAD-positive monocytes at different time points. Data are the mean ± SEM from three different experiments. The statistical significance was calculated using a paired t-test. P < 0.05 and ∗∗ P < 0.01; ns = nonsignificant. (c) FACS sorting strategy of monocyte subsets from PBMCs. Cells were gated based on size (FSC-A vs. SSC-A), and doublet discrimination (FSC-H vs. FSC-A) was performed. Monocytes were gated as CD14+CD11c+ and further sorted based on CD14 and CD16 markers. After incubation with different treatments, monocytes were processed for 7-AAD staining. FACS plots (d and f) and bar diagram (e and g) showing the percentage of 7-AAD-positive nonclassical (d and e) and classical (f and g) monocytes, respectively. Data are the mean ± SEM from three different experiments. The statistical significance was calculated using a paired t-test. P < 0.05, ∗∗ P < 0.01, and ∗∗∗ P < 0.001; ns = nonsignificant. Hb+GSNO treatment to nonclassical monocytes significantly increased cell death.
Figure 5
Figure 5
High NO level in monocytes of PNH/SCD patients correlates with 7AAD positivity. Monocytes from PNH (n = 8)/SCD (n = 2) patients (the same patients mentioned in Figure 1) and healthy individuals (n = 10) were stained with DAF-FM-DA dye for measuring NO levels or 7-AAD dye for assessing cell death using flow cytometry. (a) Scatter dotplot showing expression levels of NO. (b) A representative histogram showing the mean fluorescence intensity differences in PNH/SCD patients and healthy individuals. (c) A dotplot showing the percentage of 7-AAD-positive cells from PNH/SCD patients and healthy individuals. (d) A correlation plot showing the positive correlation between NO levels and cell death of monocytes from PNH/SCD patients. Each dot represents percent-positive cells for an individual. The Mann–Whitney U test was used for the comparison between the groups. ∗∗∗ P < 0.0001.

Similar articles

Cited by

References

    1. Ziegler-Heitbrock L., Ancuta P., Crowe S., et al. Nomenclature of monocytes and dendritic cells in blood. Blood. 2010;116(16):e74–e80. doi: 10.1182/blood-2010-02-258558. - DOI - PubMed
    1. Mobley J. L., Leininger M., Madore S., Baginski T. J., Renkiewicz R. Genetic evidence of a functional monocyte dichotomy. Inflammation. 2007;30(6):189–197. doi: 10.1007/s10753-007-9036-0. - DOI - PubMed
    1. Ancuta P., Liu K. Y., Misra V., et al. Transcriptional profiling reveals developmental relationship and distinct biological functions of CD16+ and CD16- monocyte subsets. BMC Genomics. 2009;10(1):p. 403. doi: 10.1186/1471-2164-10-403. - DOI - PMC - PubMed
    1. Zhao C., Zhang H., Wong W. C., et al. Identification of novel functional differences in monocyte subsets using proteomic and transcriptomic methods. Journal of Proteome Research. 2009;8(8):4028–4038. doi: 10.1021/pr900364p. - DOI - PubMed
    1. Cros J., Cagnard N., Woollard K., et al. Human CD14dim monocytes patrol and sense nucleic acids and viruses via TLR7 and TLR8 receptors. Immunity. 2010;33(3):375–386. doi: 10.1016/j.immuni.2010.08.012. - DOI - PMC - PubMed