. 2019 Apr 24;5(4):eaau8389.
doi: 10.1126/sciadv.aau8389. eCollection 2019 Apr.

RUNX represses Pmp22 to drive neurofibromagenesis

Affiliations

RUNX represses Pmp22 to drive neurofibromagenesis

Ashley Hall et al. Sci Adv. .

Abstract

Patients with neurofibromatosis type 1 (NF1) are predisposed to develop neurofibromas, but the underlying molecular mechanisms of neurofibromagenesis are not fully understood. We showed dual genetic deletion of Runx1 and Runx3 in Schwann cells (SCs) and SC precursors delayed neurofibromagenesis and prolonged mouse survival. We identified peripheral myelin protein 22 (Pmp22/Gas3) related to neurofibroma initiation. Knockdown of Pmp22 with short hairpin RNAs increased Runx1fl/fl;Runx3fl/fl;Nf1fl/fl;DhhCre tumor-derived sphere numbers and enabled significantly more neurofibroma-like microlesions on transplantation. Conversely, overexpression of Pmp22 in mouse neurofibroma SCs decreased cell proliferation. Mechanistically, RUNX1/3 regulated alternative promoter usage and induced levels of protein expression of Pmp22 to control SC growth. Last, pharmacological inhibition of RUNX/core-binding factor β (CBFB) activity significantly reduced neurofibroma volume in vivo. Thus, we identified a signaling pathway involving RUNX1/3 suppression of Pmp22 in neurofibroma initiation and/or maintenance. Targeting disruption of RUNX/CBFB interaction might provide a novel therapy for patients with neurofibroma.


Figures
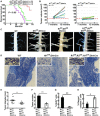
Fig. 1
Fig. 1. Dual deletion of Runx1/3 prolongs survival time and decreases tumor number and size in the Nf1fl/fl;DhhCre neurofibroma mouse.
(A) Kaplan-Meier survival curve. Purple, Runx1fll+;Runx3 fl/+;Nf1fllfl;DhhCre; green, Runx1fl/fl;Runx3fl/fl;Nf1fl/fl;DhhCre; red, Runx1fl/fl;Runx3fl/fl;Nf1fl+;DhhCre. (B) Each mouse volume at 7 and 12 months in controls (Runx1fll+;Runx3 fl/+;Nf1fllfl;DhhCre mice) (left) and Runx1fl/fl;Runx3fl/fl;Nf1fl/fl;DhhCre mice (right). Dashed lines indicate all the control mice volume >40 mm3 at 7 months, while the double-knockout mice volume varied. Mouse tumor volume statistical analysis: Mixed model analysis. Mixed-effects analysis of tumor volume showed P < 0.001 between Runx1fll+;Runx3 fl/+;Nf1fllfl;DhhCre mice and Runx1fl/fl;Runx3fl/fl;Nf1fl/fl;DhhCre mice at 7 and 12 months, respectively. (C) Representative gross dissections of thoracic paraspinal neurofibromas and nerve roots in 12 months of age-matched WT (left), Nf1fl/fl;DhhCre mice (second from the left), Runx1fl/fl;Nf1fl/fl;DhhCre mice (third from the left), and Runx1fl/fl;Runx3fl/fl;Nf1fl/fl;DhhCre mice (right). White arrows point to tumors. Ruler showed 1-mm markings. (Photo credit: Ashley Hall and Jianqiang Wu). (D) Representative photographs of toluidine blue–stained semithin sections from age-matched WT (left), Nf1fl/fl;DhhCre (middle), and Runx1fl/fl;Runx3fl/fl;Nf1fl/fl;DhhCre (right) mouse DRGs. Top-left corner insertions are high magnification of imagings to each corresponding genotype. (E) Tumor diameter in the Runx1fll+;Runx3 fl/+;Nf1fllfl;DhhCre mice (circles; n = 3 mice with 20 tumors) and Runx1fl/fl;Runx3fl/fl;Nf1fl/fl;DhhCre mice (squares; n = 4 mice with nine tumors) at 12 months. (F) Average tumor number per mouse at 12 months in the Runx1fll+;Runx3fl/+;Nf1fllfl;DhhCre mice (black bar; n = 3) and Runx1fl/fl;Runx3fl/fl;Nf1fl/fl;DhhCre mice (white bar; n = 4). (G) Cell proliferation shown as percentage of BrdU+ cells in Runx1fll+;Runx3fl/+;Nf1fllfl;DhhCre mice (black bar; n = 5) and Runx1fl/fl;Runx3fl/fl;Nf1fl/fl;DhhCre mice (white bar; n = 5). (H) Cell death shown as percentage of CC3+ cells in Runx1fll+;Runx3fl/+;Nf1fllfl;DhhCre mice (black bar; n = 5) and Runx1fl/fl;Runx3fl/fl;Nf1fl/fl;DhhCre mice (white bar; n = 5). (D to G) Unpaired Student’s t test. *P < 0.05, **P < 0.01, and ***P < 0.001. R1fl/fl;R3fl/fl;Nf1fl/fl;DhhCre = Runx1fl/fl;Runx3fl/fl;Nf1fl/fl;DhhCre.
Fig. 2
Fig. 2. Combined transcriptome profiling, ChIP-seq, and ATAC-seq analysis identifies 14 highly plausible direct targets of Runx.
(A) Heat maps showed the antibody-binding pattern around the TSSs region. Each panel represents 3 kb upstream and downstream of the TSSs. Left, IgG control; right, RUNX1 antibody. (B) Circle chart depicted RUNX1-binding site distribution in relation to the nearest annotated TSSs. Numbers represented distance from TSS (kb), and percentages represented percentage of bound regions. (C) Venn diagram showed the overlap of genes among RNA-seq DEGs, ChIP-seq peak, and ATAC-seq peak. For ChIP-seq and ATAC-seq, we consider differential peaks detected within ±20 kb around TSS. (D) Heat map showed the 14 commonly shared genes from Nf1fl/fl;DhhCre and Runx1fl/fl;Runx3fl/fl;Nf1fl/fl;DhhCre tumor RNA-seq. (E) qRT-PCR confirmed the relative mRNA expression of the 14 targets. (F) Representative two genes (Rnf157: up-regulated gene; Ccnd1: down-regulated gene) showed their RNA-seq gene expression (blue: down-regulation; red: up-regulation), RUNX1-binding ChiP-seq peak, and ATAC-seq peak. *P < 0.05, **P < 0.01.
Fig. 3
Fig. 3. Loss of Nf1 mediated PMP22 functions as tumor suppressor to contribute to neurofibroma initiation.
(A) Venn diagram showed the overlap of the 14 RUNX1/3 target genes with human neurofibroma-initiating cell microarray DEGs. (B) Western blot of PMP22 in WT mouse sciatic nerves (1 to 3), Nf1fl/fl;DhhCre tumors (4 to 6), and Runx1fl/fl;Runx3fl/fl;Nf1fl/fl;DhhCre tumors (7 to 9). β-Tubulin was used as a loading control. (C) ShPmp22 partially rescued numbers of Runx1fl/fl;Runx3fl/fl;Nf1fl/fl;DhhCre spheres. **P < 0.01. (D) Western blot showed the levels of Pmp22 knockdown by shPmp22. Numbers indicated the percentage of knockdown. (E) Neurofibroma-like lesions formed after subcutaneous injection of shNT- or shPmp22-transduced Runx1fl/fl;Runx3fl/fl;Nf1fl/fl;DhhCre DRG/neurofibroma-derived sphere cells. Statistics: Fisher’s exact test. P < 0.05. (F) A representative gross photograph of a lesion (dashed black circle) under reflected skin in a nu/nu mouse injected with shPmp22-transduced Runx1fl/fl;Runx3fl/fl;Nf1fl/fl;DhhCre DRG/neurofibroma-derived sphere cells. Ruler showed 1-mm markings. (Photo credit: Ashley Hall and Jianqiang Wu). (G) H&E-stained section of the tumor from (G) showed spindle cells (white arrows). (H) IHC showing S100β+ cells (brown; white arrows) in tumor. Blue is H&E counterstain. (I) Toluidine blue staining showed mast cells (black arrows). (J) Electronic micrograph showed lesions containing SCs, identified by continuous basal lamina in high magnification (white arrows).
Fig. 4
Fig. 4. Pmp22 inhibits mouse neurofibroma SC proliferation, and overexpression of Pmp22 induces cell senescence.
(A) Western blot showing PMP22 expression on lentivirus control (Ctrl) or PMP22 overexpression (OE) lentivirus-transduced mouse neurofibroma SCs. β-Tubulin was used as a loading control. (B) MTS assay showing significantly decreased cell growth in Pmp22 overexpressing mouse neurofibroma SCs compared with lentivirus control cells starting at day 3 and stopping cell growth at day 5. OD, optical density. (C) Representative EdU (green) and 4′,6-diamidino-2-phenylindole (DAPI) (blue) images on control (top) and Pmp22 overexpressing (bottom) mouse neurofibroma SCs. (D) Quantification of percentage of EdU+ cells on control (black bar) and Pmp22 overexpressing cells (white bar). (E) qRT-PCR of the relative mRNA expression of Pmp22 on ΔRunx cells normalized to control (n = 3 per group). (F) Representative Western blot of Pmp22 on three independent controls and three independent ΔRunx cells. (G) Representative bright-field images of mouse neurofibroma SCs. Top (control): Cells were transduced by lentivirus, but the RUNX-Pmp22–binding sites remained intact. Bottom (ΔRunx-Pmp22): Homozygous deletion of five putative RUNX-binding sites in Pmp22 gene by CRISPR-Cas9 approach (ΔRunx). (H) Representative EdU (green) and DAPI (blue) images on control (top) and ΔRunx (bottom) mouse neurofibroma SCs. (I) Quantification of percentage of EdU+ cells on control (white bar; n = 3) and ΔRunx cells (light gray bar; n = 3). *P < 0.05, **P < 0.01, and ***P < 0.001.
Fig. 5
Fig. 5. Runx1/3 regulates the alternative promoter usage and affects posttranslational modification of Pmp22.
(A) Upper two bands: RUNX1 ChIP-seq showed the binding peak near Pmp22 (blue box). IgG was used as control. Lower two bands: ATAC-seq on Nf1fl/fl;DhhCre and Runx1fl/fl;Runx3fl/fl;Nf1fl/fl;DhhCre showed more Pmp22 P2 open chromatin in Nf1fl/fl;DhhCre SCs (blue box). Top-right corner arrow pointed to TSS. Underneath, red bars indicated that Pmp22 mRNA expression was up-regulated in Runx1fl/fl;Runx3fl/fl;Nf1fl/fl;DhhCre versus Nf1fl/fl;DhhCre mice. Ab, antibody. (B) Ratio of normalized Pmp22 P1 (white bar) and P2 (light gray bar) transcript abundance in Runx1fl/fl;Runx3fl/fl;Nf1fl/fl;DhhCre (R1R3Nf1Ko) versus Nf1fl/fl;DhhCre (Nf1Ko) from bulk tumor RNA-seq data. (C) qRT-PCR showed Pmp22 P1 (white bar) and P2 (light gray bar) relative mRNA expression in Runx1fl/fl;Runx3fl/fl;Nf1fl/fl;DhhCre (R1R3Nf1Ko) over Nf1fl/fl;DhhCre (Nf1Ko) from FACS-sorted EGFP+ cells. n.s., not significant. (D) Diagram showed the cloning strategy of Pmp22 P1 5′-UTR or P2 5′-UTR with CMV into pGL2 luciferase reporter assay vector. Only CMV was used as control. (E) Luciferase reporter assay showed that P2 5′-UTR (CMV-P2) had less posttranscriptional modification activity compared with P1 5′-UTR (CMV-P1) in immortalized WT mouse SCs. (F) Representative immunofluorescence images of GM130 (green) and PMP22 (red) in WT (top), Nf1fl/fl;DhhCre (middle), and Runx1fl/fl;Runx3fl/fl;Nf1fl/fl;DhhCre (bottom) mouse neurofibroma/DRG SCs. White arrows pointed to GM130 (Golgi body) and PMP22 colocalization. *P < 0.05 and **P < 0.01.
Fig. 6
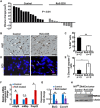
Fig. 6. RUNX/CBFB interaction inhibitor, Ro5-3335, significantly decreases mouse neurofibroma growth in vivo.
(A) Waterfall plot showed mouse tumor volume change. Data from each mouse were shown as a single bar. Change in tumor volume was quantified between 7 and 9 months for each individual mouse treated with vehicle control (control) (black bars; n = 13) or Ro5-3335 (gray bars; n = 10) for 8 weeks. (B and C) Ro5-3335–inhibited neurofibroma cell proliferation readout by the percentage of Ki67+ cells. (D and E) Ro5-3335–induced neurofibroma cell apoptosis as assessed by the percentage of CC3+ cells. (F and G) Relative mRNA expression of Ro5-3335–treated mouse neurofibromas compared with vehicle controls on up- (F) and down-regulated (G) genes. (H) Western blot of PMP22 in Nf1fl/fl;DhhCre tumors (1 and 2) and Ro5-3335–treated Nf1fl/fl;DhhCre tumors (3 and 4). β-Actin was used as loading control. *P < 0.05 and **P < 0.01.

Similar articles

Cited by

References

    1. Boyd K. P., Korf B. R., Theos A., Neurofibromatosis type 1. J. Am. Acad. Dermatol. 61, 1–14 (2009). - PMC - PubMed
    1. Dombi E., Baldwin A., Marcus L. J., Fisher M. J., Weiss B., Kim A., Whitcomb P., Martin S., Aschbacher-Smith L. E., Rizvi T. A., Wu J., Ershler R., Wolters P., Therrien J., Glod J., Belasco J. B., Schorry E., Brofferio A., Starosta A. J., Gillespie A., Doyle A. L., Ratner N., Widemann B. C., Activity of selumetinib in neurofibromatosis type 1-related plexiform neurofibromas. N. Engl. J. Med. 375, 2550–2560 (2016). - PMC - PubMed
    1. Jessen W. J., Miller S. J., Jousma E., Wu J., Rizvi T. A., Brundage M. E., Eaves D., Widemann B., Kim M.-O., Dombi E., Sabo J., Hardiman Dudley A., Niwa-Kawakita M., Page G. P., Giovannini M., Aronow B. J., Cripe T. P., Ratner N., MEK inhibition exhibits efficacy in human and mouse neurofibromatosis tumors. J. Clin. Invest. 123, 340–347 (2013). - PMC - PubMed
    1. Pemov A., Li H., Patidar R., Hansen N. F., Sindiri S., Hartley S. W., Wei J. S., Elkahloun A., Chandrasekharappa S. C.; NISC Comparative Sequencing Program, Boland J. F., Bass S.; NCI DCEG Cancer Genomics Research Laboratory, Mullikin J. C., Khan J., Widemann B. C., Wallace M. R., Stewart D. R., The primacy of NF1 loss as the driver of tumorigenesis in neurofibromatosis type 1-associated plexiform neurofibromas. Oncogene 36, 3168–3177 (2017). - PMC - PubMed
    1. Ratner N., Miller S. J., A RASopathy gene commonly mutated in cancer: The neurofibromatosis type 1 tumour suppressor. Nat. Rev. Cancer 15, 290–301 (2015). - PMC - PubMed

Publication types

MeSH terms