

Acute fructose intake suppresses fasting-induced hepatic gluconeogenesis through the AKT-FoxO1 pathway
- PMID: 31032430
- PMCID: PMC6479072
- DOI: 10.1016/j.bbrep.2019.100638
Acute fructose intake suppresses fasting-induced hepatic gluconeogenesis through the AKT-FoxO1 pathway
Abstract
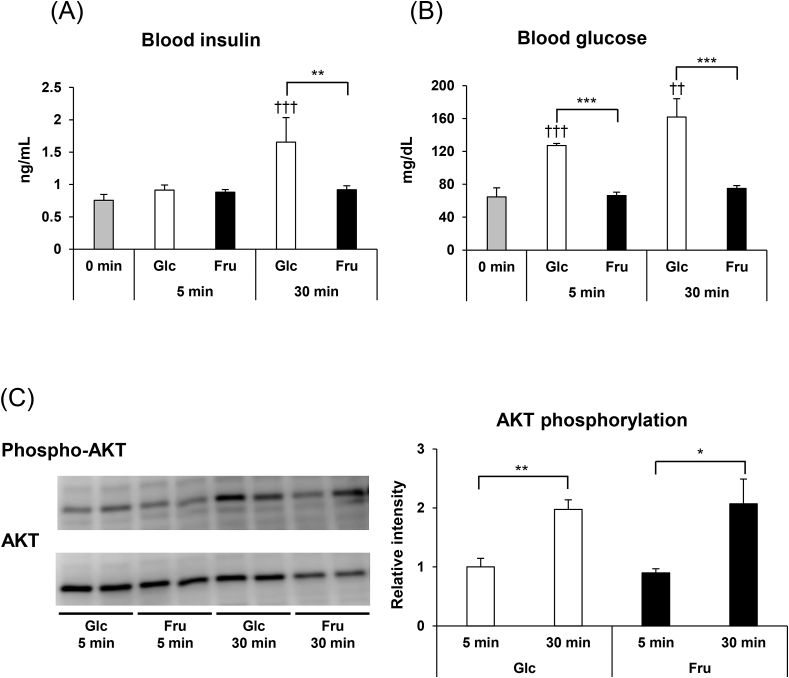
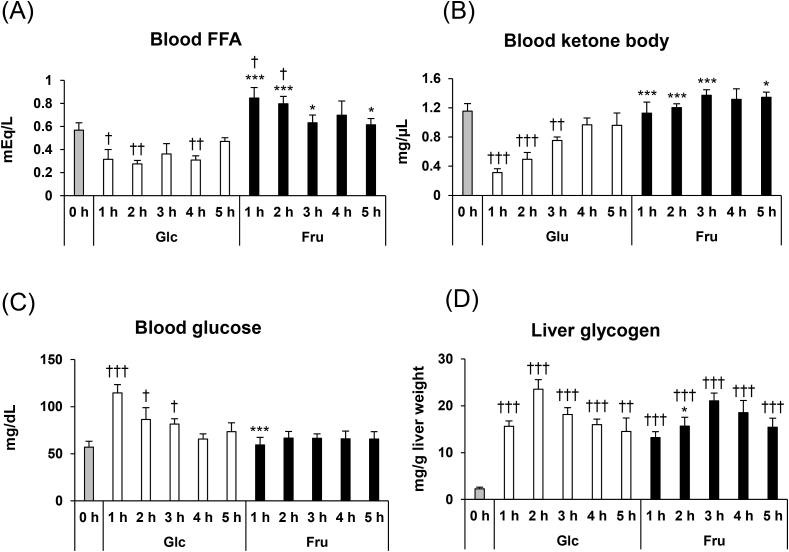
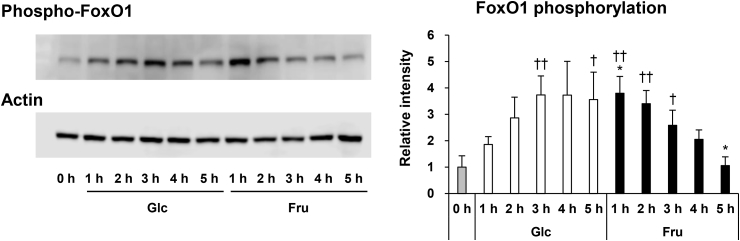
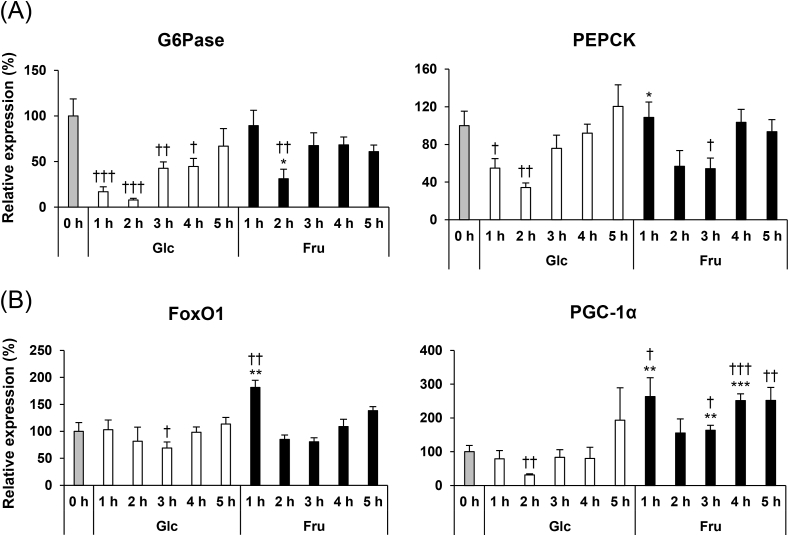
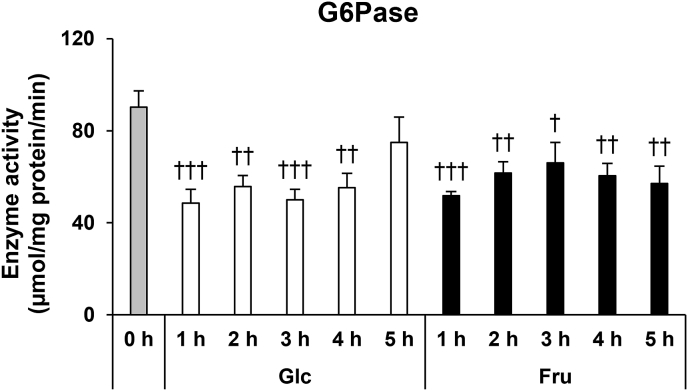
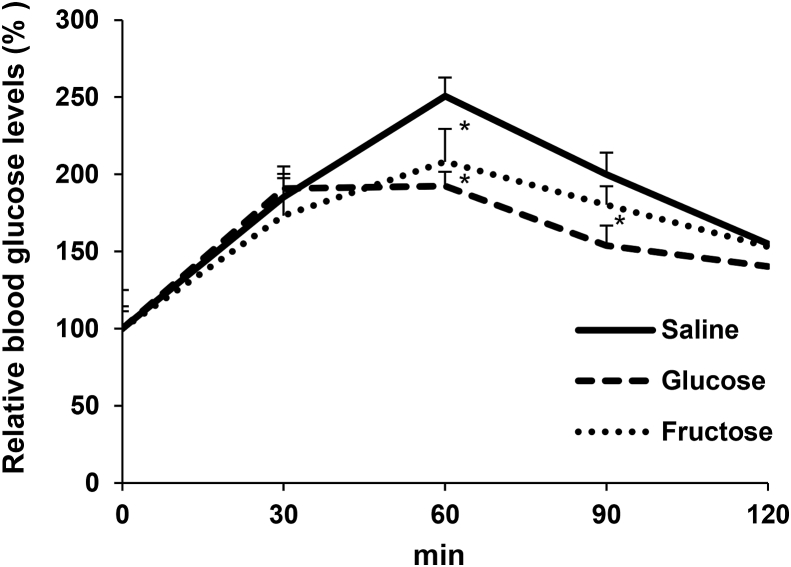
Excessive intake of fructose increases lipogenesis in the liver, leading to hepatic lipid accumulation and development of fatty liver disease. Metabolic alterations in the liver due to fructose intake have been reported in many studies, but the effect of fructose administration on hepatic gluconeogenesis is not fully understood. The aim of this study was to evaluate the acute effects of fructose administration on fasting-induced hepatic gluconeogenesis. C57BL/6J mice were administered fructose solution after 14 h of fasting and plasma insulin, glucose, free fatty acids, and ketone bodies were analysed. We also measured phosphorylated AKT and forkhead box O (FoxO) 1 protein levels and gene expression related to gluconeogenesis in the liver. Furthermore, we measured glucose production from pyruvate after fructose administration. Glucose-administered mice were used as controls. Fructose administration enhanced phosphorylation of AKT in the liver, without increase of blood insulin levels. Blood free fatty acids and ketone bodies concentrations were as high as those in the fasting group after fructose administration, suggesting that insulin-induced inhibition of lipolysis did not occur in mice administered with fructose. Fructose also enhanced phosphorylation of FoxO1 and suppressed gluconeogenic gene expression, glucose-6-phosphatase activity, and glucose production from pyruvate. The present study suggests that acute fructose administration suppresses fasting-induced hepatic gluconeogenesis in an insulin-independent manner.
Keywords: AKT; CREB, cAMP response element binding protein; ChREBP, carbohydrate response element binding protein; EDTA, ethylenediaminetetraacetic acid; FFA, free fatty acid; FoxO, forkhead box O; FoxO1; Fructose; G6Pase; G6Pase, glucose-6-phosphatase; Gluconeogenesis; Insulin; PEPCK, phosphoenolpyruvate carboxykinase; PGC-1α, peroxisome proliferator-activated receptor gamma coactivator-1 alpha; PI3K, phosphoinositide-3-kinase; PIP 3, phosphatidylinositol-(3,4,5)-trisphosphate; SREBP, sterol-regulatory element binding protein.
Figures
Similar articles
-
The SMILE transcriptional corepressor inhibits cAMP response element-binding protein (CREB)-mediated transactivation of gluconeogenic genes.J Biol Chem. 2018 Aug 24;293(34):13125-13133. doi: 10.1074/jbc.RA118.002196. Epub 2018 Jun 27. J Biol Chem. 2018. PMID: 29950523 Free PMC article.
-
Coordinated regulation of hepatic FoxO1, PGC-1α and SREBP-1c facilitates insulin action and resistance.Cell Signal. 2018 Mar;43:62-70. doi: 10.1016/j.cellsig.2017.12.005. Epub 2017 Dec 18. Cell Signal. 2018. PMID: 29269047
-
Jieduquyuziyin Prescription alleviates hepatic gluconeogenesis via PI3K/Akt/PGC-1α pathway in glucocorticoid-induced MRL/lpr mice.J Ethnopharmacol. 2022 Feb 10;284:114815. doi: 10.1016/j.jep.2021.114815. Epub 2021 Nov 8. J Ethnopharmacol. 2022. PMID: 34763039
-
Energy metabolism in the liver.Compr Physiol. 2014 Jan;4(1):177-97. doi: 10.1002/cphy.c130024. Compr Physiol. 2014. PMID: 24692138 Free PMC article. Review.
-
Insights into the Hexose Liver Metabolism-Glucose versus Fructose.Nutrients. 2017 Sep 16;9(9):1026. doi: 10.3390/nu9091026. Nutrients. 2017. PMID: 28926951 Free PMC article. Review.
Cited by
-
Organ-differential Roles of Akt/FoxOs Axis as a Key Metabolic Modulator during Aging.Aging Dis. 2021 Oct 1;12(7):1713-1728. doi: 10.14336/AD.2021.0225. eCollection 2021 Oct. Aging Dis. 2021. PMID: 34631216 Free PMC article. Review.
-
Foxtail Millet Improves Blood Glucose Metabolism in Diabetic Rats through PI3K/AKT and NF-κB Signaling Pathways Mediated by Gut Microbiota.Nutrients. 2021 May 27;13(6):1837. doi: 10.3390/nu13061837. Nutrients. 2021. PMID: 34072141 Free PMC article.
-
The Therapeutic Effects of Magnesium in Insulin Secretion and Insulin Resistance.Adv Biomed Res. 2022 Jun 29;11:54. doi: 10.4103/abr.abr_366_21. eCollection 2022. Adv Biomed Res. 2022. PMID: 35982863 Free PMC article. Review.
-
The Regulation of Circulating Hepatokines by Fructose Ingestion in Humans.J Endocr Soc. 2021 Jul 2;5(9):bvab121. doi: 10.1210/jendso/bvab121. eCollection 2021 Sep 1. J Endocr Soc. 2021. PMID: 34337280 Free PMC article.
-
Exploring the Genetic Conception of Obesity via the Dual Role of FoxO.Int J Mol Sci. 2021 Mar 20;22(6):3179. doi: 10.3390/ijms22063179. Int J Mol Sci. 2021. PMID: 33804729 Free PMC article. Review.
References
-
- Cederblad F., Ewald U., Gustafsson J. Effect of glucagon on glucose production, lipolysis, and gluconeogenesis in familial hyperinsulinism. Horm. Res. 1998;50:94–98. - PubMed
-
- Chhibber V.L., Soriano C., Tayek J.A. Effects of low-dose and high-dose glucagon on glucose production and gluconeogenesis in humans. Metabolism. 2000;49:39–46. - PubMed
-
- Mine T., Kojima I., Ogata E. Role of calcium fluxes in the action of glucagon on glucose metabolism in rat hepatocytes. Am. J. Physiol. 1993;265:G35–G42. - PubMed
-
- Stumpo D.J., Kletzien R.F. Gluconeogenesis in rat liver parenchymal cells in primary culture: permissive effect of the glucocorticoids on glucagon stimulation of gluconeogenesis. J. Cell. Physiol. 1981;107:11–19. - PubMed
-
- Huntington G.B. Starch utilization by ruminants: from basics to the bunk. Am Soc Anim Sci. 1997;75:852–867. - PubMed
LinkOut - more resources
Full Text Sources
Research Materials
Miscellaneous
