. 2019 Feb;1(2):291-303.
doi: 10.1038/s42255-018-0030-7. Epub 2019 Feb 11.

TGF-β2 is an exercise-induced adipokine that regulates glucose and fatty acid metabolism

Affiliations

TGF-β2 is an exercise-induced adipokine that regulates glucose and fatty acid metabolism

Hirokazu Takahashi et al. Nat Metab. 2019 Feb.

Abstract

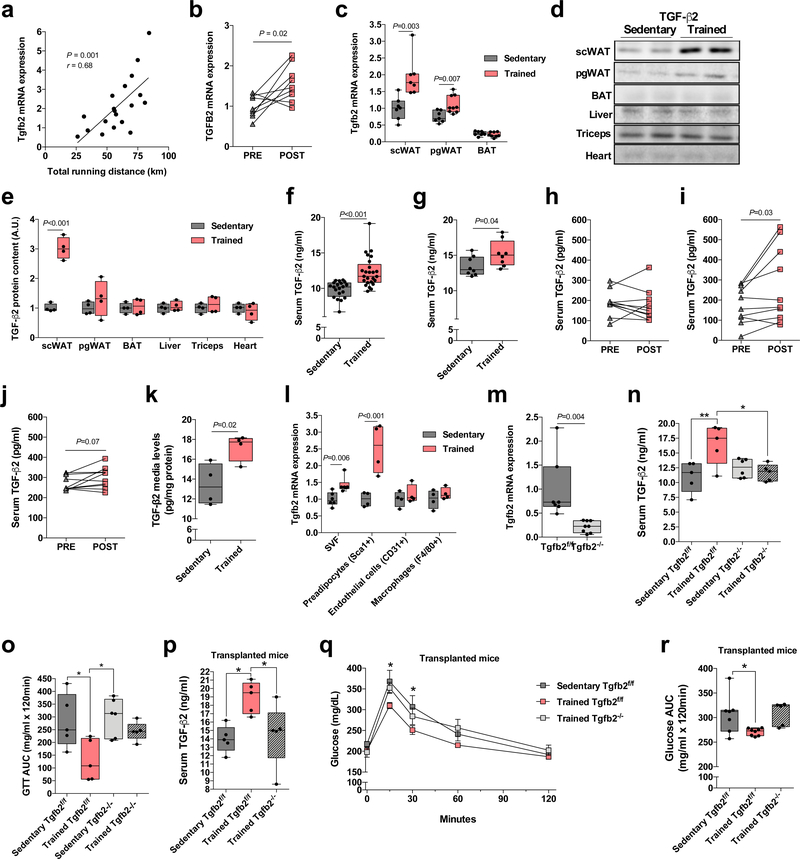
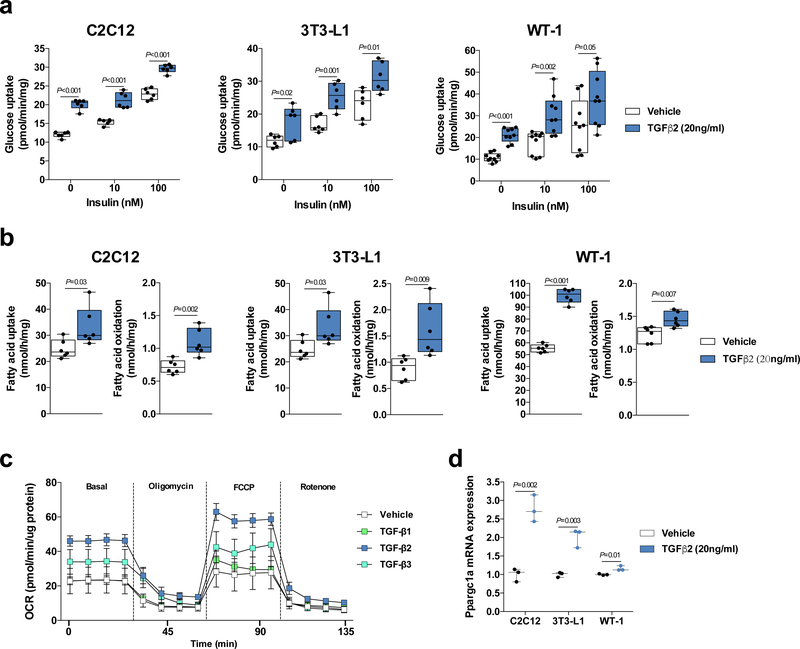
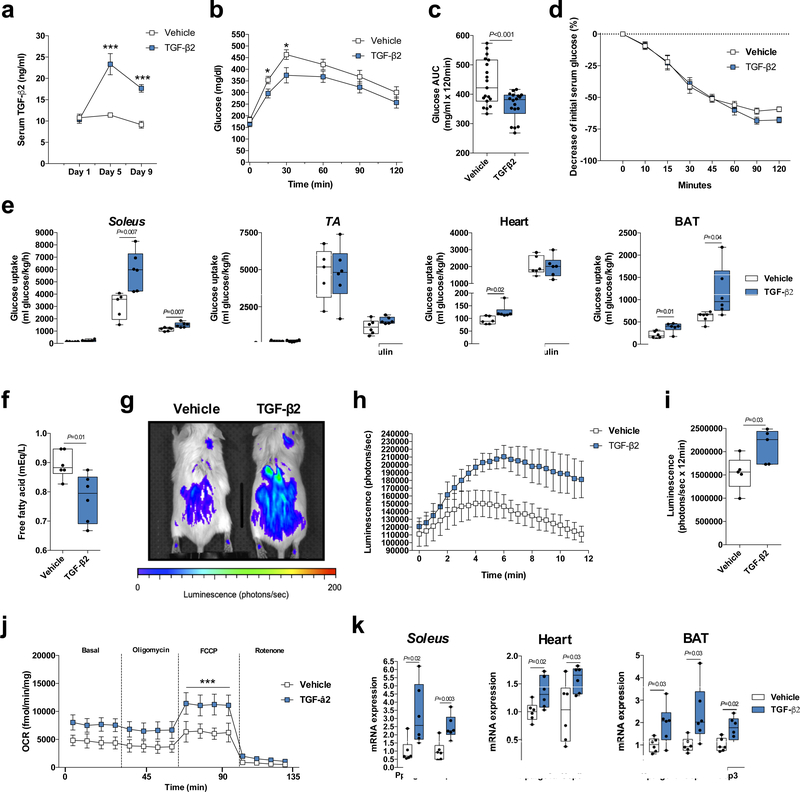
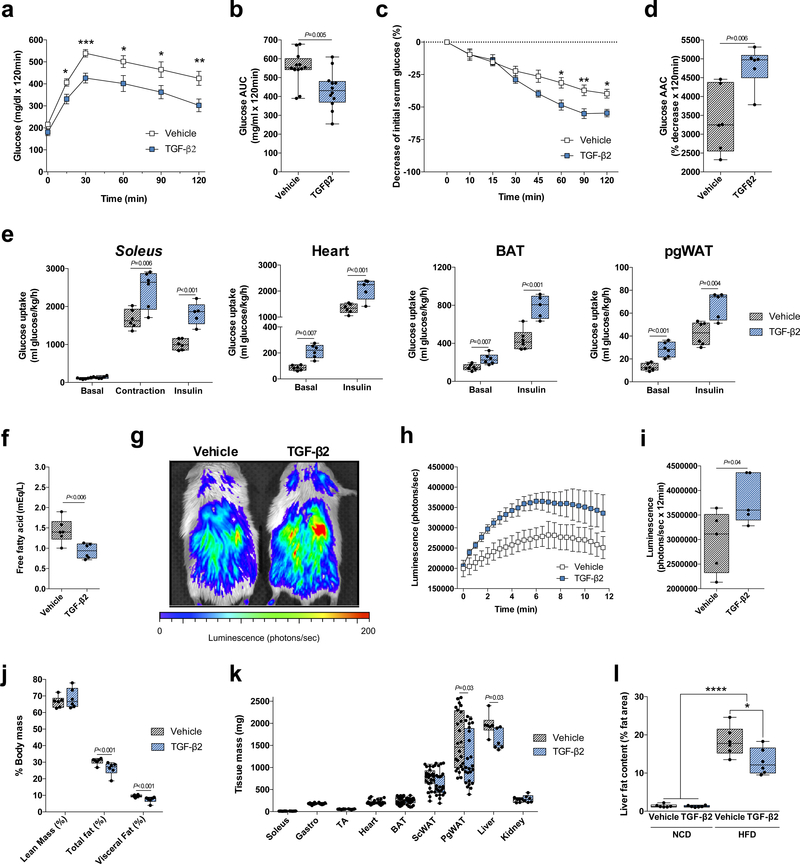
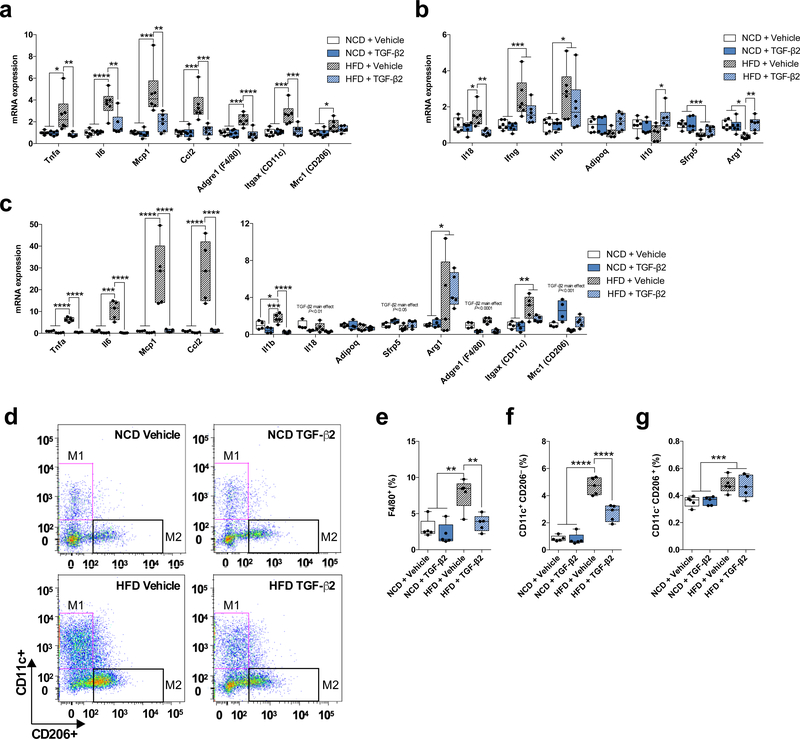
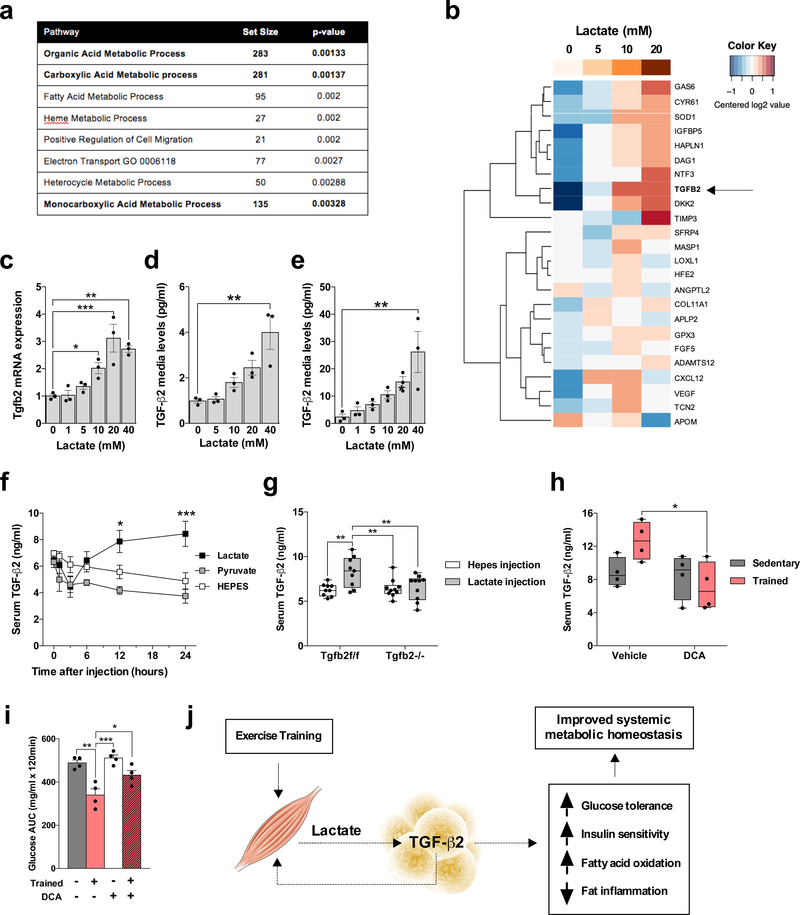
Exercise improves health and well-being across diverse organ systems, and elucidating mechanisms underlying the beneficial effects of exercise can lead to new therapies. Here, we show that transforming growth factor-β2 (TGF-β2) is secreted from adipose tissue in response to exercise and improves glucose tolerance in mice. We identify TGF-β2 as an exercise-induced adipokine in a gene expression analysis of human subcutaneous adipose tissue biopsies after exercise training. In mice, exercise training increases TGF-β2 in scWAT, serum, and its secretion from fat explants. Transplanting scWAT from exercise-trained wild type mice, but not from adipose tissue-specific Tgfb2-/- mice, into sedentary mice improves glucose tolerance. TGF-β2 treatment reverses the detrimental metabolic effects of high fat feeding in mice. Lactate, a metabolite released from muscle during exercise, stimulates TGF-β2 expression in human adipocytes. Administration of the lactate-lowering agent dichloroacetate during exercise training in mice decreases circulating TGF-β2 levels and reduces exercise-stimulated improvements in glucose tolerance. Thus, exercise training improves systemic metabolism through inter-organ communication with fat via a lactate-TGF-β2-signaling cycle.


Conflict of interest statement

Competing financial interests The authors have declared that no conflict of interest exists.

Figures

Figure 1.
Figure 1.
TGF-β2 is an exercise-induced adipokine. (a) Pearson correlation coefficient was used to determine the correlation between Tgfb2 mRNA expression and running distance in trained mice; n=19 mice. (b) Tgfb2 mRNA expression in human scWAT pre-and post-aerobic exercise training; n=9 subjects. (c) Tgfb2 mRNA expression in scWAT, pgWAT and BAT in sedentary and trained mice; n=7 (scWAT), 8 (pgWAT) and 7 (BAT) sedentary mice, and n=7 (scWAT), 9 (pgWAT) and 8 (BAT) trained mice. (d) Representative immunoblot and (e) quantification of TGF-β2 content in adipose tissue, liver, triceps, and heart of sedentary and trained mice. n=4 mice. (f) Serum TGF-β2 concentrations; n=20 sedentary mice, n=25 trained mice. (g) Serum TGF-β2 concentrations in sedentary and trained mice fed a high fat diet; n=8 mice. (h) Serum TGF-β2 concentrations in healthy subjects pre-and post-12 weeks of moderate-intensity exercise training; n=9 subjects. (i) Serum TGF-β2 concentrations in healthy subjects pre-and post-6 weeks of a combined aerobic and resistance exercise training protocol; n=10 subjects. (j) Serum TGF-β2 concentrations in healthy subjects pre-and post-two weeks of high-intensity cycling exercise trainin; n=10 subjects. (k) TGF-β2 concentrations were determined in the media of mature adipocytes isolated from sedentary and trained scWAT. Each datapoint represents pooled fat pads from 3 mice. n=4 biologically independent samples. (l) Tgfb2 mRNA expression in stromal vascular fraction, preadipocytes, endothelial cells, and macrophages isolated from scWAT; n=4 mice. (m) Tgfb2 mRNA expression in scWAT of adipose-specific Tgfb2 knockout (Tgfb2−/−) and control (Tgfb2f/f) mice; n=7 Tgfb2f/f and 8 Tgfb2−/− mice. (n) Serum TGF-β2 concentrations in sedentary and trained Tgfb2f/f and Tgfb2−/− mice; n=5 or 6 mice/group. (o) Glucose tolerance test (GTT) area under the curve in trained Tgfb2f/f and Tgfb2−/− mice. n=5 or 6 mice/group. (p) Serum TGF-β2 concentrations in recipient mice transplanted with scWAT from trained Tgfb2−/− mice. n=5 mice/group. (q) GTT and (r) GTT area under the curve in recipient mice transplanted with scWAT from trained Tgfb2−/− mice. n=7 Sedentary Tgfb2f/f, n=8 Trained Tgfb2f/f, n=5 Trained Tgfb2-/−. Data are presented as box plots (min, max, median, and 25th and 75th percentiles) with dots as individual values (c, e, f, g, k, l, m, n, o, p, r), mean ± s.e.m (q) or individual values (a, b, h, i, and j). Paired two-tailed Student’s t-tests were used for b, h, I and j. Unpaired two-tailed Student’s t-tests were used for c, e, f, g, k, l and m. ANOVA was used for n, o, p, q and r. When ANOVA showed P<0.05, Tukey’s multiple comparisons tests were used with *P<0.05; **P<0.01.
Figure 2.
Figure 2.
Recombinant TGF-β2 treatment stimulates glucose uptake and oxygen consumption rate (OCR) in vitro. (a) Glucose uptake in C2C12 myotubes, 3T3-L1 adipocytes, and WT-1 brown adipocytes treated with TGF-β2; n=6 biological replicates for C2C12 myotubes and 3T3-L1 adipocytes. n=9 biological replicates for WT-1 brown adipocytes. (b) [14C] palmitic acid uptake and oxidation in C2C12 myotubes, 3T3-L1 adipocytes and WT-1 brown adipocytes treated with TGF-β2; n = 6 biological replicates. (c) Extracellular flux analysis in C2C12 myotubes treated with TGF-β1, TGF-β2, or TGF-β3. n=4–6 technical-replicates wells. (d) Ppargc1a mRNA expression in C2C12 myotubes, 3T3-L1 adipocytes, and WT-1 brown adipocytes treated with TGF-β2; n=3 biological replicates. Data are presented as box plots (min, max, median, and 25th and 75th percentiles) with dots as individual values (a, b and c), or mean ± s.e.m (c). Unpaired two-tailed Student’s t-test was used for a, b and d.
Figure 3.
Figure 3.
TGF-β2 infusion via osmotic pump stimulates tissue glucose uptake and muscle oxygen consumption rate (OCR) in mice. (a) TGF-β2 serum concentration during TGF-β2 infusion; n=7 mice. (b) Glucose tolerance test (GTT) and (c) GTT area under the curve after nine days of TGF-β2 infusion; n=19 mice. (d) Insulin tolerance test (ITT); n=19 mice. (e) [3H]-2-deoxyglucose uptake in soleus, tibialis anterior (TA), heart and BAT; n=5 or 6 mice. (f) Serum free fatty acid concentrations in mice; n=6 mice. (g) Representative image of luciferin-conjugated fatty acid uptake, (h) quantification of luciferin activity and (i) area under the curve (AUC) in mice. n=5 mice. (j) OCR in soleus fibers; n=5 mice. (k) Ppargc1a, Ucp1, and Ucp3 mRNA relative expression in soleus, heart, and BAT; n=6 mice. Data are presented as box plots (min, max, median, and 25th and 75th percentiles) with dots as individual values (c, e, f, i and k), or mean ± s.e.m (a, b, d, h and j). Unpaired two-tailed Student’s t-test was used for c, e, f, i and k. ANOVA was used for a, b, c, h and j. When ANOVA showed P<0.05, Tukey’s multiple comparisons tests were used with *P<0.05; ***P<0.001.
Figure 4.
Figure 4.
TGF-β2 infusion via osmotic pump ameliorates the effects of a high fat diet in mice. (a) Glucose tolerance test (GTT) and (b) GTT area under the curve in high fat diet-fed (HFD) mice treated with TGF-β2; n=12 mice. (c) Insulin tolerance test (ITT) and (d) ITT area above the curve; n=6 mice. (e) [3H]-2-deoxyglucose uptake in soleus, heart, BAT, and pgWAT; n=5 or 6 mice. (f) Serum free fatty acid concentrations in HFD mice; n=6 mice. (g) Representative image of luciferin-conjugated fatty acid uptake, (h) quantification of luciferin activity and (i) area under the curve (AUC) in mice. n=5 mice. (j) Lean, total fat and visceral fat mass; n=6 mice. (k) Tissue mass; n=24 mice. (l) Liver fat content in normal chow diet-fed (NCD) or HFD mice; n=8 mice. Data are presented as box plots (min, max, median, and 25th and 75th percentiles) with dots as individual values (b, d, e, f, i, j, k and l), or mean ± s.e.m (a, c, and h). Unpaired two-tailed Student’s t-test was used for b, d, e, f, i, j and k. ANOVA was used for a, c, and l. When ANOVA showed P<0.05, Tukey’s multiple comparisons tests were used with *P<0.05; **P<0.01, ***P<0.001, ****P<0.0001.
Figure 5.
Figure 5.
TGF-β2 treatment attenuates high fat diet-induced inflammation in adipose tissue. (a,b) Expression of (a) pro-inflammatory and (b) anti-inflammatory markers in pgWAT in normal chow diet-fed (NCD) and HFD mice treated with TGF-β2; n=6 mice. (c) Levels of mRNA for inflammatory markers in peritoneal macrophages isolated from NCD and HFD mice and treated with TGF-β2; n=4 mice. (d) Representative image of flow cytometry experiment. (e) Percentage of macrophages (F4/80+) infiltrated in pgWAT in NCD and HFD mice treated with TGF-β2; n=5 mice. (f) Percentage of M1 and (g) M2 macrophages infiltrated in pgWAT in NCD and HFD mice treated with TGF-β2; n=5 mice. Data are presented as box plots (min, max, median, and 25th and 75th percentiles) with dots as individual values (a, b, c, e, f, and g). ANOVA was used for a, b, c, e, f and g. When ANOVA showed P<0.05, Tukey’s multiple comparisons tests were used with *P<0.05; **P<0.01, ***P<0.001, ****P<0.0001.
Figure 6.
Figure 6.
Lactate produced by exercise training stimulates TGF-β2. (a) Most significant pathways correlated to Tgfb2 expression in scWAT microarray in trained mice. (b) Human adipocytes response to lactate. Putative adipokine genes selected from previous scWAT microarray of trained mice. -ΔCt data were centered for each row to have a mean of zero; a color bar representing lactate concentration is shown at the top. (c) Tgfb2 mRNA relative expression in human adipocytes treated with different concentrations of lactate; n=3 biological replicates. (d,e) TGF-β2 media concentration in (d) 3T3-L1 adipocytes and (e) human adipocytes treated with lactate; n=3 biological replicates. (f) TGF-β2 serum concentration in mice injected with lactate, pyruvate, or vehicle (HEPES) intraperitoneally; n=4 mice. (g) Serum TGF-β2 concentration in Tgfb2f/f and Tgfb2−/− mice 24 hours after a lactate injection. (h) Serum TGF-β2 concentration in trained mice and/or daily treated with dichloroacetate (DCA) injections; n=4 mice. (i) Glucose tolerance test (GTT) area under the curve in trained mice after daily dichloroacetate (DCA) injections; n=4 mice. (j) Proposed model of exercise training effects on lactate-TGF-β2 signaling axis. Data are presented as box plots (min, max, median, and 25th and 75th percentiles) with dots as individual values (g and h), or mean ± s.e.m (c, d, e, f, and i). ANOVA was used for c, d, e, f, g, h and i. When ANOVA showed P<0.05, Tukey’s multiple comparisons tests were used with *P<0.05; **P<0.01, ***P<0.001.

Comment in

  • A new metabolic role for TGFβ2.
    Starling S. Starling S. Nat Rev Endocrinol. 2019 Apr;15(4):191. doi: 10.1038/s41574-019-0183-9. Nat Rev Endocrinol. 2019. PMID: 30787450 No abstract available.

References

    1. Stanford KI & Goodyear LJ Exercise and type 2 diabetes: molecular mechanisms regulating glucose uptake in skeletal muscle. Adv. Physiol. Educ 38, 308–314 (2014). - PMC - PubMed
    1. Fiuza-Luces C, Garatachea N, Berger NA & Lucia A Exercise is the Real Polypill. Physiology 28, 330–358 (2013). - PubMed
    1. Booth FW, Roberts CK & Laye MJ Lack of exercise is a major cause of chronic diseases. Compr. Physiol. (2012). doi:10.1002/cphy.c110025.Lack - DOI - PMC - PubMed
    1. Colberg SR et al. Exercise and type 2 diabetes: The American College of Sports Medicine and the American Diabetes Association: Joint position statement. Diabetes Care 33, (2010). - PMC - PubMed
    1. Gollisch KSC et al. Effects of exercise training on subcutaneous and visceral adipose tissue in normal- and high-fat diet-fed rats. Am. J. Physiol. Endocrinol. Metab 297, 495–504 (2009). - PMC - PubMed

Publication types