

In Vivo 3D MRI Measurement of Tumour Volume in an Orthotopic Mouse Model of Prostate Cancer
- PMID: 31032634
- PMCID: PMC6488786
- DOI: 10.1177/1073274819846590
In Vivo 3D MRI Measurement of Tumour Volume in an Orthotopic Mouse Model of Prostate Cancer
Abstract
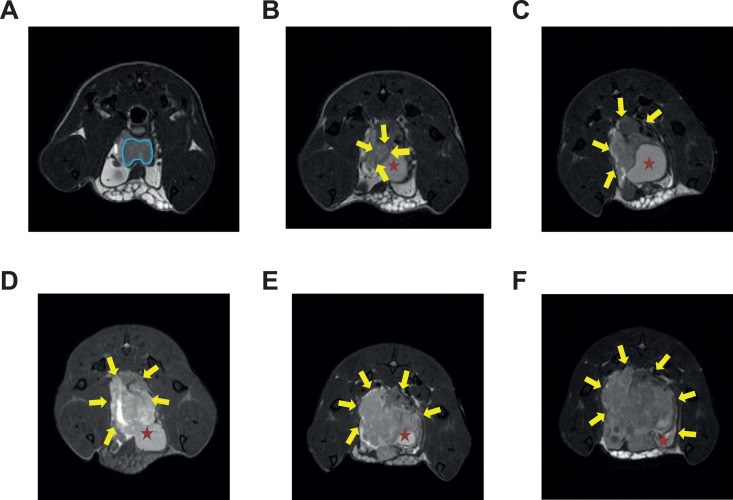
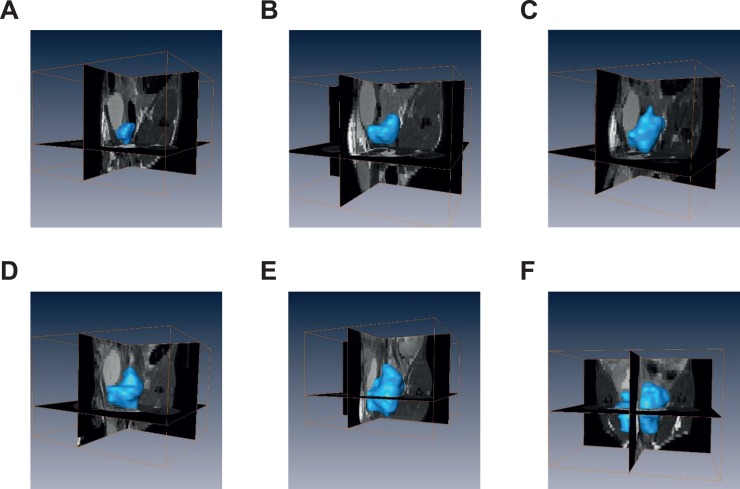
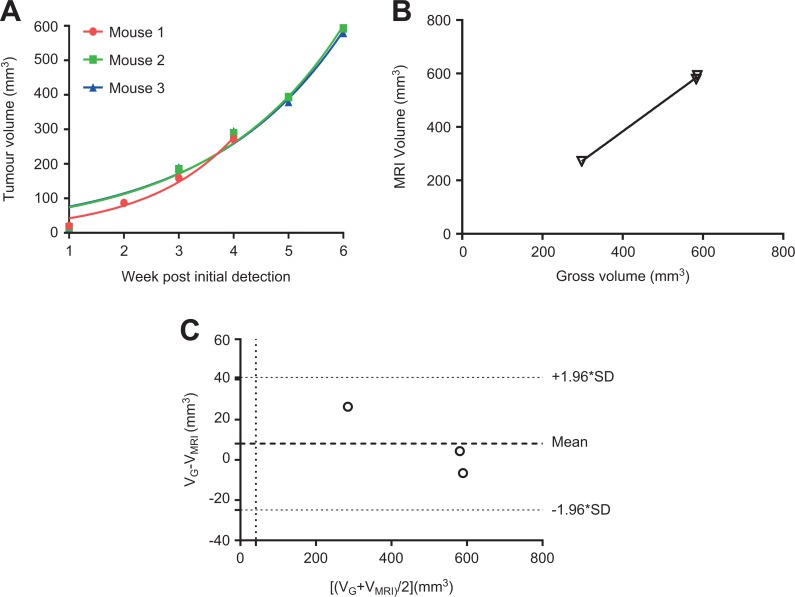
Prostate cancer (CaP) is the most commonly diagnosed cancer in males in western countries. Orthotopic implantation is considered as an ideal xenograft model for CaP study, and noninvasive measurement of tumor volume changes is important for monitoring responses to anticancer therapies. In this study, the T2-weighted fast spin echo sequence magnetic resonance imaging (MRI) was performed on a CaP orthotopic non-obese diabetic/severe combined immunodeficiency (NOD/SCID) mouse model weekly for 6 weeks post PC-3 CaP cell inoculation, and the fat signal was suppressed using a chemical shift-selective pulse. Subsequently, the MRI data were imported into the image processing software Avizo Standard and stacked into three-dimensional (3D) volumes. Our results demonstrate that MRI, combined with 3D reconstruction, is a feasible and sensitive method to assess tumor growth in a PC-3 orthotopic CaP mouse model and this established monitoring approach is promising for longitudinal observation of CaP xenograft development after anticancer therapy in vivo. Further investigation is needed to validate this protocol in a larger cohort of mice to generate enough statistical power.
Keywords: animal model; magnetic resonance imaging; prostate cancer.
Conflict of interest statement
Figures
Similar articles
-
A novel mouse model of human prostate cancer to study intraprostatic tumor growth and the development of lymph node metastases.Prostate. 2018 Jun;78(9):664-675. doi: 10.1002/pros.23508. Epub 2018 Mar 24. Prostate. 2018. PMID: 29572953
-
Epithelial cell adhesion molecule (EpCAM) is involved in prostate cancer chemotherapy/radiotherapy response in vivo.BMC Cancer. 2018 Nov 12;18(1):1092. doi: 10.1186/s12885-018-5010-5. BMC Cancer. 2018. PMID: 30419852 Free PMC article.
-
In vivo magnetic resonance imaging of orthotopic prostate cancer.Biotechniques. 2020 Jul;69(1):395-403. doi: 10.2144/btn-2020-0021. Epub 2020 May 2. Biotechniques. 2020. PMID: 32363906
-
Longitudinal anatomical and metabolic MRI characterization of orthotopic xenograft prostate tumors in nude mice.J Magn Reson Imaging. 2014 Oct;40(4):848-56. doi: 10.1002/jmri.24433. Epub 2013 Nov 4. J Magn Reson Imaging. 2014. PMID: 24924594
-
Quantitative volumetric imaging of normal, neoplastic and hyperplastic mouse prostate using ultrasound.BMC Urol. 2015 Sep 21;15:97. doi: 10.1186/s12894-015-0091-9. BMC Urol. 2015. PMID: 26391476 Free PMC article.
Cited by
-
Three-dimensional measurement and analysis of benign prostatic hyperplasia.Transl Androl Urol. 2021 Jun;10(6):2384-2396. doi: 10.21037/tau-21-142. Transl Androl Urol. 2021. PMID: 34295725 Free PMC article.
-
In Silico Modeling Demonstrates that User Variability During Tumor Measurement Can Affect In Vivo Therapeutic Efficacy Outcomes.Cancer Inform. 2022 Nov 29;21:11769351221139257. doi: 10.1177/11769351221139257. eCollection 2022. Cancer Inform. 2022. PMID: 36465983 Free PMC article.
-
Macrophage accumulation within coronary arterial wall in diabetic patients with acute coronary syndrome: a study with in-vivo intravascular imaging modalities.Cardiovasc Diabetol. 2020 Sep 5;19(1):135. doi: 10.1186/s12933-020-01110-8. Cardiovasc Diabetol. 2020. PMID: 32891145 Free PMC article.
-
CT vs. bioluminescence: A comparison of imaging techniques for orthotopic prostate tumors in mice.PLoS One. 2022 Nov 4;17(11):e0277239. doi: 10.1371/journal.pone.0277239. eCollection 2022. PLoS One. 2022. PMID: 36331948 Free PMC article.
-
Trends in Subcutaneous Tumour Height and Impact on Measurement Accuracy.Cancer Inform. 2023 Apr 19;22:11769351231165181. doi: 10.1177/11769351231165181. eCollection 2023. Cancer Inform. 2023. PMID: 37113645 Free PMC article.
References
MeSH terms
LinkOut - more resources
Full Text Sources
Medical
Miscellaneous
