. 2019 Aug;176(15):2736-2749.
doi: 10.1111/bph.14695. Epub 2019 Jun 17.

Inhibitors of DAG metabolism suppress CCR2 signalling in human monocytes

Affiliations

Inhibitors of DAG metabolism suppress CCR2 signalling in human monocytes

Priscilla Day et al. Br J Pharmacol. 2019 Aug.

Abstract

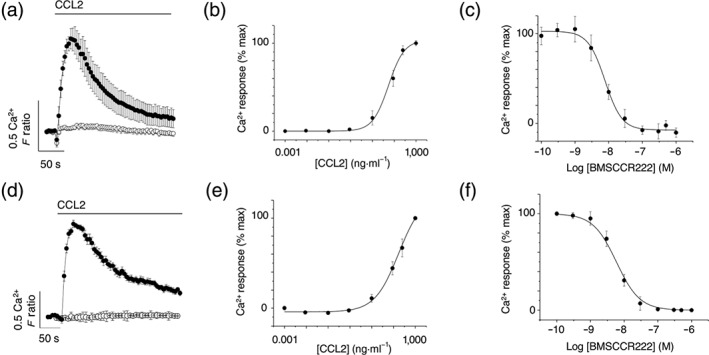
Background and purpose: CCL2 is an inflammatory chemokine that stimulates the recruitment of monocytes into tissue via activation of the GPCR CCR2.

Experimental approach: Freshly isolated human monocytes and THP-1 cells were used. Fura-2 loaded cells were used to measure intracellular Ca2+ responses. Transwell migration to measure chemotaxis. siRNA-mediated gene knock-down was used to support pharmacological approaches.

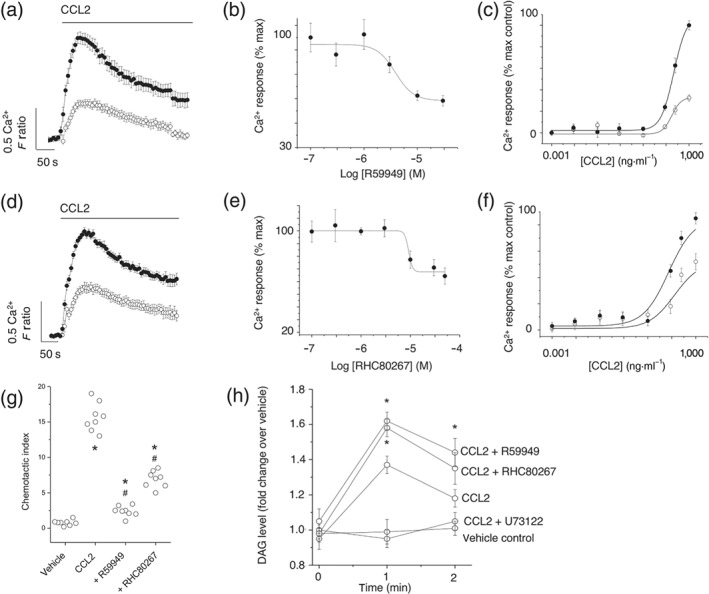
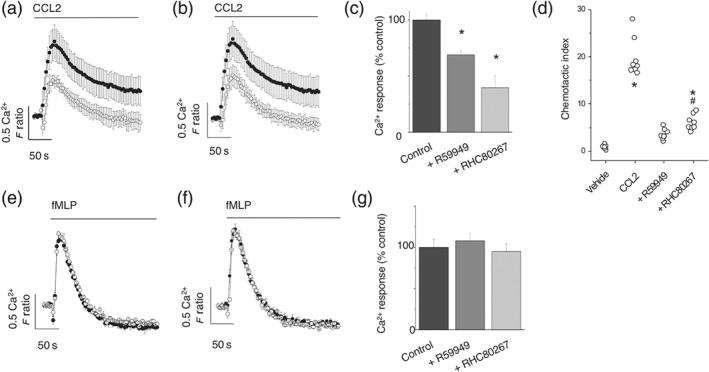
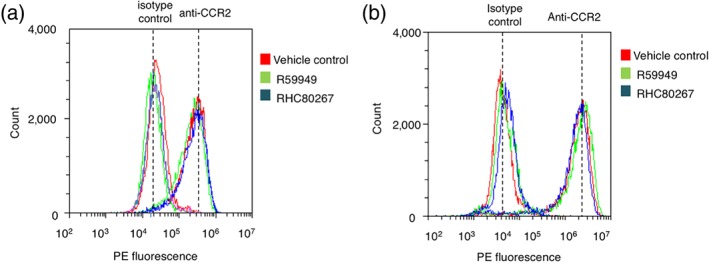
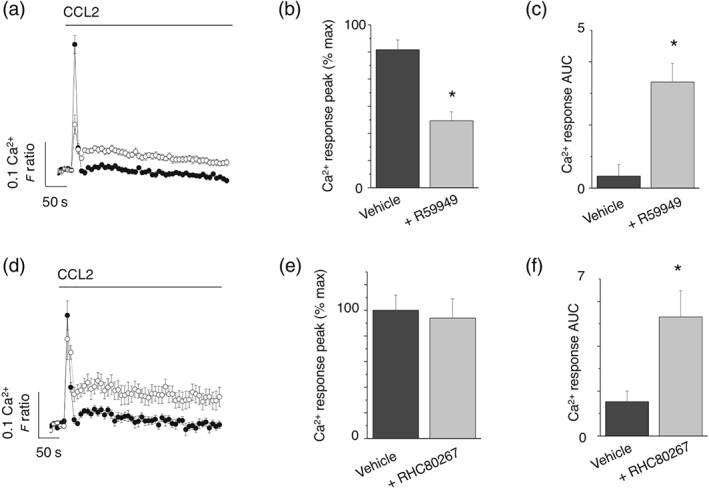
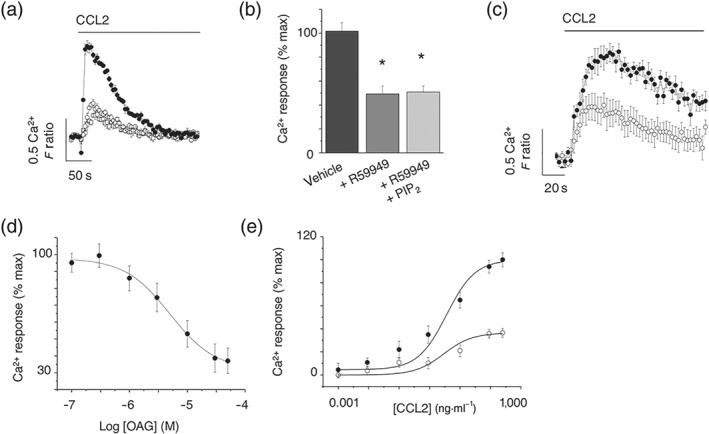
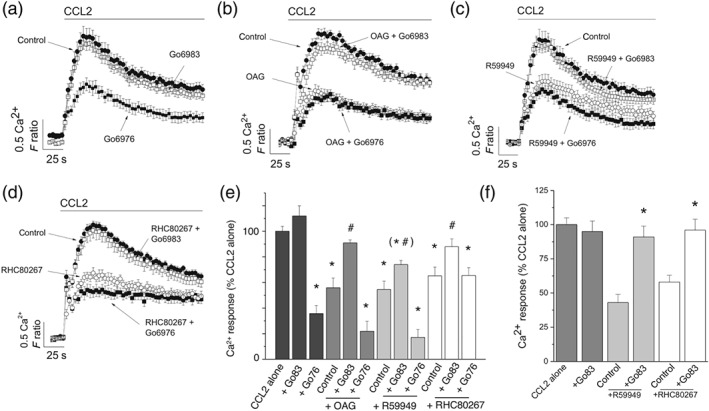
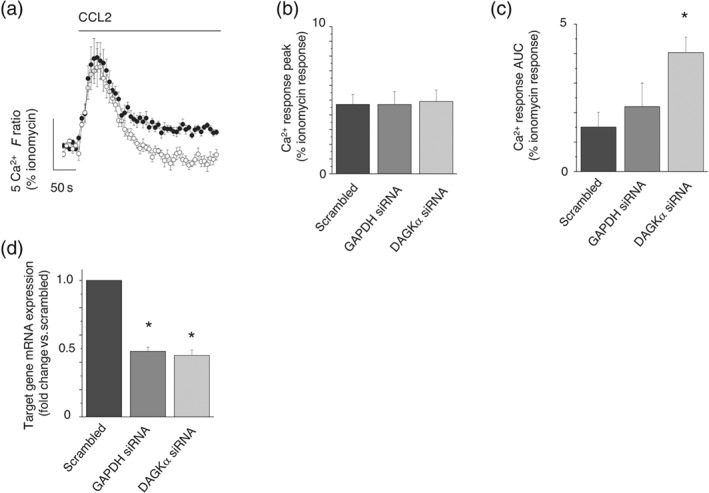
Key results: CCL2 evoked intracellular Ca2+ signals and stimulated migration in THP-1 monocytic cells and human CD14+ monocytes in a CCR2-dependent fashion. Attenuation of DAG catabolism in monocytes by inhibiting DAG kinase (R59949) or DAG lipase (RHC80267) activity suppressed CCL2-evoked Ca2+ signalling and transwell migration in monocytes. These effects were not due to a reduction in the number of cell surface CCR2. The effect of inhibiting DAG kinase or DAG lipase could be mimicked by addition of the DAG analogue 1-oleoyl-2-acetyl-sn-glycerol (OAG) but was not rescued by application of exogenous phosphatidylinositol 4,5-bisphosphate. Suppressive effects of R59949, RHC80267, and OAG were partially or fully reversed by Gö6983 (pan PKC isoenzyme inhibitor) but not by Gö6976 (PKCα and PKCβ inhibitor). RNAi-mediated knock-down of DAG kinase α isoenzyme modulated CCL2-evoked Ca2+ responses in THP-1 cells.

Conclusions and implications: Taken together, these data suggest that DAG production resulting from CCR2 activation is metabolised by both DAG kinase and DAG lipase pathways in monocytes and that pharmacological inhibition of DAG catabolism or application suppresses signalling on the CCL2-CCR2 axis via a mechanism dependent upon a PKC isoenzyme that is sensitive to Gö6983 but not Gö6976.


Conflict of interest statement

The authors declare no conflicts of interest.

Figures

Figure 1
Figure 1
CCR2 is the cognate receptor for CCL2 in freshly isolated human monocytes and THP‐1 monocytic cells. (a) Averaged (n = 8) intracellular Ca2+ response to CCL2 (50 ng·ml−1) in freshly isolated CD14+ human monocytes. Response in the presence (open circles) and absence (closed circles) of 5‐μM U73122 (n = 6; P < .05). (b) Concentration–response curve for CCL2‐evoked responses in freshly isolated monocytes (n = 8; EC50 = 33 ± 4 nM). (c) Concentration–inhibition curve for selective CCR2 antagonist BMSCCR222 (IC50 = 9 ± 1 nM; n = 8) against Ca2+ responses evoked by CCL2 (50 ng·ml−1) in freshly isolated monocytes. (d) Averaged (n = 6) intracellular Ca2+ response to CCL2 (50 ng·ml−1) in THP‐1 cells. Response in the presence (open circles) and absence (closed circles) of 5‐μM U73122 (n = 6; P < .05). (e) Concentration–response curve for CCL2‐evoked responses in THP‐1 cells (n = 6; EC50 = 45 ± 12 nM). (f) Concentration–inhibition curve for BMSCCR222 (IC50 = 8 ± 1 nM; n = 6) against Ca2+ responses evoked by CCL2 (50 ng·ml−1) in THP‐1 cells. F ratio is the Ca2+ response as measured by the Fura‐2 emission intensity ratio when excited at 340 and 380 nm. Data in concentration–response/inhibition curves are expressed as a percentage of the control response in the presence of vehicle alone
Figure 2
Figure 2
Inhibitors of DAG kinase and DAG lipase attenuate CCL2‐evoked Ca2+ signalling and migration in THP‐1 cells. (a) Effect of DAG kinase inhibitor R59949 (30 μM) on Ca2+ responses evoked by CCL2 (50 ng·ml−1; n = 7). Averaged responses are shown in the presence of vehicle (closed circles) and inhibitor (open circles). (b) R59949 concentration–inhibition curve (IC50 = 9 ± 1 μM; n = 7) against Ca2+ responses evoked by CCL2 (50 ng·ml−1). (c) Effect of 30‐μM R59949 on CCL2 concentration–response curve (n = 7). (d) Effect of DAG lipase inhibitor RHC80267 (30 μM) on Ca2+ responses evoked by CCL2 (50 ng·ml−1; n = 7). Averaged responses are shown in the presence of vehicle (closed circles) and inhibitor (open circles). (e) RHC80267 concentration–inhibition curve (IC50 = 9 ± 1 μM; n = 7) against Ca2+ responses evoked by CCL2 (50 ng·ml−1). (f) Effect of 30‐μM RHC80267 on CCL2 concentration–response curve (n = 7). (g) Effect of R59949 (30 μM) and RHC80267 (30 μM) on THP‐1 transmigration to CCL2 (3 ng·ml−1). *P < .05 versus vehicle and # P < .05 versus CCL2 alone (n = 8). F ratio is the Ca2+ response as measured by the Fura‐2 emission intensity ratio when excited at 340 and 380 nm. Data in concentration–response/inhibition curves are expressed as a percentage of the control response in the presence of vehicle alone. (h) Biochemical measurement of DAG changes in THP‐1 cells. Cells preincubated for 30 min with U73122 (5 μM), R59949 (30 μM), or RHC80267 (30 μM) prior to CCL2 challenge (50 ng·ml−1) for 1 or 2 min (n = 6). Vehicle control; cells are preincubated with vehicle and not challenged with CCL2. *P < .05 versus CCL2 alone
Figure 3
Figure 3
Responses to CCL2 but not fMLP are attenuated by DAG kinase and DAG lipase inhibitors in freshly isolated human monocytes. Effect of (a) DAG kinase inhibitor R59949 (30 μM) and (b) DAG lipase inhibitor RHC80267 (30 μM) on Ca2+ responses evoked by CCL2 (50 ng·ml−1) in monocytes (n = 8). Averaged responses are shown in the presence of vehicle (closed circles) and inhibitor (open circles). (c) Bar chart showing effect of R59949 (30 μM) and RHC80267 (30 μM) on the peak Ca2+ response evoked by CCL2 (50 ng·ml−1; n = 8). (d) Effect of R59949 (30 μM) and RHC80267 (30 μM) on freshly isolated monocyte transmigration to CCL2 (3 ng·ml−1). *P < .05 versus vehicle and # P < .05 versus CCL2 alone (n = 8). Lack of effect of (e) R59949 (30 μM) or (f) RHC80267 (30 μM) on Ca2+ responses evoked by fMLP (10 μM) in monocytes (n = 6). Averaged responses are shown in the presence of vehicle (closed circles) and inhibitor (open circles). (g) Bar chart showing lack of effect of R59949 (30 μM) and RHC80267 (30 μM) on peak Ca2+ response evoked by fMLP (10 μM; n = 6). F ratio is the Ca2+ response as measured by the Fura‐2 emission intensity ratio when excited at 340 and 380 nm. Data in inhibition experiments are expressed as a percentage of the control response in the presence of vehicle alone
Figure 4
Figure 4
Inhibition of DAG kinase or DAG lipase does not reduce the cell surface population of CCR2 in freshly isolated monocytes and THP‐1 cells. Three representative (n = 6) flow cytometry profiles of freshly isolated CD14+ monocytes (a) and THP‐1 cells (b) labelled with anti‐CCR2 antibodies or isotype control. Cells were treated with vehicle control, R59949 (30 μM), or RHC80267 (30 μM). Anti‐CCR2 cell surface immunoreactivity is indistinguishable between vehicle control and test groups
Figure 5
Figure 5
Effects of DAG kinase and DAG lipase inhibitors on CCL2‐evoked Ca2+ responses in THP‐1 cells in the absence of extracellular Ca2+. (a) Averaged (n = 8) intracellular Ca2+ responses evoked by CCL2 (50 ng·ml−1) in the absence of extracellular Ca2+ and presence (open circles) and absence (closed circles) of R59949 (30 μM). (b) and (c) show the effect of R59949 on intracellular Ca2+ peak and AUC in the absence of extracellular Ca2+ (n = 8). (d) Averaged (n = 8) intracellular Ca2+ responses evoked by CCL2 (50 ng·ml−1) in the absence of extracellular Ca2+ and presence (open circles) and absence (closed circles) of RHC80267 (30 μM). (e) and (f) show the effect of R59949 on intracellular Ca2+ peak and AUC in the absence of extracellular Ca2+ (n = 8). *P < .05 versus vehicle control for all
Figure 6
Figure 6
Application of exogenous PIP2 does not rescue CCL2‐evoked Ca2+ response following DAG kinase inhibition, but inhibition is mimicked by OAG in THP‐1 cells. (a) CCL2‐evoked (50 ng·ml−1) intracellular Ca2+ responses in the presence of vehicle control (closed circles), R59949 (open circles; 30 μM), or R59949 plus exogenous PIP2 (squares; 300 μM; n = 8). (b) Bar chart showing average peak intracellular Ca2+ responses. *P < .05 versus vehicle control. (c) CCL2‐evoked (50 ng·ml−1) intracellular Ca2+ responses in the presence of vehicle control (closed circles) or cell permeable DAG analogue, OAG (open circles; n = 8). (d) Concentration–inhibition curve for OAG effect on intracellular Ca2+ responses evoked by CCL2 (50 ng·ml−1; n = 8). (e) Effect of OAG (30 μM) on CCL2 concentration–response curve in THP‐1 cells (IC50 9 ± 1 μM; n = 6). Responses are in the presence of vehicle control (closed circles) or OAG (open circles). F ratio is the Ca2+ response as measured by the Fura‐2 emission intensity ratio when excited at 340 and 380 nm. Data in inhibition experiments are expressed as a percentage of the control response in the presence of vehicle alone
Figure 7
Figure 7
Effect of inhibiting Ca2+‐dependent and Ca2+‐independent PKC isoforms on CCL2‐evoked responses following inhibition of DAG kinase and DAG lipase in THP‐1 cells and freshly isolated monocytes. (a) CCL2‐evoked intracellular Ca2+ responses in THP‐1 cells in the presence of vehicle control, Gö6976 (100 nM), or Gö6983 (100 nM; n = 8). (b) CCL2‐evoked intracellular Ca2+ responses in THP‐1 cells in the presence of vehicle control and OAG (30 μM) in the presence and absence of Gö6976 or Gö6983 (n = 8). (c) CCL2‐evoked intracellular Ca2+ responses in THP‐1 cells in the presence of vehicle control and R59949 (30 μM) in the presence and absence of Gö6976 or Gö6983 (n = 8). (d) CCL2‐evoked intracellular Ca2+ responses in THP‐1 cells in the presence of vehicle control and RHC80267 (30 μM) in the presence and absence of Gö6976 or Gö6983 (n = 8). (e) Bar chart showing averaged data from experiments (a–d). (f) Bar chart showing CCL2‐evoked Ca2+ responses in freshly isolated monocytes and the effect of R59949 (30 μM) and RHC80267 (30 μM), in the presence and absence of Gö6983 (100 nM; n = 8). All intracellular Ca2+ responses were evoked by 50‐ng·ml−1 CCL2. *P < .05 versus CCL2 and # P < .05 for combined inhibitors compared to OAG, R59949, or RHC80267 alone. F ratio is the Ca2+ response as measured by the Fura‐2 emission intensity ratio when excited at 340 and 380 nm. Data in inhibition experiments are expressed as a percentage of the control response in the presence of vehicle alone
Figure 8
Figure 8
Effect of DAG kinase α knock‐down of CCL2‐evoked Ca2+ responses in THP‐1 cells. (a) Averaged intracellular Ca2+ response evoked by CCL2 in THP‐1 cells transfected with scrambled siRNA (closed circles) or DAG kinase α targeted siRNA (open circles; n = 8). Bar charts showing peak (b) and AUC (c) intracellular Ca2+ responses evoked by CCL2 in scrambled, GAPDH knock‐down, or DAG kinase α knock‐down THP‐1 cells (n = 8). (d) qRT‐PCR analysis of GAPDH or DAG kinase α mRNA transcripts in scrambled and knock‐down THP‐1 cells (n = 8). F ratio is the Ca2+ response as measured by the Fura‐2 emission intensity ratio when excited at 340 and 380 nm. Responses evoked by 50‐ng·ml−1 CCL2 for all experiments. *P < .05 versus scrambled control cells in all experiments. Data in each experiment are expressed as a percentage of the Ca2+ response evoked by ionomycin in control for cell number in knock‐down studies

Similar articles

Cited by

References

    1. Alexander, S. P. H. , Christopoulos, A. , Davenport, A. P. , Kelly, E. , Marrion, N. V. , Peters, J. A. , … CGTP Collaborators . (2017). The Concise Guide to PHARMACOLOGY 2017/18: G protein‐coupled receptors. British Journal of Pharmacology, 174(S1), S17–S129. 10.1111/bph.13878 - DOI - PMC - PubMed
    1. Alexander, S. P. H. , Fabbro, D. , Kelly, E. , Marrion, N. V. , Peters, J. A. , Faccenda, E. , … CGTP Collaborators . (2017). The Concise Guide to PHARMACOLOGY 2017/18: Enzymes. British Journal of Pharmacology, 174(S1), S272–S359. 10.1111/bph.13877 - DOI - PMC - PubMed
    1. Alon, R. , & Feigelson, S. W. (2012). Chemokine‐triggered leukocyte arrest: force‐regulated bi‐directional integrin activation in quantal adhesive contacts. Current Opinion in Cell Biology, 24, 670–676. 10.1016/j.ceb.2012.06.001 - DOI - PubMed
    1. Ashida, N. , Arai, H. , Yamasaki, M. , & Kita, T. (2001). Distinct signaling pathways for MCP‐1‐dependent integrin activation and chemotaxis. The Journal of Biological Chemistry, 276, 16555–16560. 10.1074/jbc.M009068200 - DOI - PubMed
    1. Assani, K. , Shrestha, C. L. , Robledo‐Avila, F. , Rajaram, M. V. , Partida‐Sanchez, S. , Schlesinger, L. S. , & Kopp, B. T. (2017). Human cystic fibrosis macrophages have defective calcium‐dependent protein kinase C activation of the NADPH oxidase, an effect augmented by Burkholderia cenocepacia . Journal of Immunology, 198, 1985–1994. 10.4049/jimmunol.1502609 - DOI - PMC - PubMed

Publication types

MeSH terms