. 2019 Jun;13(6):1419-1432.
doi: 10.1002/1878-0261.12496. Epub 2019 May 15.

AMPK activation induced in pemetrexed-treated cells is associated with development of drug resistance independently of target enzyme expression

Affiliations

AMPK activation induced in pemetrexed-treated cells is associated with development of drug resistance independently of target enzyme expression

Yiyang Qin et al. Mol Oncol. 2019 Jun.

Abstract

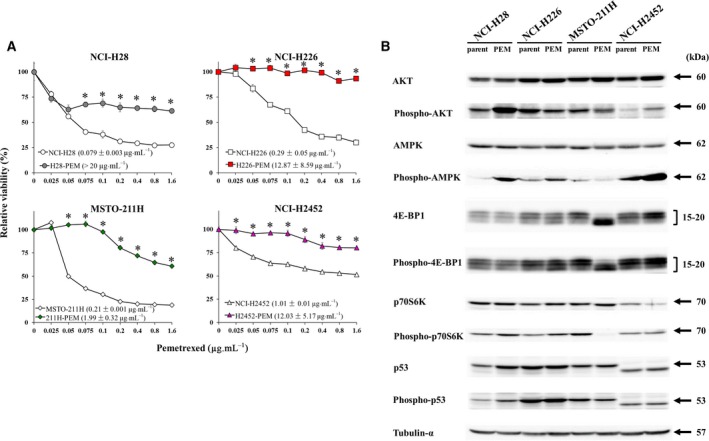
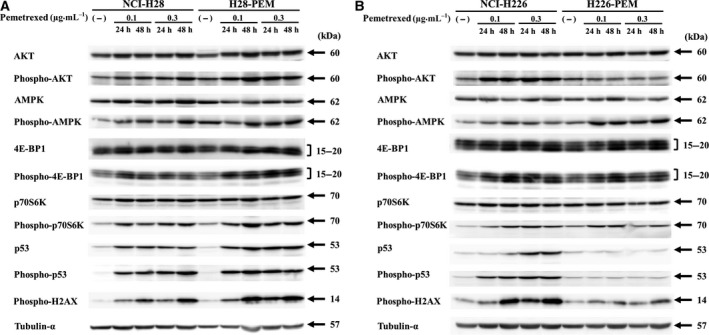
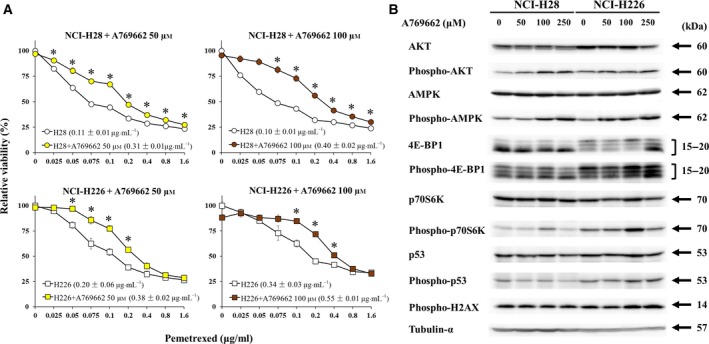
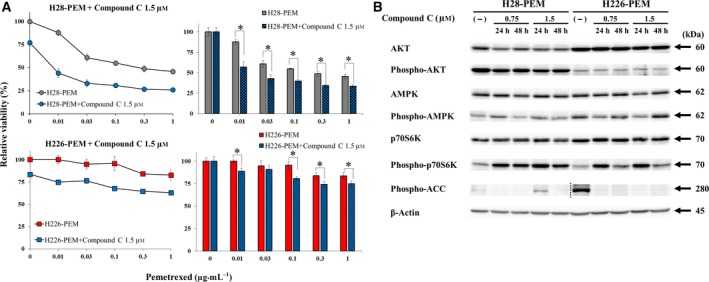
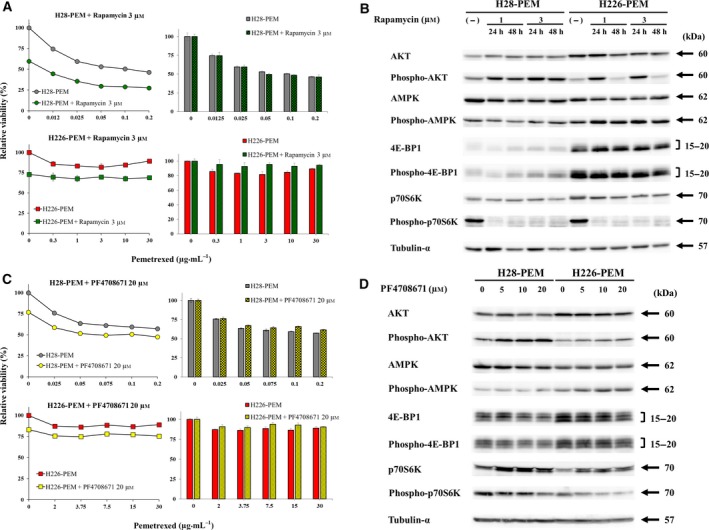
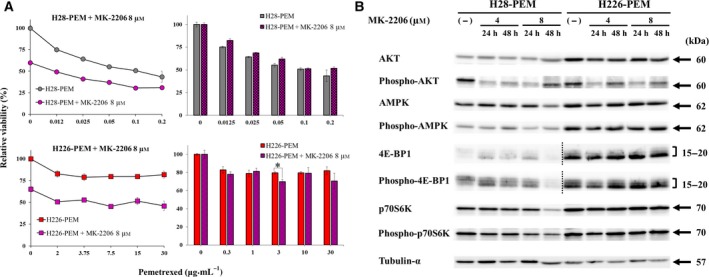
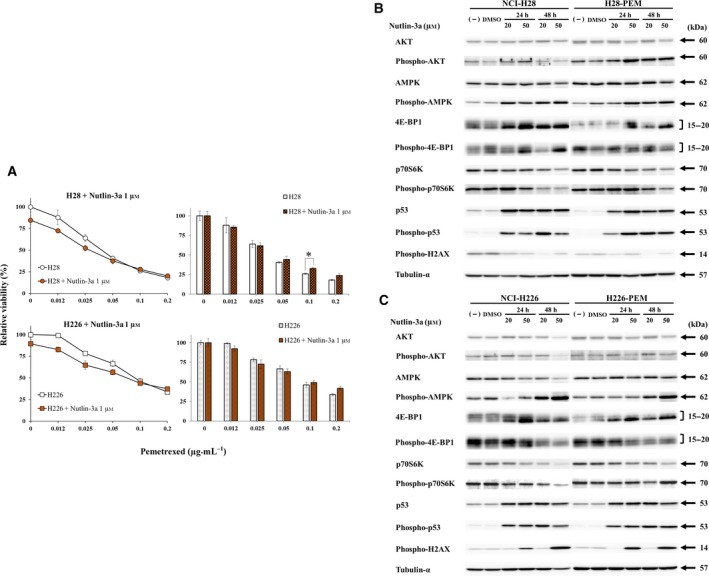
Pemetrexed (PEM) inhibits DNA and RNA synthesis and is currently one of the first-line agents for mesothelioma. PEM suppresses the activities of several enzymes involved in purine and pyrimidine synthesis, and elevated activity of these enzymes in tumors is often linked with resistance to PEM. The agent also stimulates AMP-activated protein kinase (AMPK) and consequently influences the mammalian target of rapamycin complex 1 (mTORC1) pathways. Nevertheless, it remains unclear whether PEM resistance is linked to the AMPK or mTORC1 pathways. Here, we established two independent PEM-resistant mesothelioma cell lines in which expression of the PEM-target enzymes was not elevated, and found that levels of phosphorylated AMPK and p70S6K and, to a lesser extent, levels of phosphorylated AKT and p53, were increased in these cells as compared with the respective parent cells. PEM stimulation also augmented phosphorylation of AMPK, p70S6K, AKT and p53 in most cases. An AMPK activator increased phosphorylation and PEM resistance in parental cells, and the inhibitor decreased the resistance of PEM-resistant cells. In contrast, inhibitors for p70S6K and AKT did not influence PEM resistance; furthermore, increased levels of endogenous p53 did not affect PEM sensitivity. These data collectively indicate that constitutive activation of AMPK is associated with PEM resistance, and that this is unconnected with elevated DNA and RNA synthesis.

Keywords: AMP-activated protein kinase; drug resistance; mTORC1; mesothelioma; pemetrexed.


Conflict of interest statement

The authors declare that there is no conflict of interests in this research. We obtained a grant from Nichias Corporation. Nichias Corporation is not a pharmaceutical company but a company making industrial products for building, automobiles and pipes (see http://www.nichias.co.jp/). The grant is part of their mécénat activities, corporate sponsorship, with the aim to assist medical research about intractable cancer treatments. We are thereby connected to any employment, consultancy, patents, products in development or marketed products of the company.

Figures

Figure 1
Figure 1
Cell viability and expression of AMPK and related molecules in parent and PEM‐resistant cells. (A) Paired cells, NCI‐H28/H28‐PEM, NCI‐H226/H226‐PEM, MSTO‐211H/211H‐PEM, and NCI‐H2452/H2452‐PEM cells, were treated with various concentrations of PEM as indicated for 72 h and cell viability was measured with the WST assay. Average and standard error bars are shown (n = 3). IC50 values with SE are shown as pg·mL−1 and asterisks indicate statistical significance of PEM sensitivity between parent and PEN‐resistant cells (P < 0.05, ANOVA). (B) Paired parent and PEM‐resistant cells were examined for expression levels of AMPK and the related molecules with Western blot analysis as indicated. Tubulin‐α was used as a loading control.
Figure 2
Figure 2
Expression of AMPK and related molecules in PEM‐resistant and parent cells. (A) NCI‐H28 and H28‐PEM cells or (B) NCI‐H226 and H226‐PEM cells were treated with PEM as indicated for 24 or 48 h, and the cell lysate was subjected to Western blot analysis. Tubulin‐α was used as a loading control.
Figure 3
Figure 3
AMPK activation decreased PEM sensitivity. (A) NCI‐H28 and NCI‐H226 cells treated with or without A769662 were further incubated with PEM as indicated and the viability was assayed with the WST assay. Average and standard error bars are shown (n = 3). IC50 values with SE are shown as pg·mL−1, and asterisks indicate statistical significance of PEM sensitivity between parent and PEN‐resistant cells (P < 0.05, ANOVA). (B) Western blot analysis on expression levels of AMPK and related molecules. Cells were treated with A769662 as indicated for 48 h. Tubulin‐α was used as a loading control.
Figure 4
Figure 4
AMPK inactivation decreased PEM resistance. (A) H28‐PEM and H226‐PEM treated with or without compound C (1.5 μm) were further incubated with PEM as indicated and the viability was assayed with the WST assay. The bar graphs on the right showed relative viability that was calculated based on the viability of cells untreated or treated with compound C at 1.5 μm alone. Standard error bars are also shown (n = 3). *< 0.05 (ANOVA). (B) Western blot analysis on expression levels of AMPK and related molecules in cells which were treated with compound C as indicated. β‐Actin was used as a loading control. A dotted line shows that blots of H28‐PEM and H226‐PEM cells were separately conducted due to differential expression levels of phosphorylated ACC between the cells.
Figure 5
Figure 5
Inhibition of p70S6K was not associated with PEM resistance. (A) Cells treated with or without rapamycin (3 μm) were further incubated with PEM as indicated and the viability was assayed with the WST assay. The bar graphs on the right showed relative viability that were calculated based on the absorbance of cells untreated or treated with rapamycin at 3 μm alone. Standard error bars are also shown (n = 3). (B) Western blot analysis of cells treated with rapamycin as indicated. Tubulin‐α was used as a loading control. (C) Cells treated with or without PF4708671 (20 μm) were further incubated with PEM as indicated and the viability was assayed with the WST assay. The bar graphs on the right showed relative viability that were calculated based on the absorbance of cells untreated or treated with PF4708671 at 20 μm alone. Standard error bars are also shown (n = 3). Standard error bars are also shown (n = 3). (D) Western blot analysis of cells treated with PF4708671 as indicated. Tubulin‐α was used as a loading control.
Figure 6
Figure 6
Inhibition of AKT was not associated with PEM resistance. (A) Cells treated with or without MK‐2206 (8 μm) were further incubated with PEM as indicated and the viability was assayed with the WST assay. The bar graphs on the right showed relative viability that were calculated based on the absorbance of cells untreated or treated with MK‐2206 at 8 μm alone. Standard error bars are also shown (n = 3). *P < 0.05 (ANOVA). (B) Western blot analysis of cells treated with MK‐2206 as indicated. Tubulin‐α was used as a loading control. Dotted lines show that exposure time of blots derived from H28‐PEM cells (long exposure) and H226‐PEM cells (short exposure) was different because of the differential expression levels of 4E‐BP1 and phosphorylated 4E‐BP1 between the cells.
Figure 7
Figure 7
Augmented p53 expression was not associated with PEM resistance. (A) Cells treated with or without nutlin‐3a (1 μm) were further incubated with PEM as indicated and the viability was assayed with the WST assay. The bar graphs on the right showed relative viability that were calculated based on the absorbance of cells untreated or treated with nutlin‐3a at 1 μm alone. Standard error bars are also shown (n = 3). *P < 0.05 (ANOVA). (B) Western blot analysis of NCI‐H28 and H28‐PEM (B) or NCI‐H226 and H226‐PEM (C) cells treated with DMSO as a control as indicated. Tubulin‐α was used as a loading control.

References

    1. Borgdorff V, Rix U, Winter GE, Gridling M, Müller AC, Breitwieser FP, Wagner C, Colinge J, Bennett KL, Superti‐Furga G et al (2014) A chemical biology approach identifies AMPK as a modulator of melanoma oncogene MITF. Oncogene 33, 2531–2539. - PubMed
    1. Bronte G, Incorvaia L, Rizzo S, Passiglia F, Galvano A, Rizzo F, Rolfo C, Fanale D, Listì A, Natoli C et al (2016) The resistance related to targeted therapy in malignant pleural mesothelioma: why has not the target been hit yet? Crit Rev Oncol Hematol 107, 20–32. - PubMed
    1. Budanov AV and Karin M (2008) p53 target genes sestrin1 and sestrin2 connect genotoxic stress and mTOR signaling. Cell 134, 451–460. - PMC - PubMed
    1. Buqué A, Muhialdin J, Muñoz A, Calvo B, Carrera S, Aresti U, Sancho A, Rubio I and López‐Vivanco G (2012) Molecular mechanism implicated in Pemetrexed‐induced apoptosis in human melanoma cells. Mol Cancer 11, 25. - PMC - PubMed
    1. Di Marzo D, Forte IM, Indovina P, Di Gennaro E, Rizzo V, Giorgi F, Mattioli E, Iannuzzi CA, Budillon A, Giordano A et al (2014) Pharmacological targeting of p53 through RITA is an effective antitumoral strategy for malignant pleural mesothelioma. Cell Cycle 13, 652–665. - PubMed

Publication types

MeSH terms

Substances