. 2019 Jun;8(6):3072-3085.
doi: 10.1002/cam4.2113. Epub 2019 Apr 29.

Dissecting intratumoral myeloid cell plasticity by single cell RNA-seq

Affiliations

Dissecting intratumoral myeloid cell plasticity by single cell RNA-seq

Qianqian Song et al. Cancer Med. 2019 Jun.

Abstract

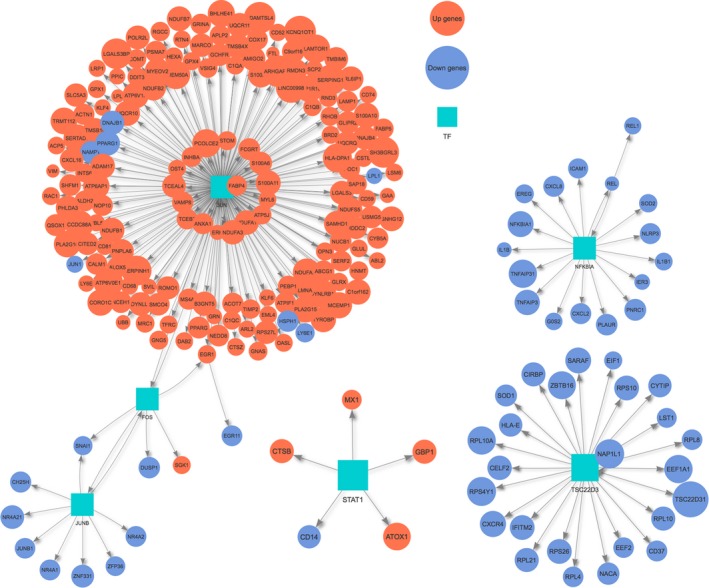
Tumor-infiltrating myeloid cells are the most abundant leukocyte population within tumors. Molecular cues from the tumor microenvironment promote the differentiation of immature myeloid cells toward an immunosuppressive phenotype. However, the in situ dynamics of the transcriptional reprogramming underlying this process are poorly understood. Therefore, we applied single cell RNA-seq (scRNA-seq) to computationally investigate the cellular composition and transcriptional dynamics of tumor and adjacent normal tissues from 4 early-stage non-small cell lung cancer (NSCLC) patients. Our scRNA-seq analyses identified 11 485 cells that varied in identity and gene expression traits between normal and tumor tissues. Among these, myeloid cell populations exhibited the most diverse changes between tumor and normal tissues, consistent with tumor-mediated reprogramming. Through trajectory analysis, we identified a differentiation path from CD14+ monocytes to M2 macrophages (monocyte-to-M2). This differentiation path was reproducible across patients, accompanied by increased expression of genes (eg, MRC1/CD206, MSR1/CD204, PPARG, TREM2) with significantly enriched functions (Oxidative phosphorylation and P53 pathway) and decreased expression of genes (eg, CXCL2, IL1B) with significantly enriched functions (TNF-α signaling via NF-κB and inflammatory response). Our analysis further identified a co-regulatory network implicating upstream transcription factors (JUN, NFKBIA) in monocyte-to-M2 differentiation, and activated ligand-receptor interactions (eg, SFTPA1-TLR2, ICAM1-ITGAM) suggesting intratumoral mechanisms whereby epithelial cells stimulate monocyte-to-M2 differentiation. Overall, our study identified the prevalent monocyte-to-M2 differentiation in NSCLC, accompanied by an intricate transcriptional reprogramming mediated by specific transcriptional activators and intercellular crosstalk involving ligand-receptor interactions.

Keywords: intercellular interaction; monocyte-to-M2 differentiation; non-small cell lung cancer (NSCLC); single-cell RNA sequencing (scRNA-seq); trajectory analysis.


Conflict of interest statement

The authors declare that they have no competing interests.

Figures

Figure 1
Figure 1
The immunological composition of NSCLC varies across patients and tumor/normal pairs. Cell clusters resolved by PCA‐based t‐distributed stochastic neighbor embedding (t‐SNE) are shown in aggregate analysis of paired tumor/normal samples, and identified by cell type in (A), and tumor versus normal tissue of origin in (B). (C) Cell type‐specific plots illustrate the tumor‐to tumor heterogeneity in the irregularity of change of immune cell abundance (Y axis, percentage) between matched normal and tumor tissues. Patients are indicated by colored lines, tissue type by circle or triangle
Figure 2
Figure 2
Myeloid cell reprogramming in each patient. Left panel shows the differentiation paths involved in the myeloid cells reprogramming. Right panel includes the plots delineating the myeloid cell reprogramming trajectory for each patient (P1‐P4). Cells on the trajectories are aligned in the order of differentiation (the arrow shape), representing the gradual transition from initial state to cell fate state. The trajectory on the left of each plot shows the tissue source of cells located on the trajectory (cyan, adjacent normal tissue; orange, tumor tissue). The trajectory on the right of each plot shows the cells colored by cell types (eg, blue, CD14+ monocytes; yellow, M2 macrophages)
Figure 3
Figure 3
Systematic myeloid cell reprogramming across patients. (A). Cells on the trajectories are aligned in the order of differentiation (the arrow shape), representing the gradual transition from initial state to cell fate state. The left trajectory shows the tissue source of cells (cyan, adjacent normal tissue; orange, tumor tissue). The right trajectory shows the cells colored by cell types (eg, blue, CD14+ monocytes; yellow, M2 macrophages). (B) Heatmap shows the gradual up‐ and downregulated expression of genes during the monocyte‐to‐M2 differentiation. Genes (row) are clustered to 3 groups for better visualization and cells (column) are ordered according to the monocyte‐to‐M2 differentiation path (ie, from root to AT1); (C). Scatter plots show the expression of cell differentiation markers in individual cells involved in the monocyte‐to‐M2 differentiation. The y‐axis represents the relative gene expression while the x‐axis represents the monocyte‐to‐M2 differentiation. Each dot in the scatter plot represents the gene expression (lg(counts + 1)) of each cell. (D). Significantly, enriched terms in the Hallmark collection (y‐axis) are shown in bar plots based on the gradually up (red) and down‐regulated (cyan) genes in the monocyte‐to‐M2 differentiation. The x‐axis represents ‐lg(adj.p)/10, which is calculated by the enrichment test (see Methods)
Figure 4
Figure 4
Co‐regulatory network in the monocyte‐to‐M2 differentiation. Transcriptional regulatory network involved in the monocyte‐to‐M2 differentiation. Transcriptional regulators are shown as nodes (square) with connected genes (circle). Orange color represents the upregulated genes whereas light blue represents the downregulated genes in the monocyte‐to‐M2 differentiation
Figure 5
Figure 5
Intercellular interactions mediate the monocyte‐to‐M2 differentiation. (A). All single cells are visualized in the tSNE plot and are labeled by different colors to distinguish cell types. Epithelial cells, monocyte, and M2 macrophages are highlighted with shadows. (B). Bar plot depicts the percentage of ligand expressed by certain cell types, corresponding to the cognate receptors expressed by monocytes and M2 macrophages. The number of ligands was calculated based on their expression in scRNA‐seq data. All interactions refer to the specific indicated ligands from other cells that interact with the corresponding receptors expressed by monocytes and M2 macrophages. (C). The tSNE visualization of cells expressing ligands and corresponding receptors
Figure 6
Figure 6
Intratumoral epithelial cells may impact the monocyte‐to‐M2 differentiation. (A). The t‐SNE plot highlights the epithelial cell subsets with shadows. (B). Volcano plot shows the differentially expressed genes between subset 1 versus subset 2. Log (fold change) of genes between the 2 subsets is plotted on the x‐axis, and the adjusted P‐value (−1 × log 10 scale) is plotted on the y‐axis. Red dots represent genes with adjusted P‐value < 0.05. Blue dots represent the genes with adjusted P‐value < 0.01 and |log2 FC|>1. (C). Heatmap shows the expression of the differentially expressed genes in the 2 epithelial cell subsets. Color scheme is based on z‐score distribution, from − 2 (purple) to 2 (yellow). Genes (rows) with (log2 Fold Change) >1 and adjusted P‐value < 0.01 are listed in respective of each subset. (D). Significantly, enriched pathways in the KEGG database (y‐axis) are shown in bar plots for each subset. The x‐axis represents ‐lg(adj.p)/10, which is calculated by the enrichment test (see Methods)

References

    1. Siegel RL, Miller KD, Jemal A. Cancer Statistics, 2018. Ca‐Cancer J Clin. 2018;68(1):7‐30. - PubMed
    1. Ettinger DS, Wood DE, Aisner DL, et al. Cell Lung cancer, version 5.2017, NCCN clinical practice guidelines in oncology. J Natl Compr Canc Netw. 2017;15(4):504‐535. - PubMed
    1. Goldstraw P, Chansky K, Crowley J, et al. The IASLC lung cancer staging project: proposals for revision of the TNM stage groupings in the forthcoming (eighth) edition of the TNM classification for lung cancer. J Thorac Oncol. 2016;11(1):39‐51. - PubMed
    1. Pignon J‐P, Tribodet H, Scagliotti GV, et al. Lung adjuvant cisplatin evaluation: a pooled analysis by the LACE Collaborative Group. J Clin Oncol. 2008;26(21):3552‐3559. - PubMed
    1. Forde PM, Chaft JE, Smith KN, et al. Neoadjuvant PD‐1 blockade in resectable lung cancer. N Engl J Med. 2018. - PubMed

Publication types