. 2019 Apr 29:8:e46323.
doi: 10.7554/eLife.46323.

A consensus guide to capturing the ability to inhibit actions and impulsive behaviors in the stop-signal task

Affiliations

A consensus guide to capturing the ability to inhibit actions and impulsive behaviors in the stop-signal task

Frederick Verbruggen et al. Elife. .

Abstract

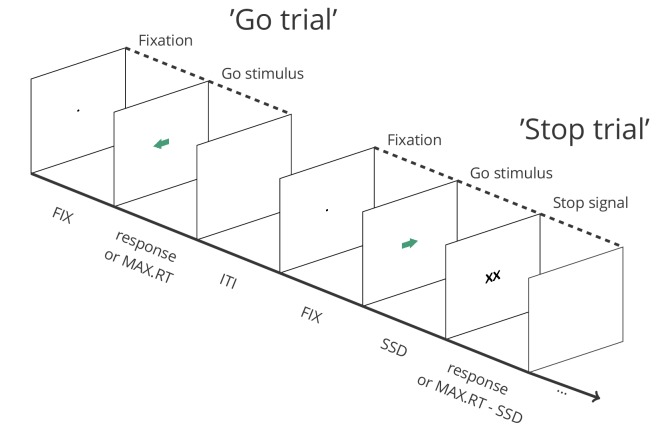
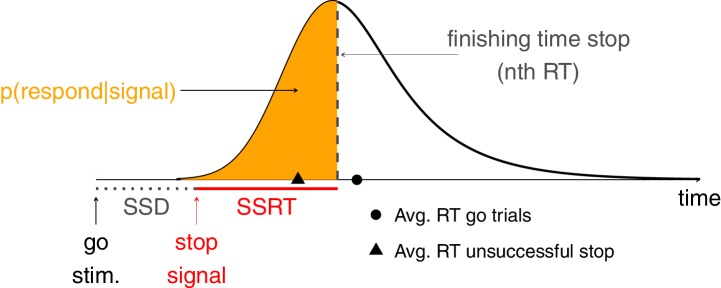
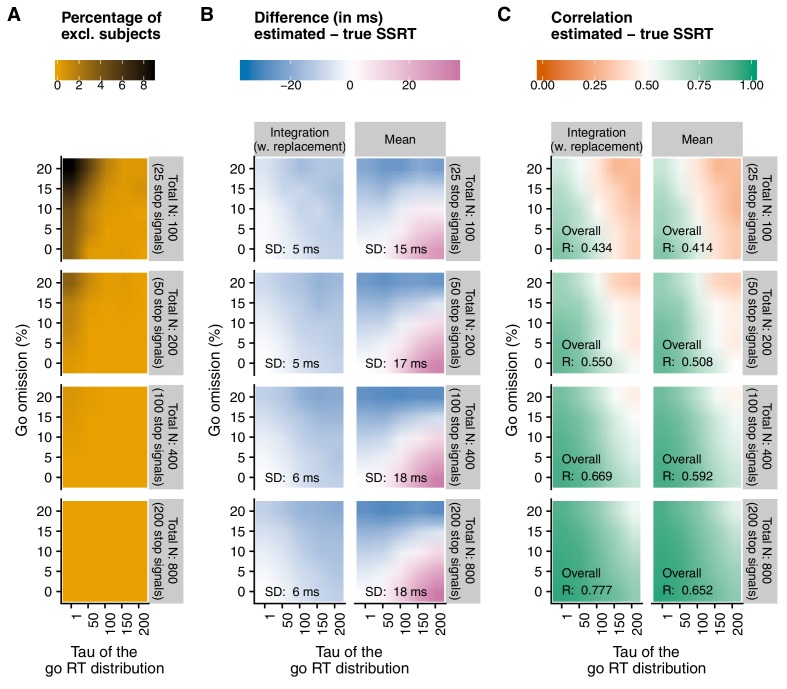
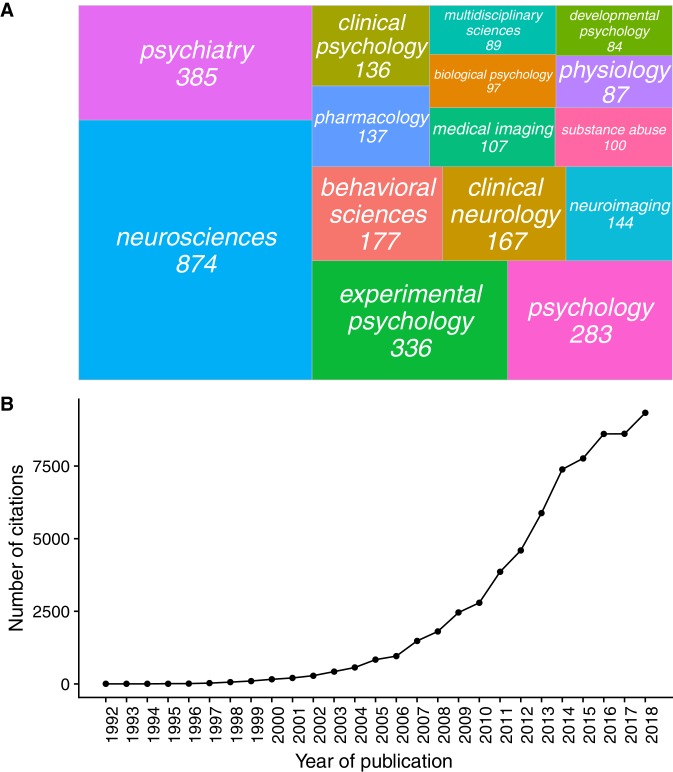
Response inhibition is essential for navigating everyday life. Its derailment is considered integral to numerous neurological and psychiatric disorders, and more generally, to a wide range of behavioral and health problems. Response-inhibition efficiency furthermore correlates with treatment outcome in some of these conditions. The stop-signal task is an essential tool to determine how quickly response inhibition is implemented. Despite its apparent simplicity, there are many features (ranging from task design to data analysis) that vary across studies in ways that can easily compromise the validity of the obtained results. Our goal is to facilitate a more accurate use of the stop-signal task. To this end, we provide 12 easy-to-implement consensus recommendations and point out the problems that can arise when they are not followed. Furthermore, we provide user-friendly open-source resources intended to inform statistical-power considerations, facilitate the correct implementation of the task, and assist in proper data analysis.

Keywords: countermanding; human; human biology; impulse control; impulsivity; medicine; mouse; neuroscience; race model; rat; response inhibition; rhesus macaque; stop-signal task.


Conflict of interest statement

FV, GB, PB, AB, JB, CC, HC, LC, BC, JC, AD, DE, HG, IG, AH, RH, SJ, JK, IL, CL, GL, DM, SM, AM, MP, RP, KR, MR, JS, AS, KT, Mv, LV, MV, JW, RW, BZ, CB No competing interests declared, AA, NS Reviewing editor, eLife, CB has received payment for consulting and speaker's honoraria from GlaxoSmithKline, Novartis, Genzyme, and Teva. He has recent research grants with Novartis and Genzyme, SC consults for Shire, Ieso Digital Health, Cambridge Cognition, and Promentis. Dr Chamberlain's research is funded by Wellcome Trust (110049/Z/15/Z), TR consults for Cambridge Cognition, Mundipharma and Unilever. He receives royalties from Cambridge Cognition (CANTAB) and has recent research grants with Shionogi and SmallPharma, KR has received speaker's honoraria and grants for other projects from Eli Lilly and Shire, RS has consulted to Highland Therapeutics, Eli Lilly and Co., and Purdue Pharma. He has commercial interest in a cognitive rehabilitation software company, eHave

Figures

Figure 1.
Figure 1.. Depiction of the sequence of events in a stop-signal task (see https://osf.io/rmqaw/ for open-source software to execute the task).
In this example, participants respond to the direction of green arrows (by pressing the corresponding arrow key) in the go task. On one fourth of the trials, the arrow is replaced by ‘XX’ after a variable stop-signal delay (FIX = fixation duration; SSD = stop signal delay; MAX.RT = maximum reaction time; ITI = intertrial interval).
Box 1—figure 1.
Box 1—figure 1.. The independent race between go and stop.
Figure 2.
Figure 2.. Main results of the simulations reported in Appendix 2.
Here, we show a comparison of the integration method (with replacement of go omissions) and the mean method, as a function of percentage of go omissions, skew of the RT distribution (τgo), and number of trials. Appendix 2 provides a full overview of all methods. (A) The number of excluded ‘participants’ (RT on unsuccessful stop trials > RT on go trials). As this check was performed before SSRTs were estimated (see Recommendation 7), the number was the same for both estimation methods. (B) The average difference between the estimated and true SSRT (positive values = overestimation; negative values = underestimation). SD = standard deviation of the difference scores (per panel). (C) Correlation between the estimated and true SSRT (higher values = more reliable estimate). Overall R = correlation when collapsed across percentage of go omissions and τgo. Please note that the overall correlation does not necessarily correspond to the average of individual correlations.
Appendix 1—figure 1.
Appendix 1—figure 1.. The number of stop-signal publications per research area (Panel A) and the number of articles citing the ‘stop-signal task’ per year (Panel B).
Source: Web of Science, 27/01/2019, search term: ‘topic = stop signal task’. The research areas in Panel A are also taken from Web of Science.
Appendix 2—figure 1.
Appendix 2—figure 1.. Examples of ex-Gaussian (RT) distributions used in our simulations.
For all distributions, μgo = 500 ms, and σgo = 50 ms. τgo was either 1, 50, 100, 150, and 200 (resulting in increasingly skewed distributions). Note that for a given RT cut-off (1,500 ms in the simulations), cut-off-related omissions are rare, but systematically more likely as tau increases. In addition to such ‘natural’ go omissions, we introduced ‘artificial’ ones in the different go-omission conditions of the simulations (not depicted).
Appendix 2—figure 2.
Appendix 2—figure 2.. Violin plots showing the distribution and density of the difference scores between estimated and true SSRT as a function of condition and estimation method when the total number of trials is 100 (25 stop trials).
Values smaller than zero indicate underestimation; values larger than zero indicate overestimation.
Appendix 2—figure 3.
Appendix 2—figure 3.. Violin plots showing the distribution and density of the difference scores between estimated and true SSRT as a function of condition and estimation method when the total number of trials is 200 (50 stop trials).
Values smaller than zero indicate underestimation; values larger than zero indicate overestimation.
Appendix 2—figure 4.
Appendix 2—figure 4.. Violin plots showing the distribution and density of the difference scores between estimated and true SSRT as a function of condition and estimation method when the total number of trials is 400 (100 stop trials).
Values smaller than zero indicate underestimation; values larger than zero indicate overestimation.
Appendix 2—figure 5.
Appendix 2—figure 5.. Violin plots showing the distribution and density of the difference scores between estimated and true SSRT as a function of condition and estimation method when the total number of trials is 800 (200 stop trials).
Values smaller than zero indicate underestimation; values larger than zero indicate overestimation.
Appendix 3—figure 1.
Appendix 3—figure 1.. Achieved power for an independent two-groups design as function of differences in go omission, go distribution, SSRT distribution, and the number of trials in the ‘experiments’.

References

    1. Aron AR. From reactive to proactive and selective control: developing a richer model for stopping inappropriate responses. Biological Psychiatry. 2011;69:e55–e68. doi: 10.1016/j.biopsych.2010.07.024. - DOI - PMC - PubMed
    1. Band GP, van der Molen MW, Logan GD. Horse-race model simulations of the stop-signal procedure. Acta Psychologica. 2003;112:105–142. doi: 10.1016/S0001-6918(02)00079-3. - DOI - PubMed
    1. Bari A, Robbins TW. Inhibition and impulsivity: behavioral and neural basis of response control. Progress in Neurobiology. 2013;108:44–79. doi: 10.1016/j.pneurobio.2013.06.005. - DOI - PubMed
    1. Bartholdy S, Dalton B, O'Daly OG, Campbell IC, Schmidt U. A systematic review of the relationship between eating, weight and inhibitory control using the stop signal task. Neuroscience & Biobehavioral Reviews. 2016;64:35–62. doi: 10.1016/j.neubiorev.2016.02.010. - DOI - PubMed
    1. Bissett PG, Logan GD. Selective stopping? maybe not. Journal of Experimental Psychology: General. 2014;143:455–472. doi: 10.1037/a0032122. - DOI - PMC - PubMed

Publication types