. 2019 Apr 29;15(4):e1007989.
doi: 10.1371/journal.pgen.1007989. eCollection 2019 Apr.

Genetics of adaptation in modern chicken

Affiliations

Genetics of adaptation in modern chicken

Saber Qanbari et al. PLoS Genet. .

Abstract

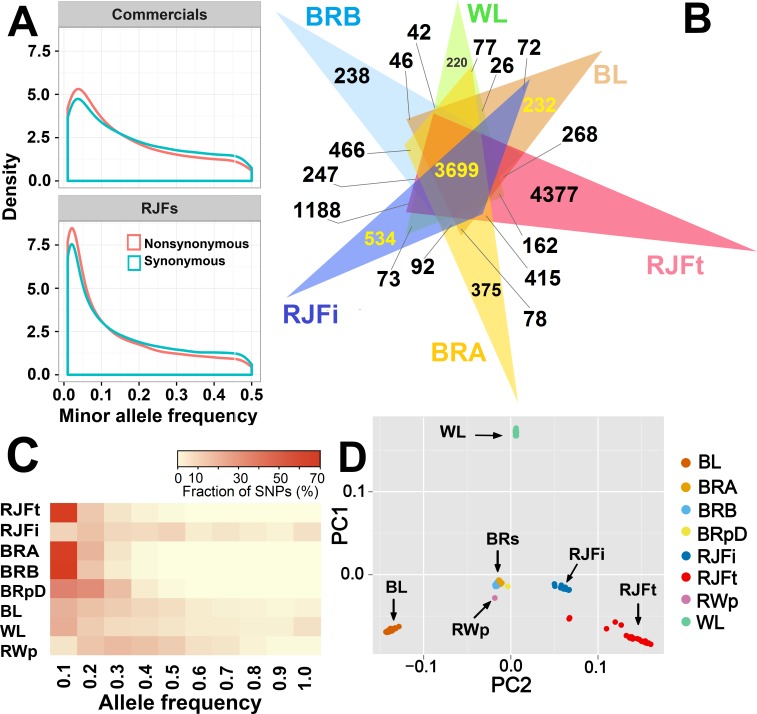
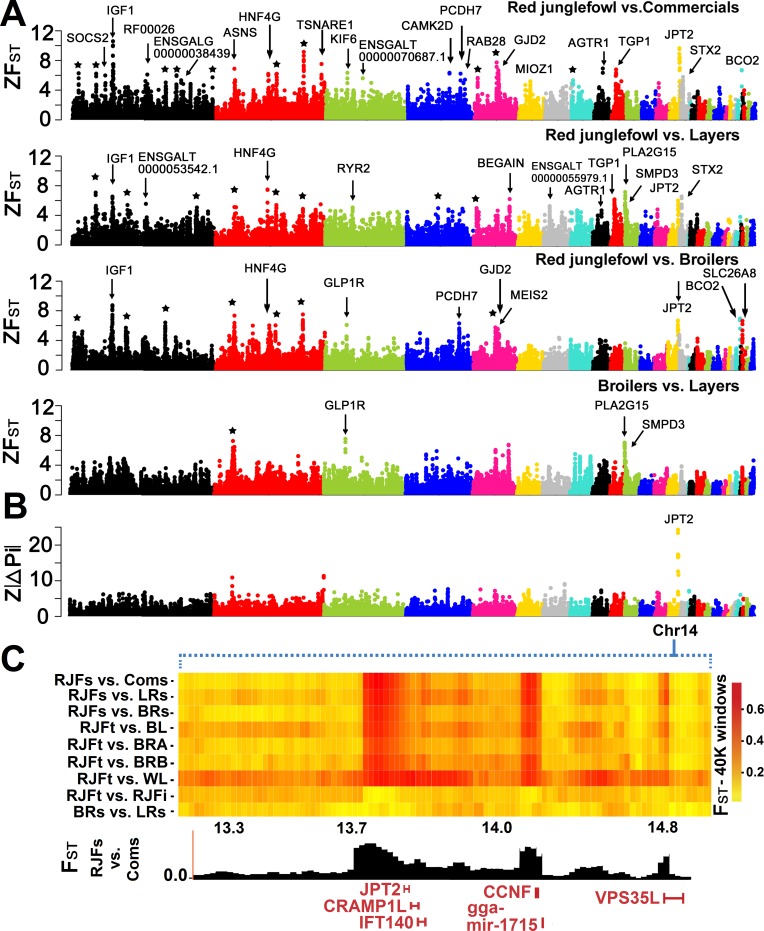
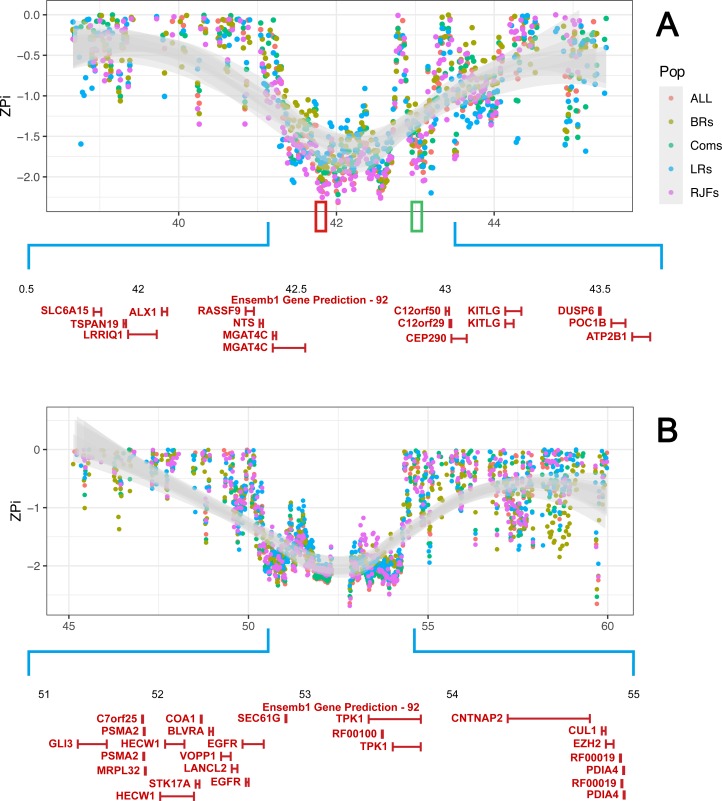
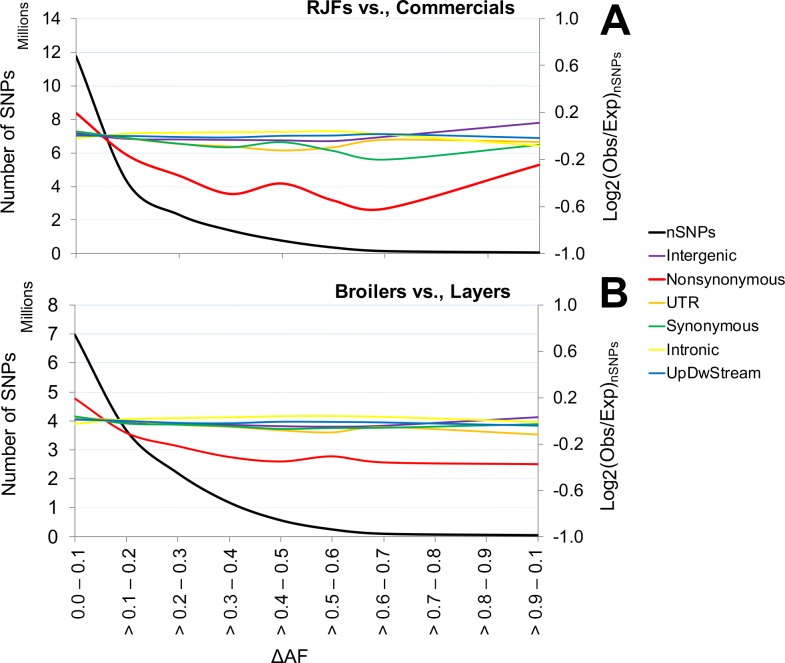
We carried out whole genome resequencing of 127 chicken including red jungle fowl and multiple populations of commercial broilers and layers to perform a systematic screening of adaptive changes in modern chicken (Gallus gallus domesticus). We uncovered >21 million high quality SNPs of which 34% are newly detected variants. This panel comprises >115,000 predicted amino-acid altering substitutions as well as 1,100 SNPs predicted to be stop-gain or -loss, several of which reach high frequencies. Signatures of selection were investigated both through analyses of fixation and differentiation to reveal selective sweeps that may have had prominent roles during domestication and breed development. Contrasting wild and domestic chicken we confirmed selection at the BCO2 and TSHR loci and identified 34 putative sweeps co-localized with ALX1, KITLG, EPGR, IGF1, DLK1, JPT2, CRAMP1, and GLI3, among others. Analysis of enrichment between groups of wild vs. commercials and broilers vs. layers revealed a further panel of candidate genes including CORIN, SKIV2L2 implicated in pigmentation and LEPR, MEGF10 and SPEF2, suggestive of production-oriented selection. SNPs with marked allele frequency differences between wild and domestic chicken showed a highly significant deficiency in the proportion of amino-acid altering mutations (P<2.5×10⁻⁶). The results contribute to the understanding of major genetic changes that took place during the evolution of modern chickens and in poultry breeding.


Conflict of interest statement

The authors have declared that no competing interests exist.

Figures

Fig 1
Fig 1. Analysis of SNP diversity.
(A) Comparison of the minor allele frequency spectrum of coding sequences in RJFt and commercial populations. (B) Visualization of the distribution of population-specific and group-specific variants detected from individual sequencing only. Each triangle represents the number (103) of variants exclusively segregating or detected in the corresponding population and overlapping sections denote group-specific variants. (C) Heatmap of the allele frequency distribution of population-specific variants. (D) Principal component analysis of chicken populations. Populations are coded as RJFt = red jungle fowl (Thailand), RJFi = red jungle fowl (India), BL = Brown layer, WL = White layer, RWp = Rhode-White pool, BRA = Broiler line A, BRB = Broiler line B and BRpD = Broiler line pool D, BRs = three commercial broiler lines (BRA, BRB and BRpD). show a substantially smaller proportion of rare alleles that can be attributed to the smaller effective population size caused by recent selective breeding leading to loss of rare alleles.
Fig 2
Fig 2. Genome-wide visualization of candidate selective sweeps.
Each dot represents a 40 kb window in steps of 20 kb along the genome. (A) ZFST scores in different contrasts of chicken populations. Candidate genes are indicated for each signal. Signals marked by a star represent regions lacking annotated genes. (B) Manhattan plot of the Z|ΔPi| scores between two RJF and four commercial populations. (C) High resolution illustration of putative sweeps on GGA14. The heatmap visualizes the region as FST values among multiple populations and groups, where the genes or known elements overlapping the candidate sweeps are indicated underneath.
Fig 3
Fig 3. A graphical illustration of regions with extremely low nucleotide diversity across populations on GGA1 and GGA2.
In panel A, two regions of high homozygosity are centered over ALX1 and KITLG on GGA1. Red and green rectangles, respectively display the chromosomal positions of ALX1 and KITLG. Panel B visualizes an extensive putative sweep on GGA2 overlapping the EGFR locus. Each dot represents a 40 kb window. The standard errors of ZPi-scores in each window across scans are smoothed over the region in grey. Nucleotide diversity was estimated for RJFs (two red jungle fowl populations), Coms (four commercial lines), BRs (the two commercial broiler lines, BRA and BRB), LRs (two layer populations, BL and WL) and ALL (all six populations of RJFs and commercials).
Fig 4
Fig 4. Analysis of enrichment for different categories of SNPs.
Panel A and B represent the contrasts ‘RJFs vs. Coms’ and ‘BRs vs. LRs’, respectively. UpDwStream stands for sites residing 5 kb up- and downstream of genes. The black line represents the total number of SNPs in each ΔAF bin and colored lines represent log2 fold changes of the observed SNP count for each category in each bin against the expected SNP count.

Comment in

  • No "doom" in chicken domestication?
    Bosse M. Bosse M. PLoS Genet. 2019 May 30;15(5):e1008089. doi: 10.1371/journal.pgen.1008089. eCollection 2019 May. PLoS Genet. 2019. PMID: 31145731 Free PMC article. No abstract available.

References

    1. Darwin C. The variation of animals and plants under domestication. London: John Murray. C; (1868)
    1. Eriksson J, Larson G, Gunnarsson U, Bed’hom B, Tixier-Boichard M, Strömstedt L, et al. Identification of the yellow skin gene reveals a hybrid origin of the domestic chicken. PLoS Genet. 2008;4: e1000010 10.1371/journal.pgen.1000010 - DOI - PMC - PubMed
    1. Brooke M. & Birkhead T. The Cambridge Encyclopedia of Ornithology. Cambridge University Press, Cambridge: 362pp (1991).
    1. FAOSTAT. FAOSTAT Database. Available online at: http://faostat.fao.org/site (2013).
    1. Most PJ van der, Jong B de, Parmentier HK, Verhulst S. Trade-off between growth and immune function: a meta-analysis of selection experiments. Func. Ecol. 2011;25: 74–80. 10.1111/j.1365-2435.2010.01800.x - DOI

Publication types