. 2019 Apr 29;15(4):e1007697.
doi: 10.1371/journal.ppat.1007697. eCollection 2019 Apr.

Host metabolites stimulate the bacterial proton motive force to enhance the activity of aminoglycoside antibiotics

Affiliations

Host metabolites stimulate the bacterial proton motive force to enhance the activity of aminoglycoside antibiotics

Aurélie Crabbé et al. PLoS Pathog. .

Abstract

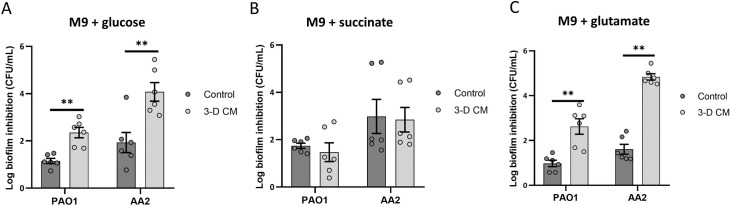
Antibiotic susceptibility of bacterial pathogens is typically evaluated using in vitro assays that do not consider the complex host microenvironment. This may help explaining a significant discrepancy between antibiotic efficacy in vitro and in vivo, with some antibiotics being effective in vitro but not in vivo or vice versa. Nevertheless, it is well-known that antibiotic susceptibility of bacteria is driven by environmental factors. Lung epithelial cells enhance the activity of aminoglycoside antibiotics against the opportunistic pathogen Pseudomonas aeruginosa, yet the mechanism behind is unknown. The present study addresses this gap and provides mechanistic understanding on how lung epithelial cells stimulate aminoglycoside activity. To investigate the influence of the local host microenvironment on antibiotic activity, an in vivo-like three-dimensional (3-D) lung epithelial cell model was used. We report that conditioned medium of 3-D lung cells, containing secreted but not cellular components, potentiated the bactericidal activity of aminoglycosides against P. aeruginosa, including resistant clinical isolates, and several other pathogens. In contrast, conditioned medium obtained from the same cell type, but grown as conventional (2-D) monolayers did not influence antibiotic efficacy. We found that 3-D lung cells secreted endogenous metabolites (including succinate and glutamate) that enhanced aminoglycoside activity, and provide evidence that bacterial pyruvate metabolism is linked to the observed potentiation of antimicrobial activity. Biochemical and phenotypic assays indicated that 3-D cell conditioned medium stimulated the proton motive force (PMF), resulting in increased bacterial intracellular pH. The latter stimulated antibiotic uptake, as determined using fluorescently labelled tobramycin in combination with flow cytometry analysis. Our findings reveal a cross-talk between host and bacterial metabolic pathways, that influence downstream activity of antibiotics. Understanding the underlying basis of the discrepancy between the activity of antibiotics in vitro and in vivo may lead to improved diagnostic approaches and pave the way towards novel means to stimulate antibiotic activity.


Conflict of interest statement

The authors have declared that no competing interests exist.

Figures

Fig 1
Fig 1. Antibiotic activity against P. aeruginosa PAO1 in conditioned medium derived from 3-D and 2-D lung epithelial cells.
Biofilm inhibition by different antibiotics was determined after 4h of incubation in the presence of (A) 3-D CM derived from 106 cells/mL, (B) 2-D CM derived from 106 cells/mL, and (C) 3-D CM derived from 4 x 10⁶ cells/mL. (D) Time-kill curve using different concentrations of tobramycin in the presence of 3-D CM (derived from 4 x 10⁶ cells/mL) or control medium. Control medium was GTSF-2. Col = colistin, Am = amikacin, Tb = tobramycin, Gm = gentamicin. * p < 0.05, ** p < 0.01, n ≥ 3. Error bars represent standard error of the mean.
Fig 2
Fig 2
Uptake of BODIPY-tobramycin by P. aeruginosa PAO1 (A, C) and DK2 (B, D) in 3-D CM versus control medium, determined using flow cytometry analysis. Tobramycin uptake was assessed based on the fraction of the population that fell into three respective gates: negative, intermediate and positive. Negative and positive gates were determined respectively using a negative control (untreated sample) and BODIPY-tobramycin concentrations that resulted in maximal fluorescence intensity (S2 Fig). Bacteria whose fluorescence was situated between the positive and negative gates represent the intermediate population. Biofilms were formed for 4h in the presence of 0.75 μg/mL BODIPY-tobramycin. Panels A and B are derived from the dot plot graphs of each replicate (left and middle image) in panels C and D, respectively (forward scatter signal in X-axis, fluorescence intensity in Y-axis). Panels C and D show one representative replicate. The right image of panels C and D present an overlay of the histograms from control and 3-D CM samples, showing the fluorescence intensity on the X-axis and the percentage of the analysed cell population in the Y-axis. Control medium was GTSF-2. ** p < 0.01, n ≥ 3. Error bars represent standard error of the mean.
Fig 3
Fig 3. Correlation of tobramycin uptake and biofilm inhibition using the tobramycin-potentiator succinate.
(A) Biofilm inhibition of P. aeruginosa PAO1 by 2 μg/mL tobramycin and uptake of BODIPY-tobramycin in control medium supplemented with a two-fold dilution series of succinate (0.11–3.36 mM). For BODIPY-tobramycin uptake, flow cytometry analysis was performed, the positive population is presented. Biofilms were formed for 4h. A threshold succinate concentration was observed (0.84 mM) above which both potentiation of biofilm inhibition and an increase in tobramycin uptake occurred (dotted line). This threshold was used for defining the groups in panels (B) and (C). Control medium was GTSF-2, suc = succinate. *p ≤ 0.05 ** p < 0.01, n ≥ 3. Error bars represent standard error of the mean.
Fig 4
Fig 4. Evaluating the role of the proton motive force on the potentiating effect of 3-D CM on P. aeruginosa PAO1.
(A) Biofilm inhibition by 2 μg/mL tobramycin in 3-D CM and control medium in the presence or absence of 100 μM of the proton motive force disruptor CCCP. (B) Intracellular pH of P. aeruginosa PAO1 in the presence of 3-D CM or control medium with or without tobramycin treatment (2 μg/mL, monitored every 20 s) (representative replicate). (C) Biofilm inhibition by 2 μg/mL tobramycin in 3-D CM and control medium in the presence or absence of the potassium ionophore nigericin (10 μM) and excess levels of potassium (150 mM). (D) Uptake of BODIPY-tobramycin (0.75 μg/mL) by P. aeruginosa PAO1 in control medium, and 3-D CM in the presence or absence of nigericin/excess K+. Panel D is derived from the dot plot graph in panel E (left) (representative replicate) and Fig 2 panel C (forward scatter signal in X-axis, fluorescence intensity in Y-axis). The right image of panel E presents an overlay of the histograms from control and 3-D CM + nigericin/excess K+ samples, showing the fluorescence intensity on the X-axis and the percentage of the analysed cell population in the Y-axis. (F) Biofilm inhibition by 2 μg/mL tobramycin in control medium with increased pH (7.7) and nigericin to equalize intra- and extracellular pH to higher pH. Tb = tobramycin. Control medium was GTSF-2. * p < 0.05, ** p < 0.01, n ≥ 3. Error bars represent standard error of the mean.
Fig 5
Fig 5
Biofilm inhibition (A) and BODIPY-tobramycin uptake (B) of efflux pump mutants P. aeruginosa ΔMexAB and ΔMexXY and isogenic wild type of P. aeruginosa PAO1 in the presence of 3-D CM or control medium. Biofilms were formed for 4h prior to sample processing, in the presence of a tobramycin concentration that resulted in at least 1 log biofilm inhibition (2 μg/mL for WT PAO1, 1 μg/mL for ΔMexXY and ΔMexAB). To determine the uptake of BODIPY-tobramycin using flow cytometry, a concentration of 0.75 μg/mL was used. Control medium was GTSF-2. Tb = tobramycin. * p < 0.05, ** p < 0.01, n ≥ 3. Error bars represent standard error of the mean.
Fig 6
Fig 6. Influence of 3-D CM on membrane potential and permeability of P. aeruginosa PAO1.
(A) DiBac4(3) assay. Samples were processed following 4h incubation in control medium or 3-D CM with antibiotic concentrations that caused membrane depolarization (4 μg/mL tobramycin, 8 μg/mL gentamicin). (B) Live/dead assay. The biofilm fraction was processed following 4h incubation in control medium or 3-D CM with or without 2 μg/mL tobramycin. Based on the level of SYTO9 and PI, three populations could be distinguished (live, intermediate, dead). Tb = tobramycin, Gm = gentamicin. ** p < 0.01, n ≥ 3. Error bars represent standard error of the mean.
Fig 7
Fig 7
Role of host-produced metabolites in the potentiating effect of 3-D CM (A) Biofilm inhibition by 2 μg/mL tobramycin, triphenylbismuth dichloride and their combination. (B) Biofilm inhibition by 2 μg/mL tobramycin in control medium and 3-D CM filtered using a 3 kDa filter. Control medium was GTSF-2. ** p < 0.01, n ≥ 3. Error bars represent standard error of the mean.
Fig 8
Fig 8
Quantification of pyruvate (A), succinate (B) and glutamate (C) in conditioned media of A549 lung epithelial cells (2-D CM derived from 1 x 10⁶ cells/mL, 3-D CM derived from 1 x 10⁶ cells/mL or 4 x 10⁶ cells/mL). Control medium was GTSF-2. ** p < 0.01, n ≥ 3. Error bars represent standard error of the mean.
Fig 9
Fig 9
Influence of metabolites produced by 3-D lung epithelial cells on biofilm inhibition by tobramycin (A) and tobramycin uptake (B) by P. aeruginosa PAO1. Biofilm inhibition by tobramycin (2μg/mL) was tested in the absence or presence of glutamate (10.88 mM), succinate (1.81 mM) or their combination. Concentrations are determined based on quantification of these metabolites in 3-D CM derived from 4 x 10⁶ cells/mL. To determine the uptake of BODIPY-tobramycin using flow cytometry, a concentration of 0.75 μg/mL was used. Tb = tobramycin, glut = glutamate, suc = succinate. * p < 0.05, ** p < 0.01, n ≥ 3. Error bars represent standard error of the mean.
Fig 10
Fig 10
Biofilm inhibition of P. aeruginosa PAO1 or AA2 by tobramycin in the presence of 3-D CM or control medium after overnight culturing in M9 minimal medium supplemented with (A) glucose (10 mM), (B) succinate (15 mM), (C) glutamate (12 mM). For P. aeruginosa PAO1 and AA2, 2 μg/mL and 8 μg/mL tobramycin was used, respectively. Tb = tobramycin. ** p < 0.01, n ≥ 3. Error bars represent standard error of the mean.

Similar articles

Cited by

References

    1. Peng B, Su YB, Li H, Han Y, Guo C, Tian YM, et al. (2015) Exogenous alanine and/or glucose plus kanamycin kills antibiotic-resistant bacteria. Cell Metab 21: 249–262. 10.1016/j.cmet.2015.01.008 - DOI - PubMed
    1. Allison KR, Brynildsen MP, Collins JJ (2011) Metabolite-enabled eradication of bacterial persisters by aminoglycosides. Nature 473: 216–220. 10.1038/nature10069 - DOI - PMC - PubMed
    1. Yang JH, Bening SC, Collins JJ (2017) Antibiotic efficacy-context matters. Curr Opin Microbiol 39: 73–80. 10.1016/j.mib.2017.09.002 - DOI - PMC - PubMed
    1. Yang JH, Bhargava P, McCloskey D, Mao N, Palsson BO, Collins JJ (2017) Antibiotic-Induced Changes to the Host Metabolic Environment Inhibit Drug Efficacy and Alter Immune Function. Cell Host Microbe 22: 757–765 e753. 10.1016/j.chom.2017.10.020 - DOI - PMC - PubMed
    1. Farha MA, French S, Stokes JM, Brown ED (2018) Bicarbonate Alters Bacterial Susceptibility to Antibiotics by Targeting the Proton Motive Force. ACS Infect Dis 4: 382–390. 10.1021/acsinfecdis.7b00194 - DOI - PubMed

Publication types

MeSH terms

LinkOut - more resources