. 2019 Apr 29;14(4):e0210454.
doi: 10.1371/journal.pone.0210454. eCollection 2019.

miRNAs, target genes expression and morphological analysis on the heart in gestational protein-restricted offspring

Affiliations

miRNAs, target genes expression and morphological analysis on the heart in gestational protein-restricted offspring

Heloisa Balan Assalin et al. PLoS One. .

Abstract

Gestational protein restriction was associated with low birth weight, hypertension and higher prevalence of cardiac disorders in adults. Several mechanisms, including epigenetics, could be related with the cardiovascular phenotype on protein-restricted offspring. Thus, we investigated the morphological cardiac effects of gestational protein restriction and left ventricle miRNAs and target genes expression pattern in both 12-day and 16-week old gestational protein-restricted male offspring. Pregnant Wistar rats were allocated into two groups, according to protein supply during pregnancy: NP (normal protein diet- 17%) or LP (low protein diet-6%). Dams on the gestational protein-restricted diet had lower body weight gain and higher food intake. Gestational protein-restricted offspring had low birth weight, followed by rapidly body weight recovery, hypertension, and increased myocytes cross-sectional area and collagen fraction at 16-week old age. At 12-days old, miR-184, miR-192, miR-376c, miR-380-3p, miR-380-5p, miR-451, and miR-582-3p had increased expression, and miR-547 and miR-743a had decreased expression in the gestational protein-restricted left ventricle. At 16-week old, let-7b, miR-125a-3p, miR-142-3p, miR-182 and miR-188-5p had increased expression and let-7g, miR-107, miR-127, miR-181a, miR-181c, miR-184, miR-324-5p, miR-383, miR-423-5p and miR-484 had decreased expression in gestational protein-restricted left ventricle. Target predicted gene expression analysis showed higher expression of Dnmt3a, Oxct1, Rictor and Trps1 and lower expression of Bbs1 and Calml3 in 12-day old protein-restricted offspring. 16-week old protein-restricted offspring had higher expression of Adrbk1, Bbs1, Dnmt3a, Gpr22, Inppl1, and Oxct1 genes. In conclusion, gestational protein restriction was related to offspring low birth weight, increased systolic blood pressure and morphological heart alterations that could be related to early heart miRNA expression changes that perpetuate into adulthood and which are associated with the regulation of essential genes involved in cardiovascular development, heart morphology, function, and metabolism.


Conflict of interest statement

The authors have declared that no competing interests exist.

Figures

Fig 1
Fig 1. Body weight, food and protein intake of pregnant dams during gestation.
(A) Weekly body weight; pinteraction<0.001; pdiet = 0.007; ptime<0.001. (B) Weekly food intake; pinteraction = 0.018; pdiet<0.001; ptime = 0.118. (C) Weekly protein intake; pinteraction = 0.018; pdiet<0.001; ptime = 0.069. Data were expressed as the mean ± SD. NP (n = 21): normal protein diet group; LP (n = 31): low protein diet group. *Significant difference between week-matched NP x LP groups (p≤0.05).
Fig 2
Fig 2. Male offspring birth weight, anogenital distance and male offspring 12 days old body weight.
(A) Male offspring birth weight; p<0.001. (B) Male offspring anogenital distance; p = 0.018. (C) 12-days male offspring body weight; p = 0.126. Data were expressed as the median [lower quartile—upper quartile]. NP: normal protein diet group; LP: low protein diet group. *Significant difference between NP x LP groups (p≤0.05).
Fig 3
Fig 3. Body weight, food and systolic blood pressure of the 16-week old groups.
(A) Weekly body weight. pinteraction = 0.223; pdiet = 0.173; ptime<0.001. (B) Weekly food intake. pinteraction = 0.275; pdiet<0.001; ptime<0.001. (C) Systolic blood pressure. pinteraction<0.001; pdiet<0.001; ptime<0.001. Data were expressed as the mean ± SD. NP-16w (n = 9): normal protein diet group followed until 16 weeks old; LP-16w (n = 18): low protein diet group followed until 16 weeks old. *Significant difference between week-matched NP-16w x LP-16w groups (p ≤ 0.05).
Fig 4
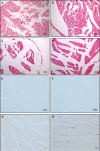
Fig 4. Histological representative images of 12 days and 16 weeks old animals.
Representative myocyte cross-sectional area in (A) NP-12d; (B) LP-12d; (C) NP-16w; (D) LP-16w; Representative interstitial collagen fraction in (E) NP-12d; (F) LP-12d; (G) NP-16w; (H) LP-16w.
Fig 5
Fig 5. Differentially expressed miRNA of 12 days and 16 weeks old animals.
(A) Fold-change and miRNA expression values in LP-12d (n = 4) versus NP-12d (n = 4); (B) Fold-change and miRNA expression values in LP-16w (n = 4) versus NP-16w (n = 4). *Significant difference between week-matched groups (p ≤ 0.05).
Fig 6
Fig 6. Targets mRNA expression of 12 days and 16 weeks old animals.
(A) Fold-change of mRNA expression in LP-12d (n = 8) versus NP-12d (n = 8); (B) Fold-change of mRNA expression in LP-16w (n = 8) versus NP-16w (n = 8). *Significant difference between week-matched groups (p ≤ 0.05).
Fig 7
Fig 7. Western blot analysis of BBS1, Calml3, Dnmt3a, Oxct1 and Rictor of 12 days and 16 weeks old animals.
(A) BBS1 in LP-12d (n = 12) versus NP-12d (n = 12) and LP-16w (n = 12) versus NP-16w (n = 9); (B) Calml3 in LP-12d (n = 11) versus NP-12d (n = 8) and LP-16w (n = 11) versus NP-16w (n = 8); (C) Dnmt3a in LP-12d (n = 7) versus NP-12d (n = 5) and LP-16w (n = 7) versus NP-16w (n = 5); (D) Oxct1 in LP-12d (n = 13) versus NP-12d (n = 9) and LP-16w (n = 15) versus NP-16w (n = 11); (E) Rictor in LP-12d (n = 9) versus NP-12d (n = 10) and LP-16w (n = 6) versus NP-16w (n = 5). Data were expressed as the mean ± SD *Significant difference between week-matched groups (p ≤ 0.05).

Similar articles

Cited by

References

    1. Barker DJP, Osmond C, Winter PD, Margetts B, Simmonds SJ. Weight in infancy and death from ischaemic heart disease. Lancet. 1989; 2:577–580. 10.1016/S0140-6736(89)90710-1 - DOI - PubMed
    1. Roseboom TJ, van der Meulen JHP, Osmond C, Barker DJ, Ravelli AC, Schroeder-Tanka JM, et al. Coronary heart disease in adults after prenatal exposure to the Dutch famine. Heart. 2000; 84:595–598. 10.1136/heart.84.6.595 - DOI - PMC - PubMed
    1. Lee RC, Feinbaum RL., Ambros V. The C. elegans heterochronic gene lin-4 encodes small RNAs with antisense complementarity to lin-14. Cell. 1993; 75:843–854. 10.1016/0092-8674(93)90529-Y - DOI - PubMed
    1. Briffa JF, McAinch AJ, Romano T, Wlodek ME, Hryciw DH. Leptin in pregnancy and development: a contributor to adulthood disease? Am J Physiol Endocrinol Metab. 2015; 308: E335–E350. 10.1152/ajpendo.00312.2014 - DOI - PubMed
    1. Livak KJ, Schmittgen TD. Analysis of relative gene expression data using real-time quantitative PCR and the 2ΔΔC(T). Methods. 2001; 25:402–408. 10.1006/meth.2001.1262 - DOI - PubMed

Publication types

MeSH terms