. 2019 Aug 7;70(15):3895-3909.
doi: 10.1093/jxb/erz198.

OsMADS18, a membrane-bound MADS-box transcription factor, modulates plant architecture and the abscisic acid response in rice

Affiliations

OsMADS18, a membrane-bound MADS-box transcription factor, modulates plant architecture and the abscisic acid response in rice

Xiaoming Yin et al. J Exp Bot. .

Abstract

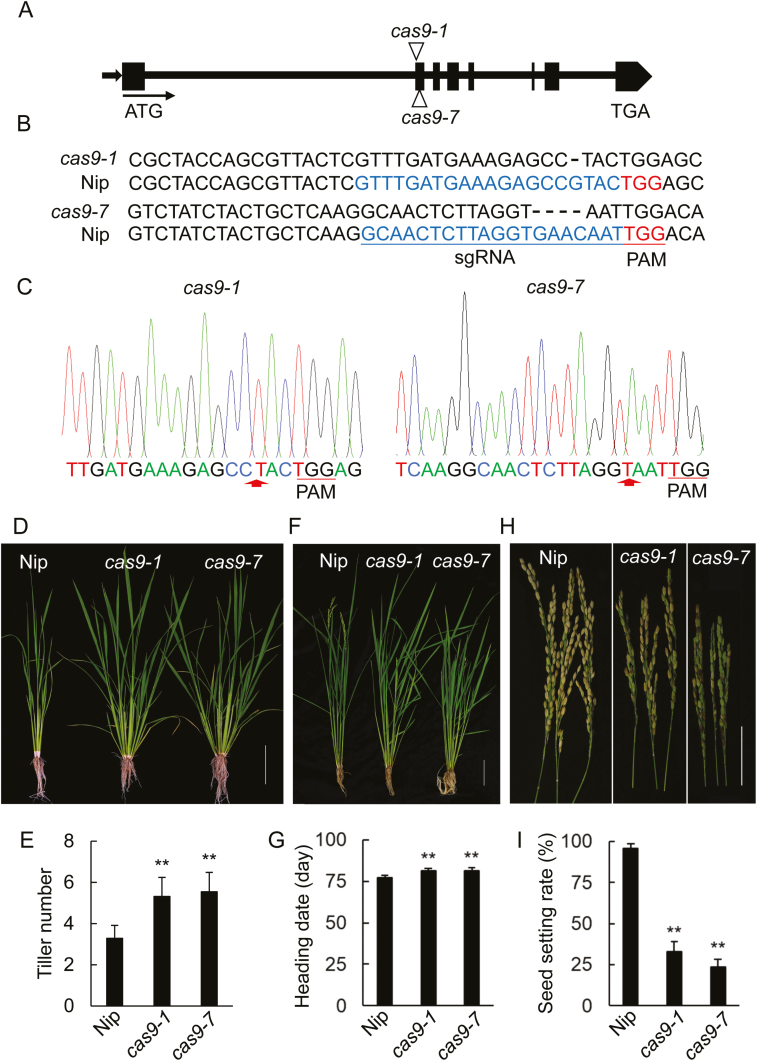
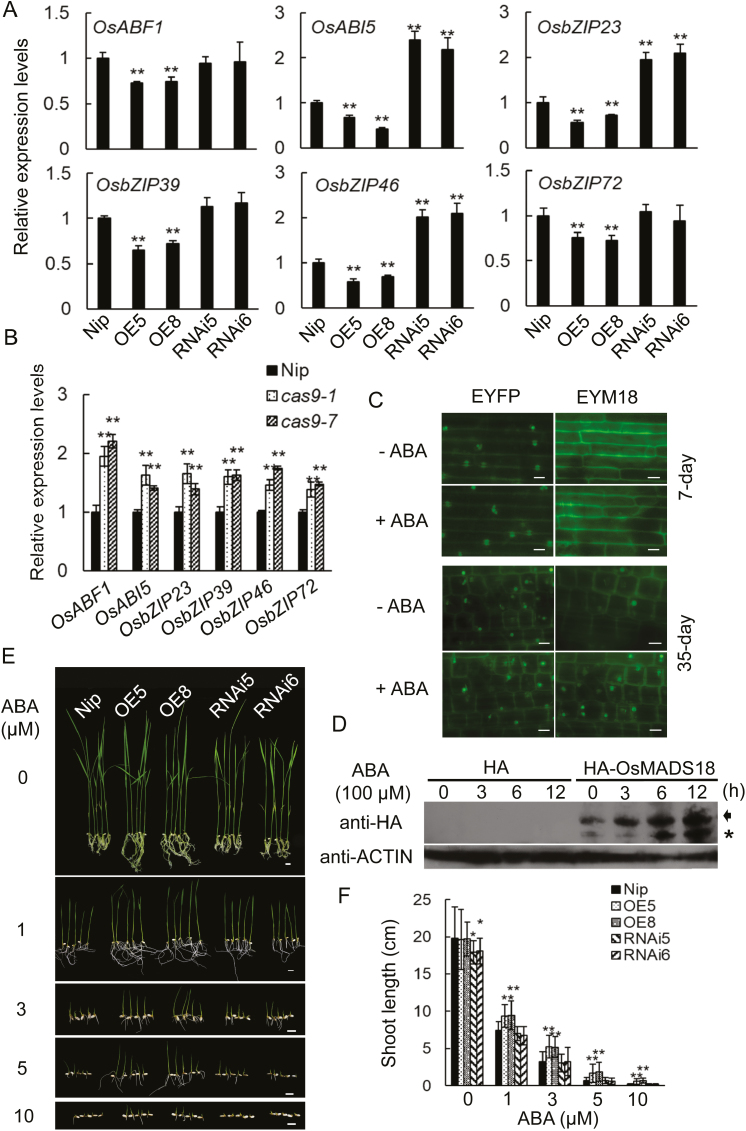
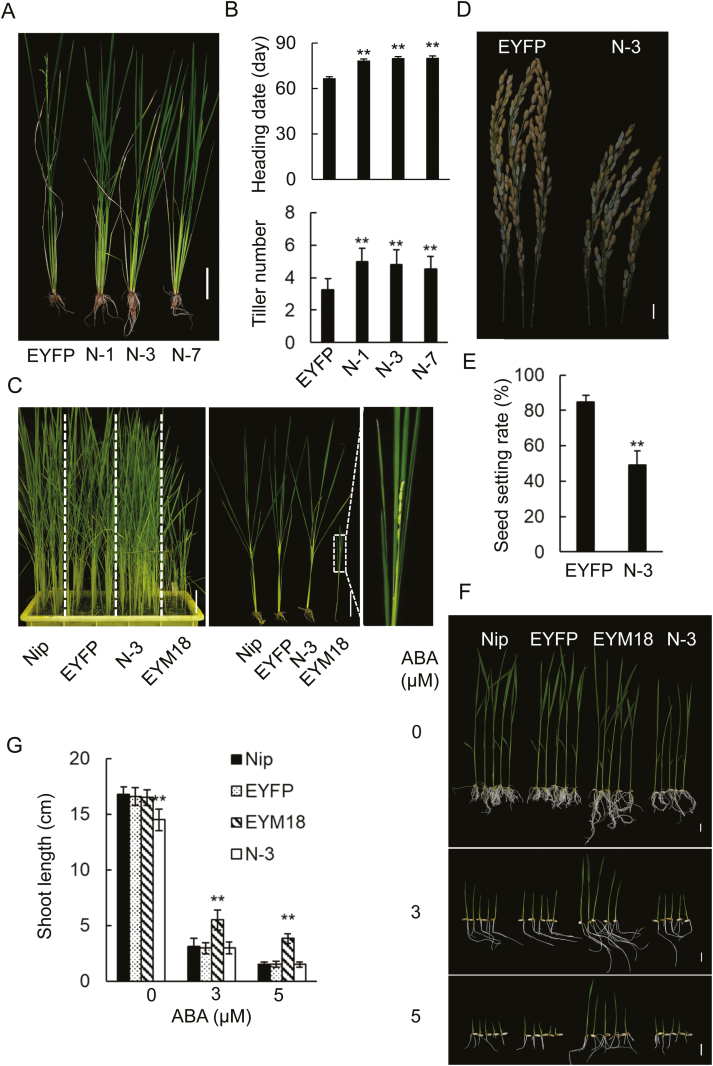
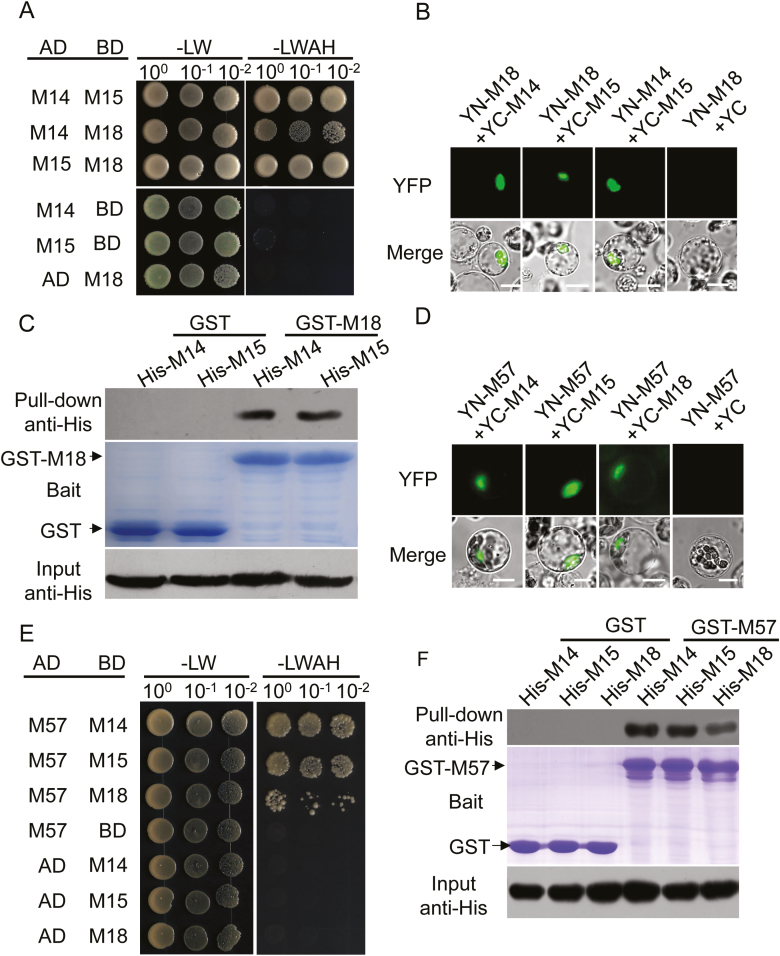
The APETALA1 (AP1)/FRUITFULL (FUL)-like transcription factor OsMADS18 plays diverse functions in rice development, but the underlying molecular mechanisms are far from fully understood. Here, we report that down-regulation of OsMADS18 expression in RNAi lines caused a delay in seed germination and young seedling growth, whereas the overexpression of OsMADS18 produced plants with fewer tillers. In targeted OsMADS18 genome-edited mutants (osmads18-cas9), an increased number of tillers, altered panicle size, and reduced seed setting were observed. The EYFP-OsMADS18 (full-length) protein was localized to the nucleus and plasma membrane but the EYFP-OsMADS18-N (N-terminus) protein mainly localized to the nucleus. The expression of OsMADS18 could be stimulated by abscisic acid (ABA), and ABA stimulation triggered the cleavage of HA-OsMADS18 and the translocation of OsMADS18 from the plasma membrane to the nucleus. The inhibitory effect of ABA on seedling growth was less effective in the OsMADS18-overexpressing plants. The expression of a set of ABA-responsive genes was significantly reduced in the overexpressing plants. The phenotypes of transgenic plants expressing EYFP-OsMADS18-N resembled those observed in the osmads18-cas9 mutants. Analysis of the interaction of OsMADS18 with OsMADS14, OsMADS15, and OsMADS57 strongly suggests an essential role for OsMADS18 in rice development.

Keywords: ABA; MADS-box; membrane-bound transcription factor; plant architecture; rice; tiller.


Figures

Fig. 1.
Fig. 1.
OsMADS18 modulates seed germination and tiller development. (A) Delayed seed germination in the RNAi lines. Seeds were sown on MS plates. Photographs were taken on the second day of germination. Scale bar=5 mm. (B) Germination percentage. Data represent the mean ±SD of three independent experiments (n>40 for each experiment). (C) Inhibition of auxiliary tiller growth observed in 45-day-old OE greenhouse-grown plants. Scale bar=1 cm. (D) The OE plants showed an earlier flowering phenotype. All plants were grown in natural conditions for 72 days. Scale bar=10 cm. (E) Tiller numbers in 72-day-old plants. Data represent the mean ±SD of three independent experiments (n>20 for each experiment). **P<0.01 (Student’s t-test). (F) Relative expression levels of a set of genes. RNAs were extracted from the blades of 45-day-old plants. OsACTIN1 expression was used as an internal control. The gene expression level in Nip was assigned a value of 1. Data represent the mean ±SD of three replicates. *P<0.05, **P<0.01 (Student’s t-test). (G) Endogenous IAA content (ng g–1 fresh weight) in the leaves of 45-day-old Nip and OE8 plants. Data represent the mean ±SD of three replicates. **P<0.01 (Student’s t-test).
Fig. 2.
Fig. 2.
Characterization of targeted OsMADS18 genome-edited mutants. (A) Schematic diagram (not to scale) of the CRISPR/Cas9 targeted sites in two mutant alleles, named cas9-1 and cas9-7. Arrows indicate the transcription orientation of OsMADS18. (B) Targeted and edited DNA sequences in OsMADS18. The dashed line indicates the deletion in the DNA sequences. sgRNA, single guide RNA; PAM, protospacer adjacent motif. (C) Sequences of genomic DNA fragments amplified from the cas9-1 and cas9-7 plants . Arrows indicate the deletion sites of the DNA base pairs. (D) 55-day-old cas9-1 and cas9-7 plants had more tillers than Nip plants of the same age. Plants were grown in natural conditions. Scale bar=10 cm. (E) Tiller numbers for Nip and the cas9 lines. Data represent the mean ±SD of three independent experiments (n>20 for each experiment). **P<0.01 (Student’s t-test). (F) 80-day-old cas9-1 and cas9-7 plants showed a delayed flowering phenotype. Plants were grown in natural conditions. Scale bar=5 cm. (G) Heading date for Nip and the cas9 lines. Data represent the mean ±SD of three independent experiments (n>20 for each experiment). **P<0.01 (Student’s t-test). (H) The cas9-1 and cas9-7 plants had smaller panicles and fewer seeds. Scale bar=5 cm. (I) Seed setting rate in Nip and the cas9 lines. Data represent the mean ±SD of three independent experiments (n>20 for each experiment). **P<0.01 (Student’s t-test).
Fig. 3.
Fig. 3.
OsMADS18 has nucleus-localization and plasma membrane-localization traits. (A) Co-localization of EYFP-OsMADS18 and CFP-OsPRA2 at the plasma membrane in protoplasts isolated from 7-day-old Nip seedlings. Scale bar=10 μm. (B) Co-localization of EYFP-OsMADS18 and Dil (a marker for the plasma membrane) at the plasma membrane in sheath cells of 7-day-old seedlings of the EYFP-OsMADS18 transgenic line. Scale bar=10 μm. (C) Co-localization of EYFP-OsMADS18 and CFP-DLT (a marker for the nucleus) in protoplasts isolated from 35-day-old Nip seedlings. Scale bar=10 μm. (D) Co-localization of EYFP-OsMADS18 and DAPI (a marker for the nucleus) in the sheath cells of 35-day-old seedlings of the EYFP-OsMADS18 transgenic line. Scale bar=10 μm. (E) Schematic diagram (not to scale) of the structure of full-length OsMADS18, OsMADS18-N, and OsMADS18-C proteins. (F) Nuclear localization of OsMADS18-N (EYM18-N) in protoplasts isolated from 7-day-old Nip seedlings. Scale bar=10 μm. (G) Detection of OsMADS18-C (EYM18-C) in protoplasts isolated from 7-day-old Nip seedlings. EYFP, Empty vector. Scale bar=10 μm. (H) Intensity of fluorescence (shown as a two-dimensional histogram projection) of EYFP-OsMADS18 (EYM18), EYFP-OsMADS18-N (EYM18-N), and EYFP-OsMADS18-C (EYM18-C) in protoplasts isolated from 7-day-old Nip seedlings. (I) Expression level of OsMADS18-N in 15-day-old seedlings of transgenic lines harboring pCAMBIA1300-EYFP (empty vector EYFP) or pCAMBIA1300-EYFP-OsMADS18-N (N-1, N-3, N-7). OsACTIN1 expression was used as an internal control. The expression level of OsMADS18 was analyzed relative to the level of gene expression in plants carrying the empty vector EYFP, which was assigned a value of 1. (J) Cellular localization of OsMADS18 and OsMADS18-N in the sheath cells of 7-day-old (left panel) and 60-day-old (right panel) transgenic plants. Scale bar=10 μm.
Fig. 4.
Fig. 4.
OsMADS18 responds to ABA. (A) Expression levels of a set of ABA-responsive genes in Nip, OE, and RNAi plants. RNAs were extracted from the blades of 45-day-old plants. OsACTIN1 expression was used as an internal control. The expression level was analyzed relative to the level of gene expression in Nip, which was assigned a value of 1. Data represent the mean ±SD of three replicates. **P<0.01 (Student’s t-test). (B) Expressions level of a set of ABA responsive genes in Nip and cas9 plants. RNAs were extracted from the blades of 45-day-old plants. OsACTIN1 expression was used as an internal control. The expression level was analyzed relative to the level of gene expression in Nip, which was assigned a value of 1. Data represent the mean ±SD of three replicates. *P<0.05, **P<0.01 (Student’s t-test). (C) EYFP-OsMADS18 (EYM18) was mostly detected in the plasma membrane of the sheath cells of 7-day-old EYFP-OsMADS18 plants treated with 100 μM ABA for 6 h (upper panel), but in the nuclei of sheath cells of 35-day-old EYFP-OsMADS18 plants treated with 100 μM ABA for 6 h (lower panel). EYFP represents the control transgenic line carrying the empty vector. Scale bar=10 μm. (D) ABA triggers the accumulation and cleavage of OsMADS18 protein in 35-day-old HA-OsMADS18 transgenic plants. The control transgenic line carries the empty vector (HA). Blades from 35-day-old plants were subjected to treatment with 100 μM ABA treatment for the indicated time periods. The arrow indicates the precursor form of HA-OsMADS18 and the asterisk indicates the cleaved form. ACTIN was used as a loading control. Anti-HA antibody was used to detect HA-OsMADS18. (E) Shoot growth in OE lines was less affected by ABA than in Nip and RNAi lines. Seeds were sown on MS plates and after 24 h were transferred to the MS plates containing different concentrations of ABA as indicated. Photographs were taken on day 9 after transfer. Scale bar=0.5 cm. (F) Shoot length quantified at day 9 after transfer. Data represent the mean ±SD of three independent experiments (n>20 for each experiment). *P<0.05, **P<0.01 (Student’s t-test).
Fig. 5.
Fig. 5.
Altered growth phenotypes in transgenic plants expressing EYFP-OsMADS18-N. (A) Compared to EYFP (empty vector) plants, plants (N-1, N-3, N-7) expressing EYFP-OsMADS18-N had an increased tiller number and delayed flowering time. Plants shown are 67 days old and were grown in a greenhouse. Scale bar=10 cm. (B) Heading date and tiller number in plants (N-1, N-3, N-7) expressing EYFP-OsMADS18-N or empty vector EYFP. Data represent the mean ±SD of three independent experiments (n>20 for each experiment). **P<0.01 (Student’s t-test). (C) Growth phenotypes of Nip, EYFP, N-3, and EYM18 (EYFP-OsMADS18) plants. All plants were 45 days old and were grown in a greenhouse. The enlarged image shows the early flowering in EYM18. Scale bar=10 cm. (D) N-3 plants had smaller panicles and fewer seeds than EYFP plants. Scale bar=5 cm. (E) Seed setting rate in N-3 and EYFP plants. Data represent the mean ±SD of three independent experiments (n>20 for each experiment). **P<0.01 (Student’s t-test). (F) The growth of N-3 plants was inhibited by ABA in a manner similar to that of Nip. Seeds were germinated on MS plates for 24 h and then transferred to MS plates with ABA (0, 3, 5 μM). Photographs were taken on day 9 after transfer. Scale bar=1 cm. (G) Shoot length measured on day 9 after transfer. Data represent the mean ±SD of three independent experiments (n>25 for each experiment). **P<0.01 (Student’s t-test).
Fig. 6.
Fig. 6.
OsMADS18 interacts with OsMADS14, OsMADS15, and OsMADS57. (A) The interaction between OsMADS18 (M18) and OsMADS14 (M14) or OsMADS15 (M15) was analyzed in a Y2H assay. Controls: AD (pGADT7) and BD (pGBKT7); -LW, low-stringency medium (SD/Leu-/Trp-); -LWAH, high-stringency selective medium (SD/Leu-/Trp-/Ade-/His-). (B) The interaction between OsMADS18 (YN-M18) and OsMADS14 (YC-M14) or OsMADS15 (YC-M15) was detected in the nucleus of protoplasts isolated from 35-day-old Nip seedlings in a BiFC assay. YC, C-terminal EYFP fragment, YN, N-terminal EYFP fragment. Scale bar=10 μm. (C) The interaction between OsMADS18 and OsMADS14 or OsMADS15 was confirmed in a pull-down assay. The separated GST-OsMADS18 (GST-M18) and GST proteins (bait) in 12% SDS-PAGE gel were visualized with Coomassie staining. The empty vector GST was used as the control. His-OsMADS14 (His-M14) and His-OsMADS15 (His-M15) were immunoblotted with anti-His antibody (Input). (D) The interaction between OsMADS57 (YN-M57) and OsMADS14 (YC-M14), OsMADS15 (YC-M15), or OsMADS18 (YC-M18) was detected in the nucleus of protoplasts isolated from 35-day-old Nip seedlings in a BiFC assay. Scale bar=10 μm. (E) The interaction between OsMADS57 (M57) and OsMADS14 (M14), OsMADS15 (M15), or OsMADS18 (M18) was also analyzed in a Y2H assay. Controls: AD (pGADT7) and BD (pGBKT7); -LW, low-stringency medium (SD/Leu-/Trp-); -LWAH, high-stringency selective medium (SD/Leu-/Trp-/Ade-/His-). (F) The interaction of OsMADS57 with OsMADS14, OsMADS15, or OsMADS18 was confirmed in a pull-down assay. The separated GST-OsMADS57 (GST-M57) and GST proteins (bait) in 12% SDS-PAGE gel were visualized with Coomassie staining. The empty vector GST was used as the control. His-OsMADS14 (His-M14), His-OsMADS15 (His-M15), and His-OsMADS18 (His-M18) were immunoblotted with anti-His antibody (Input).

References

    1. Agusti J, Herold S, Schwarz M, et al. . 2011. Strigolactone signaling is required for auxin-dependent stimulation of secondary growth in plants. Proceedings of the National Academy of Sciences, USA 108, 20242–20247. - PMC - PubMed
    1. Amir Hossain M, Lee Y, Cho JI, Ahn CH, Lee SK, Jeon JS, Kang H, Lee CH, An G, Park PB. 2010. The bZIP transcription factor OsABF1 is an ABA responsive element binding factor that enhances abiotic stress signaling in rice. Plant Molecular Biology 72, 557–566. - PubMed
    1. Arite T, Umehara M, Ishikawa S, Hanada A, Maekawa M, Yamaguchi S, Kyozuka J. 2009. d14, a strigolactone-insensitive mutant of rice, shows an accelerated outgrowth of tillers. Plant & Cell Physiology 50, 1416–1424. - PubMed
    1. Arora R, Agarwal P, Ray S, Singh AK, Singh VP, Tyagi AK, Kapoor S. 2007. MADS-box gene family in rice: genome-wide identification, organization and expression profiling during reproductive development and stress. BMC Genomics 8, 242. - PMC - PubMed
    1. Bai AN, Lu XD, Li DQ, Liu JX, Liu CM. 2016. NF-YB1-regulated expression of sucrose transporters in aleurone facilitates sugar loading to rice endosperm. Cell Research 26, 384–388. - PMC - PubMed

Publication types

MeSH terms