. 2019 Apr 28;20(9):2091.
doi: 10.3390/ijms20092091.

Adaptive Changes of Glioblastoma Cells Following Exposure to Hypoxic (1% Oxygen) Tumour Microenvironment

Affiliations

Adaptive Changes of Glioblastoma Cells Following Exposure to Hypoxic (1% Oxygen) Tumour Microenvironment

Ahmed Musah-Eroje et al. Int J Mol Sci. .

Abstract

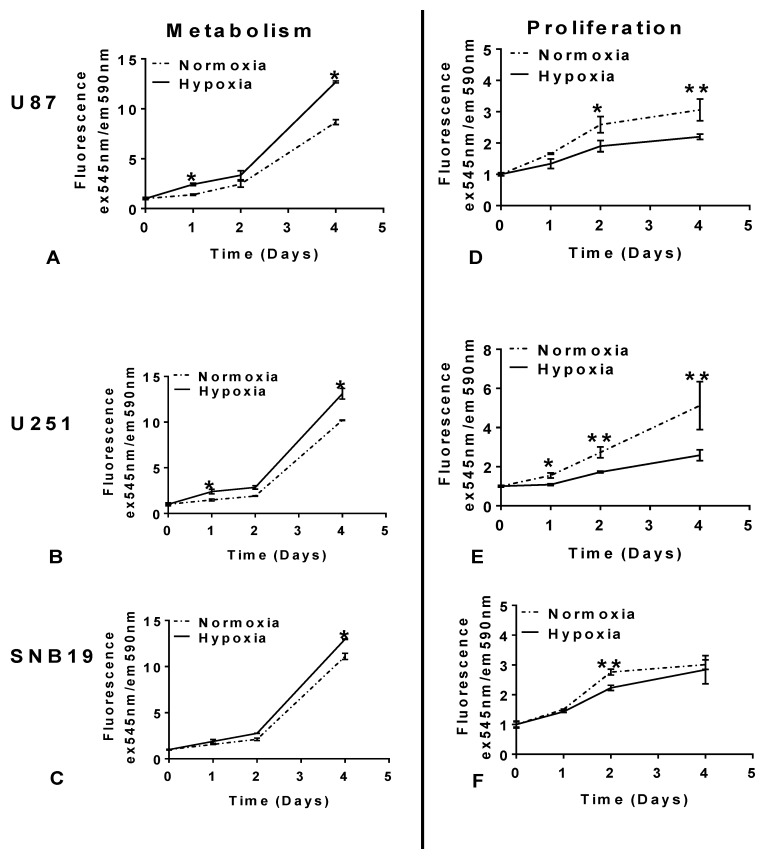
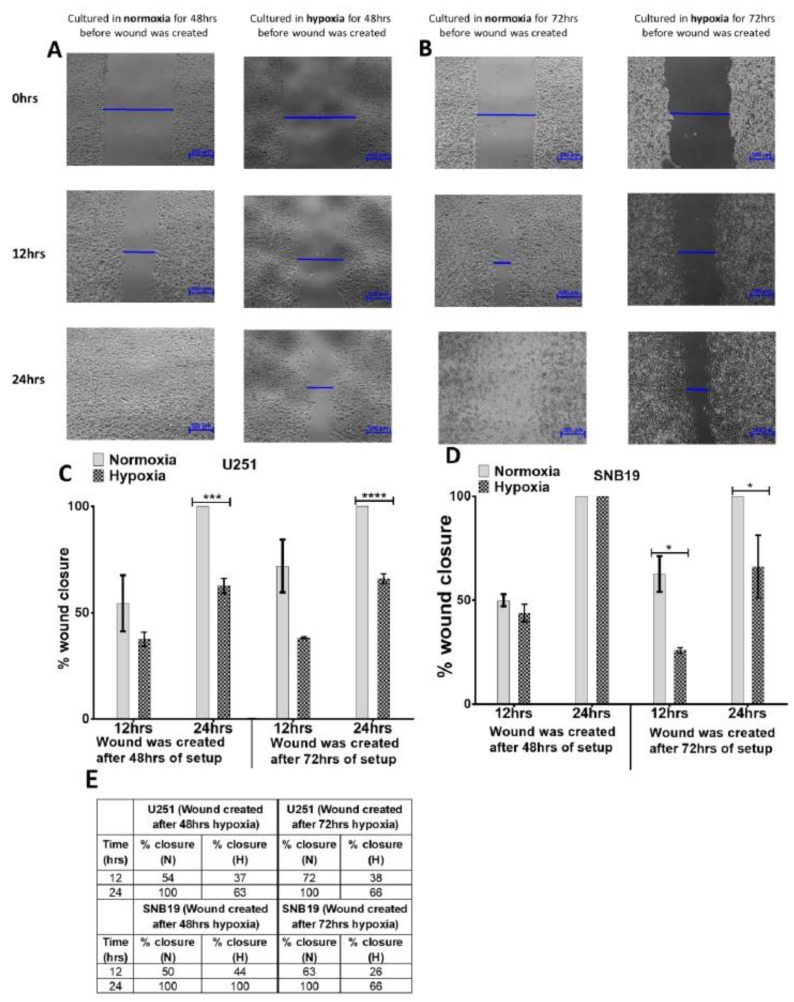
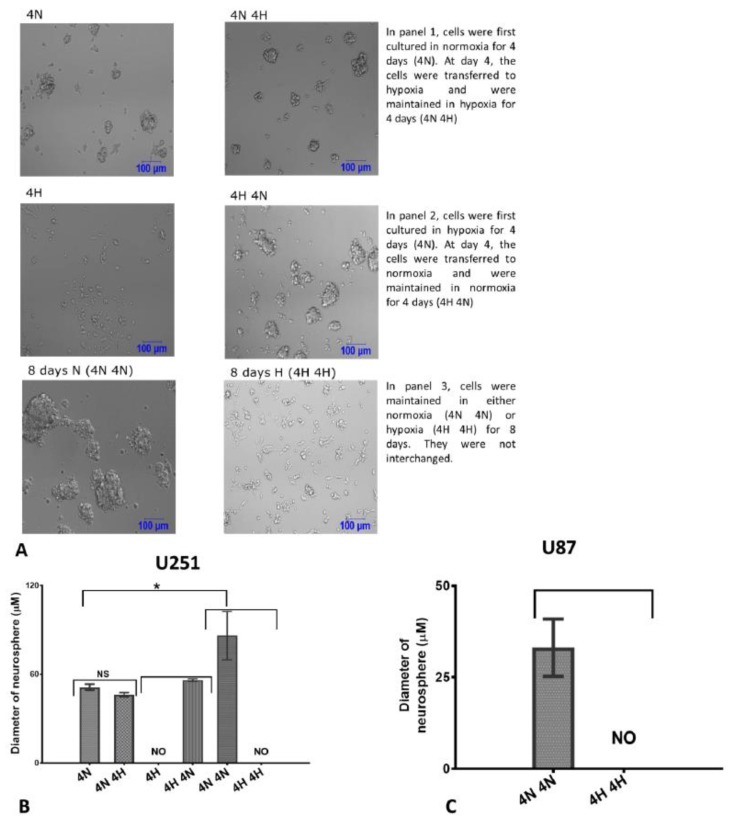
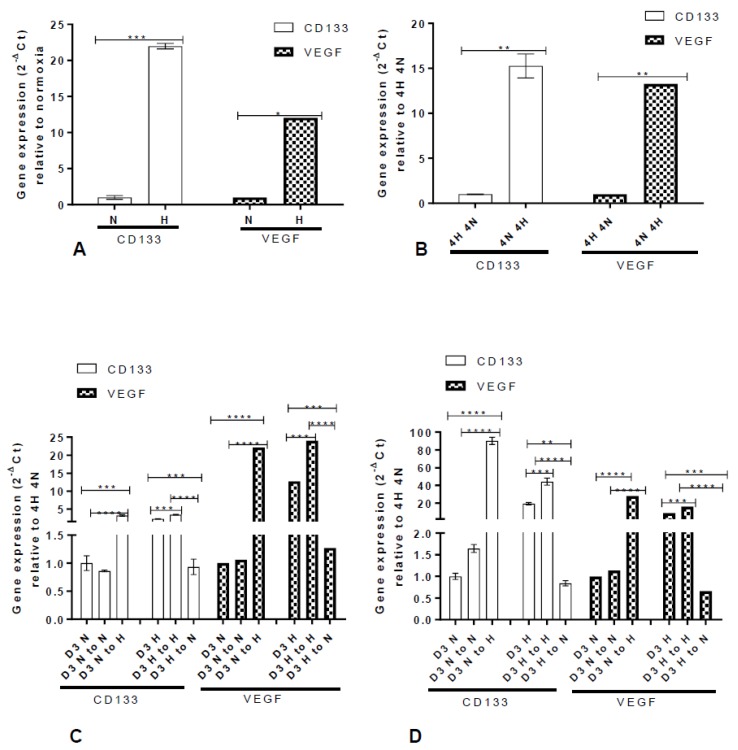
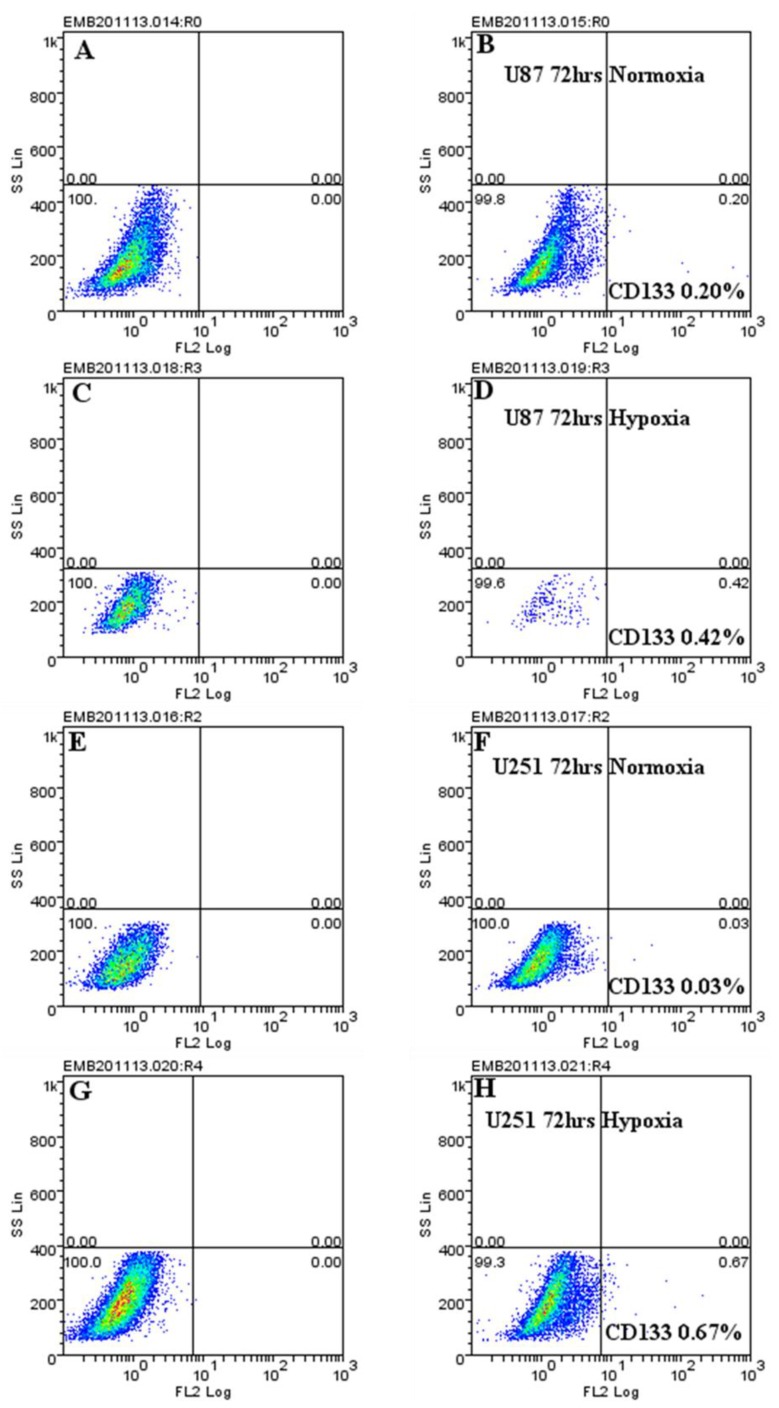
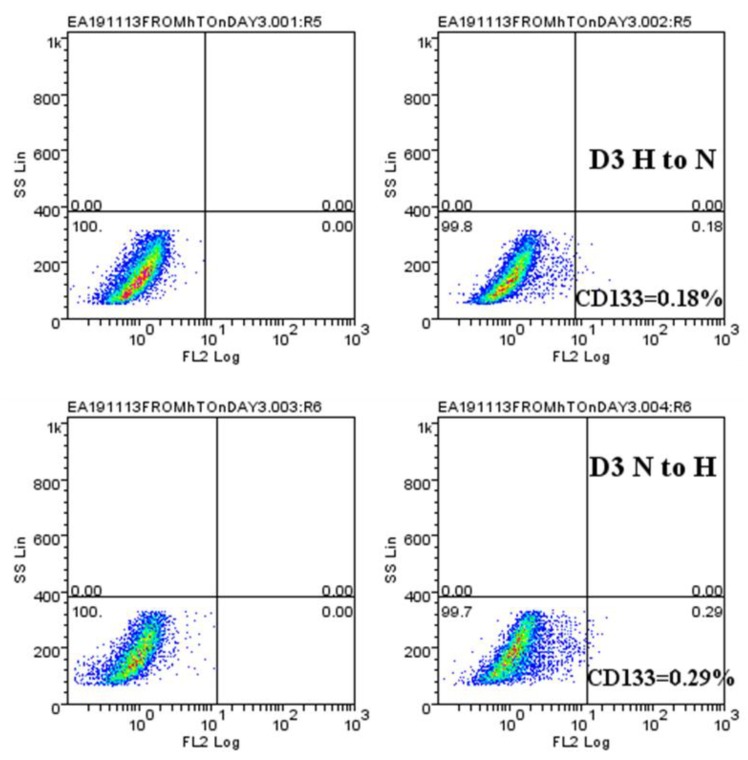
Glioblastoma multiforme is the most aggressive and malignant primary brain tumour, with a median survival rate of between 15 to 17 months. Heterogeneous regions occur in glioblastoma as a result of oxygen gradients which ranges from 0.1% to 10% in vivo. Emerging evidence suggests that tumour hypoxia leads to increased aggressiveness and chemo/radio resistance. Yet, few in vitro studies have been performed in hypoxia. Using three glioblastoma cell-lines (U87, U251, and SNB19), the adaptation of glioblastoma cells in a 1% (hypoxia) and 20% (normoxia) oxygen microenvironment on proliferation, metabolism, migration, neurosphere formation, CD133 and VEGF expression was investigated. Compared to cells maintained in normoxia (20% oxygen), glioblastoma cells adapted to 1% oxygen tension by reducing proliferation and enhancing metabolism. Both migratory tendency and neurosphere formation ability were greatly limited. In addition, hypoxic-mediated gene upregulation (CD133 and VEGF) was reversed when cells were removed from the hypoxic environment. Collectively, our results reveal that hypoxia plays a pivotal role in changing the behaviour of glioblastoma cells. We have also shown that genetic modulation can be reversed, supporting the concept of reversibility. Thus, understanding the degree of oxygen gradient in glioblastoma will be crucial in personalising treatment for glioblastoma patients.

Keywords: CD133; glioblastoma; hypoxia; personalised treatment; tumour microenvironment.


Conflict of interest statement

The authors declare no conflict of interest.

Figures

Figure 1
Figure 1
Exposure to hypoxia (1% oxygen) enhances metabolism but not proliferation. Glioblastoma cell lines- U87, U251 andSNB19, were setup with seeding density of 2000 cells per well in a 96-well plate. On the same day of setup, a day 0 reading was taken after cells had settled and a set of cells was transferred to hypoxia (un-dotted), while the control cells were maintained in normoxia (dotted). Metabolism was assessed with AlamarBlue (AC), while proliferation was measured with the CyQUANT cell assay (DF). The cells were read at the indicated times. The error bar represents standard error from 3 independent experiments for U87, U251, and n = 2 for SNB19 cells. Student’s t-test from Prism7 was used for statistical comparison. * p  <  0.05, ** p  <  0.01.
Figure 2
Figure 2
Exposure to hypoxia reduces migration in glioblastoma cells. Representative micrograph of the effect of hypoxia on migration in U251 glioblastoma cell line after 48 h (A) and 72 h (B) exposure to hypoxia. U251 cells were seeded with a seeding density of 1,000,000 c/w in a 6-well plate. The cells were either maintained in normoxia (20% oxygen)—left side—or hypoxia (1% oxygen)—right side. At either 48 h or 72 h of culture in either normoxia or hypoxia, a wound was created with a P200 tip. Pictures were taken with a Nikon microscope at 0 h, 12 h, and 24 h after the wound was created. The photomicrographs show the migration of U251 cells into the scratched area. (C,D) Graphical representation of percentage wound closure in the U251 (C) and SNB19 (D) cell lines. The closure of the wound was calculated as a percentage relative to the wound created at 0 h of wound creation (E) Percentage closure of wound after 48 h and 72 h exposure to hypoxia in U251 and SNB19 cell lines. Picture is representative of experiment repeated at least 3 times. * p  <  0.05, *** p  <  0.001, **** p  <  0.0001. Scale bar = 500 µm.
Figure 3
Figure 3
Hypoxia (1% oxygen) impairs the formation of neurospheres: (A) 1% oxygen tension impairs the formation of neurospheres. U251 cells were cultured as neurospheres with seeding density of 20,000 cells/well in a 24-well plate. At day 0 of setup, indicated groups were either maintained in normoxia or transferred to hypoxia. The condition of each group is indicated beside the pictures. The pictures are representative of experiment conducted at least 3 times. Scale bar = 100 µm. n = Normoxia, H = Hypoxia, D = Day. (B,C) Diameter of neurospheres formed in U251 (B) and U87 (C) following exposure to hypoxia: a Nikon confocal microscope was used to measure the width of neurospheres at the indicated days. The error bar indicates the average from two independent experiments. NS = Not significant, NO = Not obtained. * p < 0.05.
Figure 4
Figure 4
Reversibility of CD133 and VEGF mRNA expression following culture from hypoxia to normoxia. (A,B) U251 cells were cultured under normoxic (N) or hypoxic (H) conditions. CD133 and VEGF mRNA levels were quantified at day 4 using qRT-PCR (A). The cells cultured in hypoxia were subsequently re-oxygenated (20% oxygen) 4H 4N, while cells cultured in 20% oxygen were re-cultured in hypoxia (1% oxygen) 4N 4H. After 4 days, CD133 and VEGF mRNA levels were quantified using qRT-PCR (B). U87 (C) and U251 (D) cells were cultured in normoxia (D3N) and hypoxia (D3H) for 3 days. At day 3 in both conditions, the cells were harvested. Normoxia cells (D3N) were re-cultured in either normoxia (D3N to N) or hypoxia (D3N to H). Likewise, hypoxic cells (D3H) were re-cultured in either hypoxia (D3 H to H) or normoxia (D3 H to H). The cells were maintained for 3 days and mRNA expression of CD133 and VEGF was ascertained with qRT-PCR. The error bars represent an average of 3 independent experiments. One-way ANOVA (Prism7) was used for statistical comparison. ** P  <  0.01, *** P  <  0.001. **** P ˂ 0.0001.
Figure 5
Figure 5
CD133 protein is upregulated under hypoxic conditions. U87 (AC), and U251 (EH) cells were cultured under normoxic (A,B,E,F) and hypoxic (C,D,G,H) conditions for 72 h. For both conditions, the total isotype control cell populations (A,C,E,G) are presented based on side and scatter properties, and appropriate regions are gated and used to compare cells stained with the anti-CD133 antibody (B,D,F,H). The percentages of cells expressing CD133 after 72 h are indicated. The analyses were performed using Weasel software. The results are representative of at least 3 independent experiments.
Figure 6
Figure 6
CD133 expression is lost when hypoxic cells are recultured under normoxic conditions. Following exposure of U251 cells to either normoxia (D3 N) or hypoxia (D3 H), the cells were recultured in either normoxia (D3 H to N) or hypoxia (D3 N to H). For both conditions, the total isotype control cell populations are presented based on side and scatter properties, and appropriate regions are gated and used to compare cells stained with the anti-CD133 antibody. The percentages of cells expressing CD133 after 72 h of recultured are indicated. The analyses were performed using Weasel software. The results are representative of at least 3 independent experiments.

References

    1. Gilbert M.R., Wang M., Aldape K.D., Stupp R., Hegi M.E., Jaeckle K.A., Armstrong T.S., Wefel J.S., Won M., Blumenthal D.T. Dose-dense temozolomide for newly diagnosed glioblastoma: A randomized phase III clinical trial. J. Clin. Oncol. 2013;31:4085. doi: 10.1200/JCO.2013.49.6968. - DOI - PMC - PubMed
    1. Wang M., Dignam J.J., Won M., Curran W., Mehta M., Gilbert M.R. Variation over time and interdependence between disease progression and death among patients with glioblastoma on RTOG 0525. Neuro-Oncology. 2015;17:999–1006. doi: 10.1093/neuonc/nov009. - DOI - PMC - PubMed
    1. Stupp R., Mason W.P., Van Den Bent M.J., Weller M., Fisher B., Taphoorn M.J., Belanger K., Brandes A.A., Marosi C., Bogdahn U. Radiotherapy plus concomitant and adjuvant temozolomide for glioblastoma. New Engl. J. Med. 2005;352:987–996. doi: 10.1056/NEJMoa043330. - DOI - PubMed
    1. Stupp R., Hegi M.E., Mason W.P., van den Bent M.J., Taphoorn M.J., Janzer R.C., Ludwin S.K., Allgeier A., Fisher B., Belanger K. Effects of radiotherapy with concomitant and adjuvant temozolomide versus radiotherapy alone on survival in glioblastoma in a randomised phase III study: 5-year analysis of the EORTC-NCIC trial. Lancet Oncol. 2009;10:459–466. doi: 10.1016/S1470-2045(09)70025-7. - DOI - PubMed
    1. Balkwill F.R., Capasso M., Hagemann T. The Tumor Microenvironment at a Glance. The Company of Biologists Ltd.; Cambridge, UK: 2012. - PubMed

MeSH terms