. 2019 Apr 29;8(5):115.
doi: 10.3390/plants8050115.

1H-NMR Metabolite Fingerprinting Analysis Reveals a Disease Biomarker and a Field Treatment Response in Xylella fastidiosa subsp. pauca-Infected Olive Trees

Affiliations

1H-NMR Metabolite Fingerprinting Analysis Reveals a Disease Biomarker and a Field Treatment Response in Xylella fastidiosa subsp. pauca-Infected Olive Trees

Chiara Roberta Girelli et al. Plants (Basel). .

Abstract

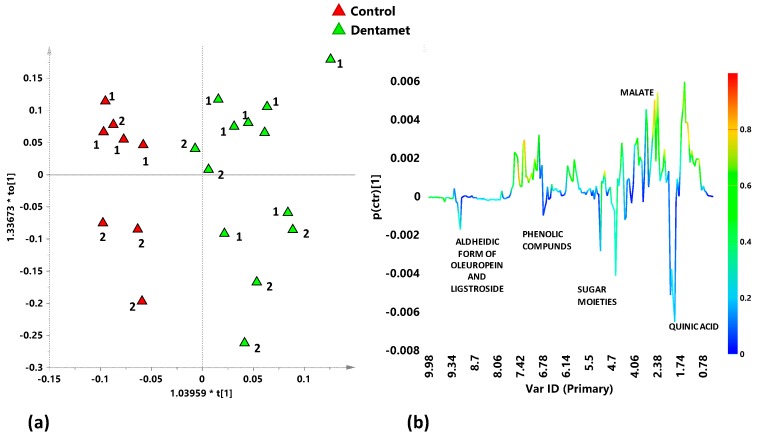
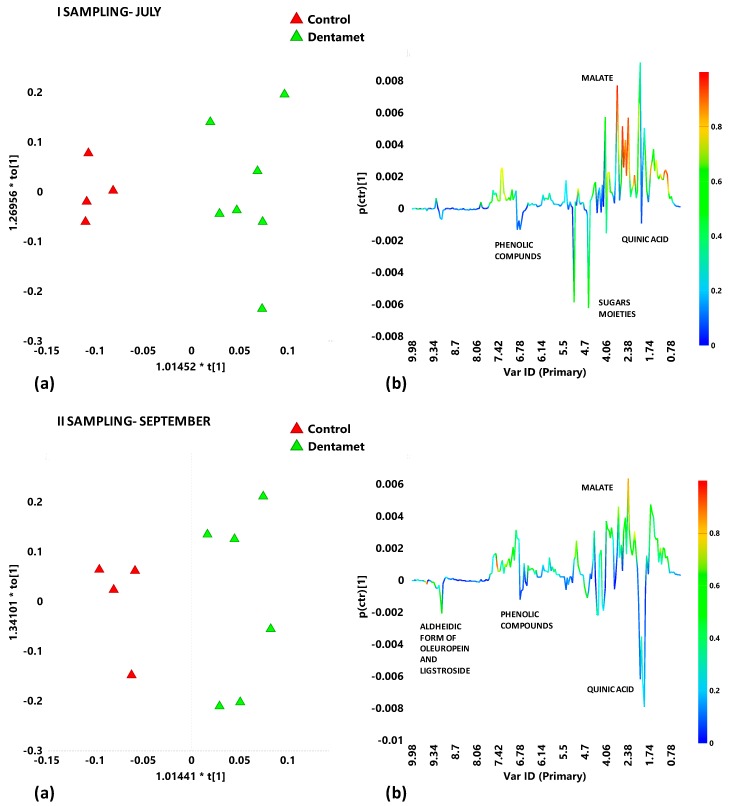
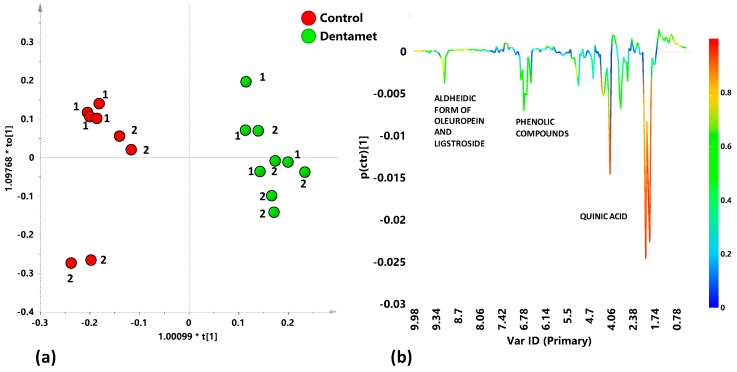
Xylella fastidiosa subsp. pauca is a xylem-limited bacterial phytopathogen currently found associated on many hectares with the "olive quick decline syndrome" in the Apulia region (Southern Italy), and the cultivars Ogliarola salentina and Cellina di Nardò result in being particularly sensitive to the disease. In order to find compounds showing the capability of reducing the population cell density of the pathogen within the leaves, we tested, in some olive orchards naturally-infected by the bacterium, a zinc-copper-citric acid biocomplex, namely Dentamet®, by spraying it to the crown, once per month, during spring and summer. The occurrence of the pathogen in the four olive orchards chosen for the trial was molecularly assessed. A 1H NMR metabolomic approach, in conjunction with a multivariate statistical analysis, was applied to investigate the metabolic pattern of both infected and treated adult olive cultivars, Ogliarola salentina and Cellina di Nardò trees, in two sampling periods, performed during the first year of the trial. For both cultivars and sampling periods, the orthogonal partial least squares discriminant analysis (OPLS-DA) gave good models of separation according to the treatment application. In both cultivars, some metabolites such as quinic acid, the aldehydic form of oleoeuropein, ligstroside and phenolic compounds, were consistently found as discriminative for the untreated olive trees in comparison with the Dentamet®-treated trees. Quinic acid, a precursor of lignin, was confirmed as a disease biomarker for the olive trees infected by X. fastidiosa subsp. pauca. When treated with Dentamet®, the two cultivars showed a distinct response. A consistent increase in malic acid was observed for the Ogliarola salentina trees, whereas in the Cellina di Nardò trees the treatments attenuate the metabolic response to the infection. To note that in Cellina di Nardò trees at the first sampling, an increase in γ-aminobutyric acid (GABA) was observed. This study highlights how the infection incited by X. fastidiosa subsp. pauca strongly modifies the overall metabolism of olive trees, and how a zinc-copper-citric acid biocomplex can induce an early re-programming of the metabolic pathways in the infected trees.

Keywords: GABA; malic acid; metabolomics; multivariate statistical analysis; polyphenols; quinic acid.


Conflict of interest statement

The authors declare no conflict of interest.

Figures

Figure 1
Figure 1
600 MHz typical 1H NMR spectrum of olive leaves aqueous extract sample. Expanded area in the range (a) 0.5–3.10 ppm; (b) 3.15–4.15 ppm; (c) 4.2–5.7 ppm and (d) 6–10 ppm. Assignment of the main peaks are indicated.
Figure 2
Figure 2
PCA t[1]/t[2] scores plot for Cellina di Nardò untreated (red circles) and treated with Dentamet® (green circles) leaf samples and Ogliarola salentina untreated (red triangles) and treated with Dentamet® leaf samples (green triangles) ((t[1] and t[2] explain 30.2% and 21.2% of the total variance, respectively).).
Figure 3
Figure 3
(a) OPLS-DA score plot for Ogliarola salentina (green triangles) and Cellina di Nardò (green circles) treated with Dentamet® leaf extracts samples (1+1+0; R2X = 0.516; R2Y = 0.916; Q2 = 0.838); (b) OPLS-DA score plot for Ogliarola salentina (red triangles) and Cellina di Nardò (red circles) untreated leaf extracts samples (1+1+0; R2X = 0.576; R2Y = 0.811; Q2 = 0.509).
Figure 4
Figure 4
(a) OPLS-DA score plot for Ogliarola salentina treated with Dentamet® (green triangles) and untreated (Control) (red triangles) leaf extracts samples (1+3+0; R2X = 0.613; R2Y = 0.815; Q2 = 0.418); (b) S-line plot for the model, indicating molecular components responsible for the class separation. The corresponding predictive loadings are coloured according to the correlation scaled loading [p(corr)].
Figure 5
Figure 5
(a) OPLS-DA models score plots and (b) S-line plots for Dentamet® treated (green triangles) and untreated (Control) (red triangles) for Ogliarola salentina leaf extracts in the first (July) and second (September) samplings. Model parameters were: 1+3+0; R2X = 0.823; R2Y = 0.928; Q2 = 0.586; I sampling, July, and 1+3+0; R2X = 0.857; R2Y = 0.9; Q2 = 0.0414, II sampling, September. Molecular components responsible for the class separation could be observed in the S-line plots. The corresponding predictive loadings are coloured according to the correlation scaled loading [p(corr)].
Figure 6
Figure 6
(a) OPLS-DA score plot for Cellina di Nardò treated with Dentamet® (green circles) and untreated (Control) (red circles) leaf extracts samples (1+1+0; R2X = 0.567; R2Y = 0.957; Q2 = 0.897); (b) S-line plot for the model, indicating molecular components responsible for the class separation. The corresponding predictive loadings are coloured according to the correlation scaled loading [p(corr)].
Figure 7
Figure 7
(a) OPLS-DA models score plots and (b) S-line plots for Dentamet® treated (green circles) and untreated (Control) (red circles) for Cellina di Nardò leaf extracts in the first (July) and second (September) samplings; Model parameters were (1+1+0; R2X = 0.742; R2Y = 0.989; Q2 = 0.945; I sampling, July) and (1+1+0; R2X = 0.697; R2Y = 0.974; Q2 = 0.9, II sampling, September). Molecular components responsible for the class separation could be observed in the S-line plots. The corresponding predictive loadings are coloured according to the correlation scaled loading [p(corr)].

References

    1. Purcell A. Paradigms: Examples from the bacterium Xylella fastidiosa. Annu. Rev. Phytopathol. 2013;51:339–356. doi: 10.1146/annurev-phyto-082712-102325. - DOI - PubMed
    1. Schaad N.W., Postnikova E., Lacy G., Fatmi M.B., Chang C.-J. Xylella fastidiosa subspecies: X. fastidiosa subsp piercei, subsp. nov., X. fastidiosa subsp. multiplex subsp. nov., and X. fastidiosa subsp. pauca subsp. nov. Syst. Appl. Microbiol. 2004;27:290–300. - PubMed
    1. Denancé N., Briand M., Gaborieau R., Gaillard S., Jacques M.-A. Identification of genetic relationships and subspecies signatures in Xylella fastidiosa. BMC Genom. 2019;20:239. doi: 10.1186/s12864-019-5565-9. - DOI - PMC - PubMed
    1. Marcelletti S., Scortichini M. Genome-wide comparison and taxonomic relatedness of multiple Xylella fastidiosa strains reveal the occurrence of three subspecies and a new Xylella species. Arch. Microbiol. 2016;198:803–812. doi: 10.1007/s00203-016-1245-1. - DOI - PubMed
    1. Martelli G., Boscia D., Porcelli F., Saponari M. The olive quick decline syndrome in south-east Italy: A threatening phytosanitary emergency. Eur. J. Plant Pathol. 2016;144:235–243. doi: 10.1007/s10658-015-0784-7. - DOI

LinkOut - more resources