

Dual prognostic role of 2-oxoglutarate-dependent oxygenases in ten cancer types: implications for cell cycle regulation and cell adhesion maintenance
- PMID: 31036064
- PMCID: PMC6489267
- DOI: 10.1186/s40880-019-0369-5
Dual prognostic role of 2-oxoglutarate-dependent oxygenases in ten cancer types: implications for cell cycle regulation and cell adhesion maintenance
Abstract
Background: Tumor hypoxia is associated with metastasis and resistance to chemotherapy and radiotherapy. Genes involved in oxygen-sensing are clinically relevant and have significant implications for prognosis. In this study, we examined the pan-cancer prognostic significance of oxygen-sensing genes from the 2-oxoglutarate-dependent oxygenase family.
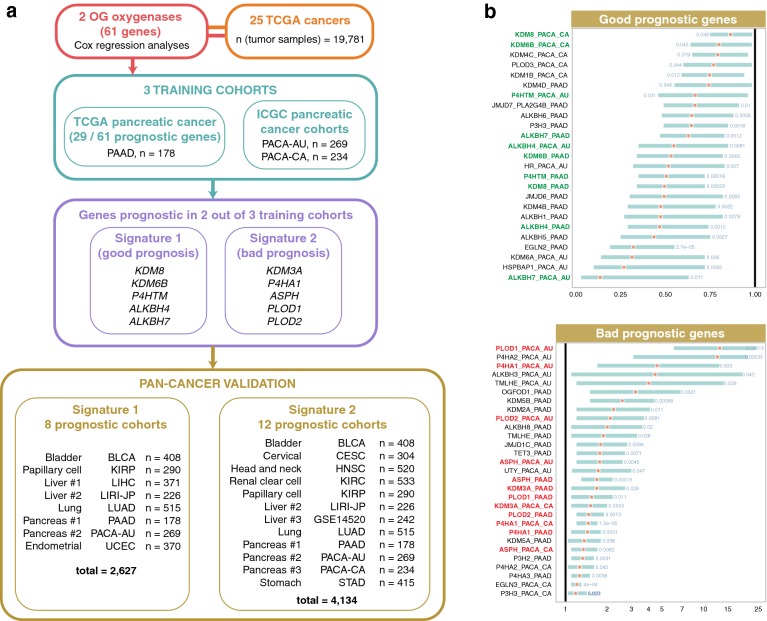
Methods: A multi-cohort, retrospective study of transcriptional profiles of 20,752 samples of 25 types of cancer was performed to identify pan-cancer prognostic signatures of 2-oxoglutarate-dependent oxygenase gene family (a family of oxygen-dependent enzymes consisting of 61 genes). We defined minimal prognostic gene sets using three independent pancreatic cancer cohorts (n = 681). We identified two signatures, each consisting of 5 genes. The ability of the signatures in predicting survival was tested using Cox regression and receiver operating characteristic (ROC) curve analyses.
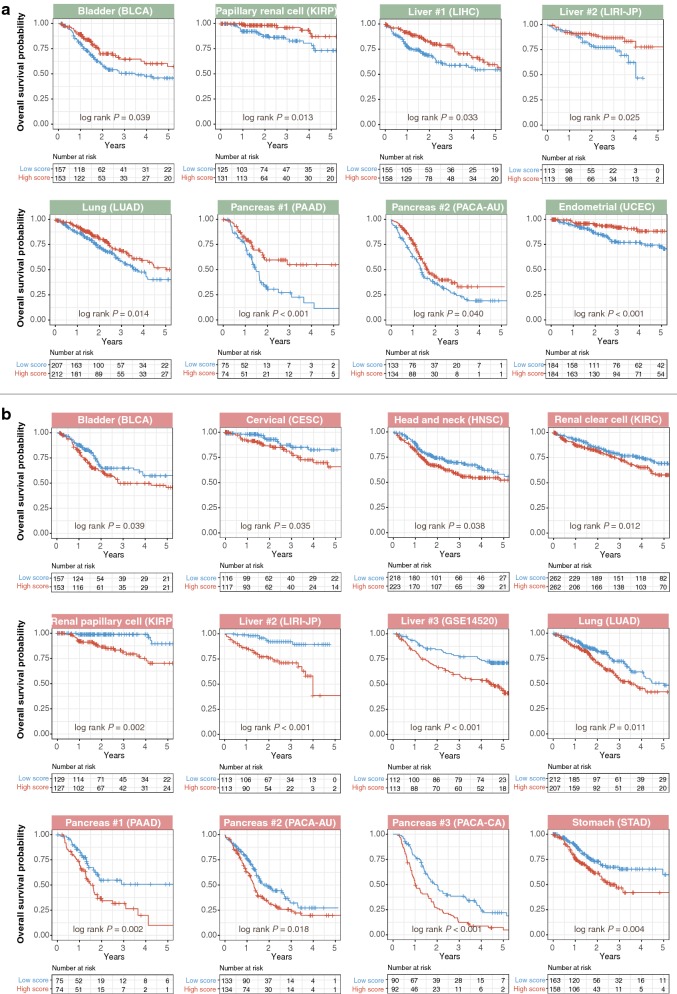
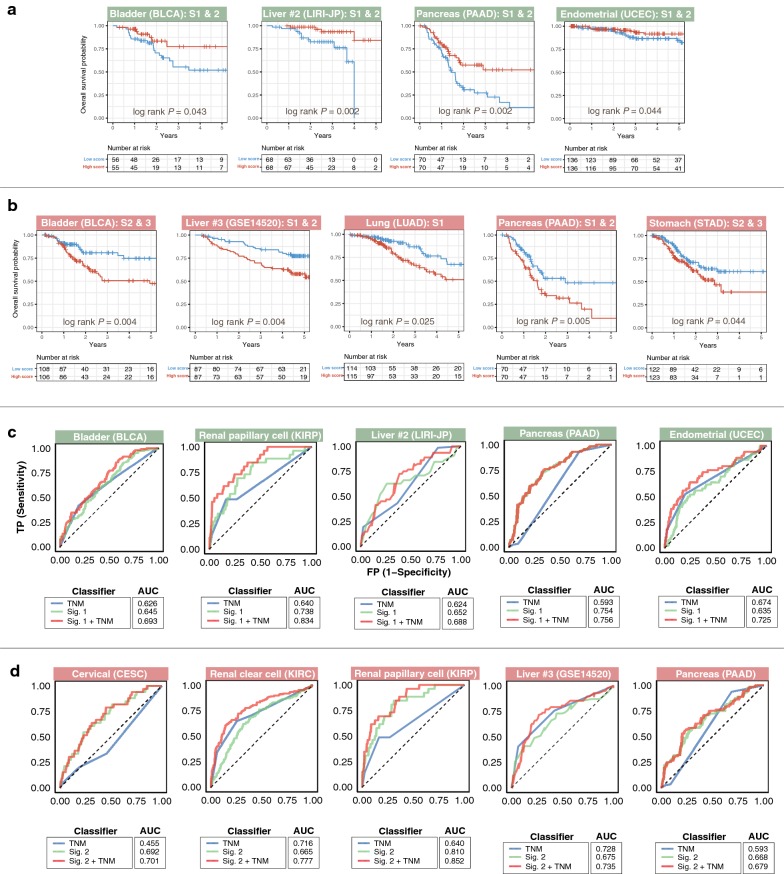
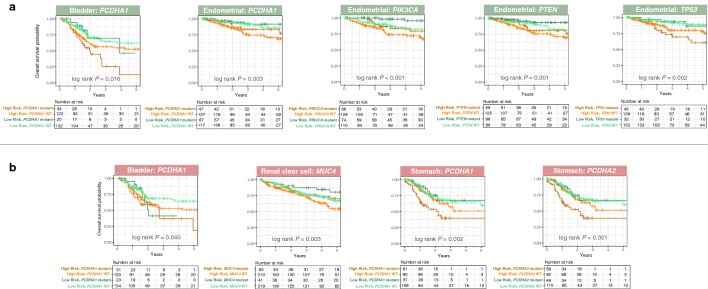
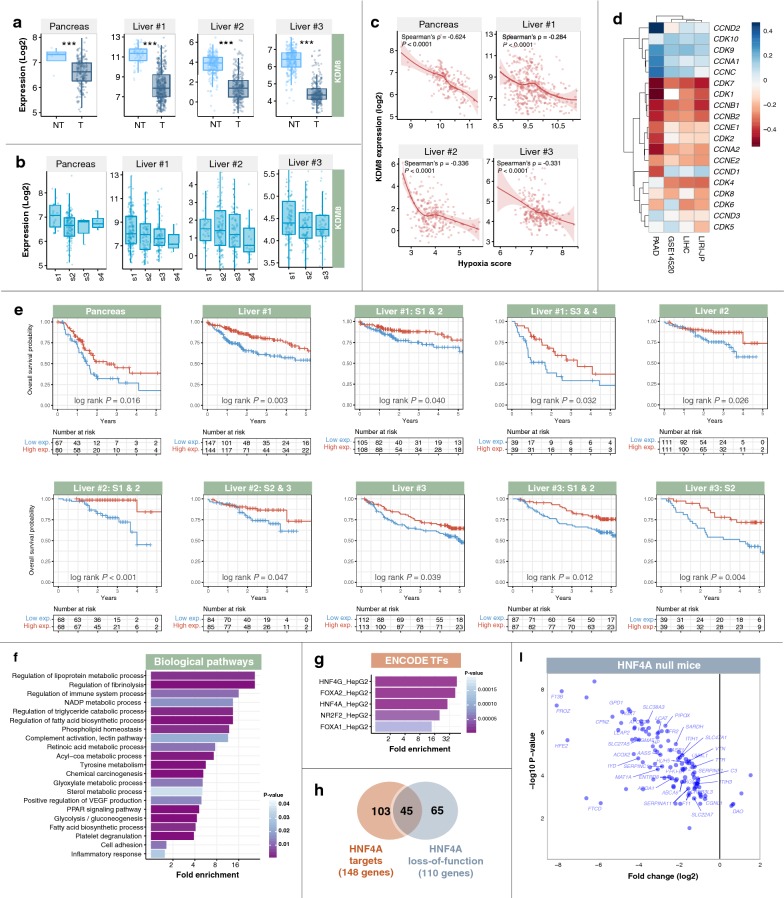
Results: Signature 1 (KDM8, KDM6B, P4HTM, ALKBH4, ALKBH7) and signature 2 (KDM3A, P4HA1, ASPH, PLOD1, PLOD2) were associated with good and poor prognosis. Signature 1 was prognostic in 8 cohorts representing 6 cancer types (n = 2627): bladder urothelial carcinoma (P = 0.039), renal papillary cell carcinoma (P = 0.013), liver cancer (P = 0.033 and P = 0.025), lung adenocarcinoma (P = 0.014), pancreatic adenocarcinoma (P < 0.001 and P = 0.040), and uterine corpus endometrial carcinoma (P < 0.001). Signature 2 was prognostic in 12 cohorts representing 9 cancer types (n = 4134): bladder urothelial carcinoma (P = 0.039), cervical squamous cell carcinoma and endocervical adenocarcinoma (P = 0.035), head and neck squamous cell carcinoma (P = 0.038), renal clear cell carcinoma (P = 0.012), renal papillary cell carcinoma (P = 0.002), liver cancer (P < 0.001, P < 0.001), lung adenocarcinoma (P = 0.011), pancreatic adenocarcinoma (P = 0.002, P = 0.018, P < 0.001), and gastric adenocarcinoma (P = 0.004). Multivariate Cox regression confirmed independent clinical relevance of the signatures in these cancers. ROC curve analyses confirmed superior performance of the signatures to current tumor staging benchmarks. KDM8 was a potential tumor suppressor down-regulated in liver and pancreatic cancers and an independent prognostic factor. KDM8 expression was negatively correlated with that of cell cycle regulators. Low KDM8 expression in tumors was associated with loss of cell adhesion phenotype through HNF4A signaling.
Conclusion: Two pan-cancer prognostic signatures of oxygen-sensing genes were identified. These genes can be used for risk stratification in ten diverse cancer types to reveal aggressive tumor subtypes.
Keywords: 2-Oxoglutarate-dependent oxygenase; HNF4A; Hypoxia; KDM8; Oxygen-sensing gene; Pan-cancer; Prognosis.
Conflict of interest statement
The authors declare that they have no competing interests.
Figures
Similar articles
-
Transcriptional landscape of DNA repair genes underpins a pan-cancer prognostic signature associated with cell cycle dysregulation and tumor hypoxia.DNA Repair (Amst). 2019 Jun;78:142-153. doi: 10.1016/j.dnarep.2019.04.008. Epub 2019 Apr 24. DNA Repair (Amst). 2019. PMID: 31054516
-
A novel signature derived from immunoregulatory and hypoxia genes predicts prognosis in liver and five other cancers.J Transl Med. 2019 Jan 9;17(1):14. doi: 10.1186/s12967-019-1775-9. J Transl Med. 2019. PMID: 30626396 Free PMC article.
-
The panoramic picture of pepsinogen gene family with pan-cancer.Cancer Med. 2020 Dec;9(23):9064-9080. doi: 10.1002/cam4.3489. Epub 2020 Oct 17. Cancer Med. 2020. PMID: 33067881 Free PMC article.
-
Integrative data mining and meta-analysis to investigate the prognostic role of microRNA-200 family in various human malignant neoplasms: A consideration on heterogeneity.Gene. 2019 Oct 20;716:144025. doi: 10.1016/j.gene.2019.144025. Epub 2019 Aug 5. Gene. 2019. PMID: 31394177 Review.
-
Prognostic Cancer Gene Expression Signatures: Current Status and Challenges.Cells. 2021 Mar 15;10(3):648. doi: 10.3390/cells10030648. Cells. 2021. PMID: 33804045 Free PMC article. Review.
Cited by
-
PLOD1 Is a Prognostic Biomarker and Mediator of Proliferation and Invasion in Osteosarcoma.Biomed Res Int. 2020 Oct 19;2020:3418398. doi: 10.1155/2020/3418398. eCollection 2020. Biomed Res Int. 2020. PMID: 33134376 Free PMC article.
-
KDM3A Modulates Trastuzumab Resistance in HER2- Positive Breast Cancer Cells via the PI3K/AKT/ERK Pathway.Biochem Genet. 2025 Jul 2. doi: 10.1007/s10528-025-11170-8. Online ahead of print. Biochem Genet. 2025. PMID: 40603821
-
Bioinformatics analysis shows that TOP2A functions as a key candidate gene in the progression of cervical cancer.Biomed Rep. 2020 Oct;13(4):21. doi: 10.3892/br.2020.1328. Epub 2020 Jul 9. Biomed Rep. 2020. PMID: 32765860 Free PMC article.
-
Timing gone awry: distinct tumour suppressive and oncogenic roles of the circadian clock and crosstalk with hypoxia signalling in diverse malignancies.J Transl Med. 2019 Apr 23;17(1):132. doi: 10.1186/s12967-019-1880-9. J Transl Med. 2019. PMID: 31014368 Free PMC article.
-
D-2-hydroxyglutarate dehydrogenase in breast carcinoma as a potent prognostic marker associated with proliferation.Histol Histopathol. 2021 Oct;36(10):1053-1062. doi: 10.14670/HH-18-362. Epub 2021 Jul 23. Histol Histopathol. 2021. PMID: 34296423
References
MeSH terms
Substances
LinkOut - more resources
Full Text Sources
Miscellaneous
