

A 117-year retrospective analysis of Pennsylvania tick community dynamics
- PMID: 31036065
- PMCID: PMC6489237
- DOI: 10.1186/s13071-019-3451-6
A 117-year retrospective analysis of Pennsylvania tick community dynamics
Abstract
Background: Tick-borne diseases have been increasing at the local, national, and global levels. Researchers studying ticks and tick-borne diseases need a thorough knowledge of the pathogens, vectors, and epidemiology of disease spread. Both active and passive surveillance approaches are typically used to estimate tick population size and risk of tick encounter. Our data consists of a composite of active and long-term passive surveillance, which has provided insight into spatial variability and temporal dynamics of ectoparasite communities and identified rarer tick species. We present a retrospective analysis on compiled data of ticks from Pennsylvania over the last 117 years.
Methods: We compiled data from ticks collected during tick surveillance research, and from citizen-based submissions. The majority of the specimens were submitted by citizens. However, a subset of the data was collected through active methods (flagging or dragging, or removal of ticks from wildlife). We analyzed all data from 1900-2017 for tick community composition, host associations, and spatio-temporal dynamics.
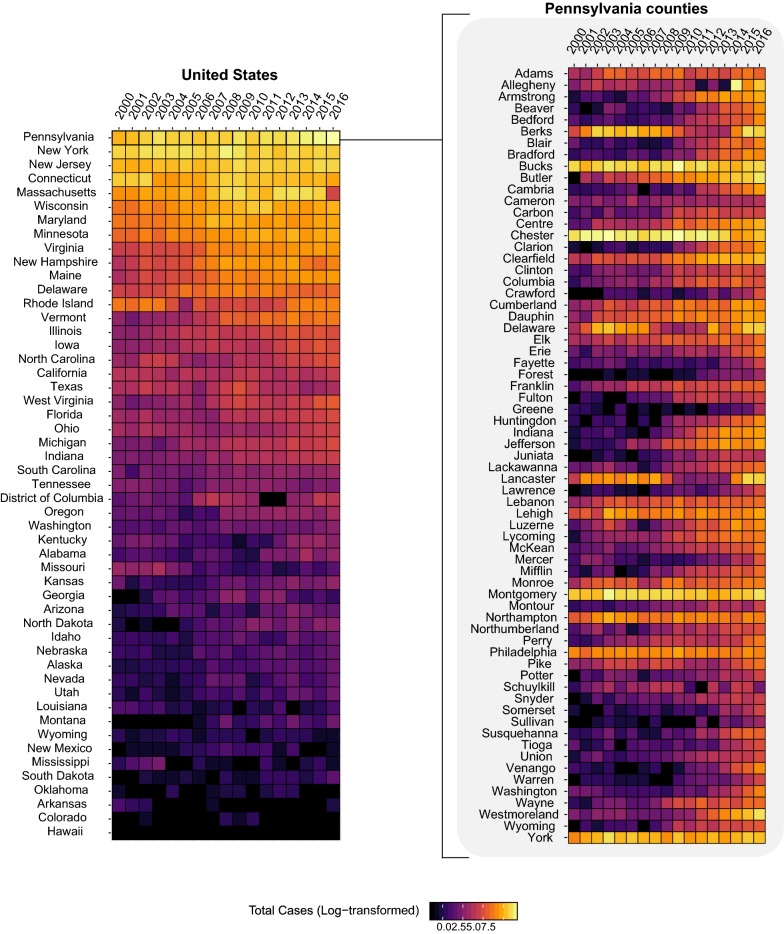
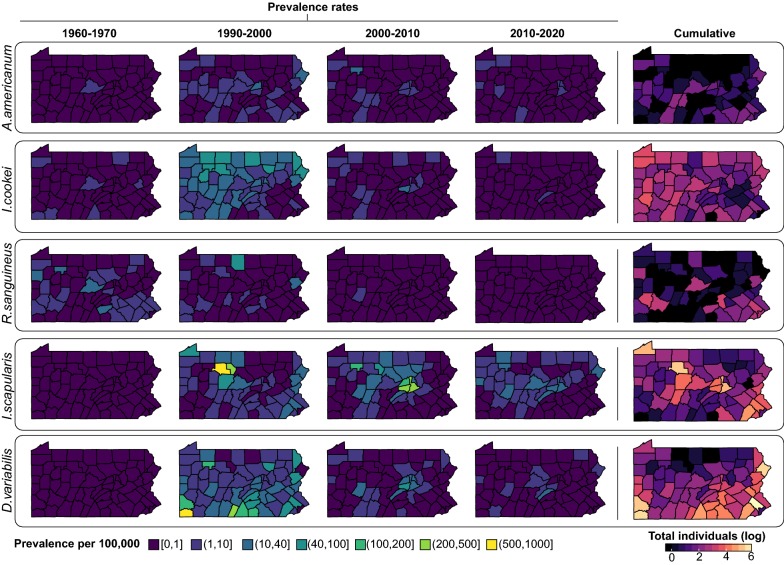
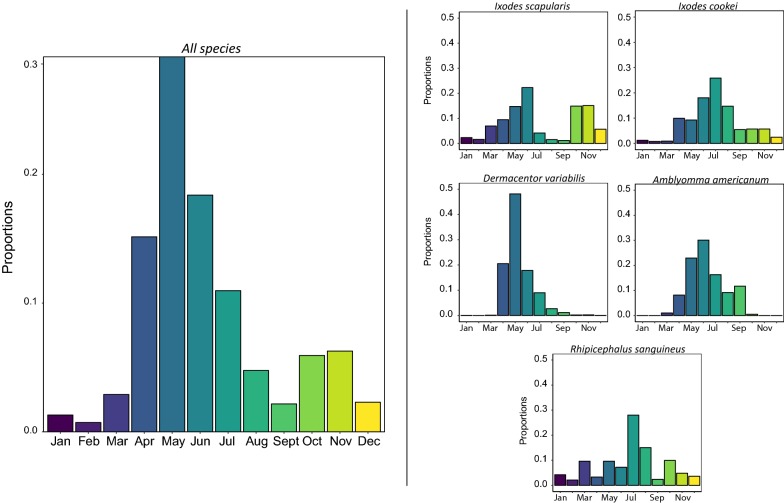
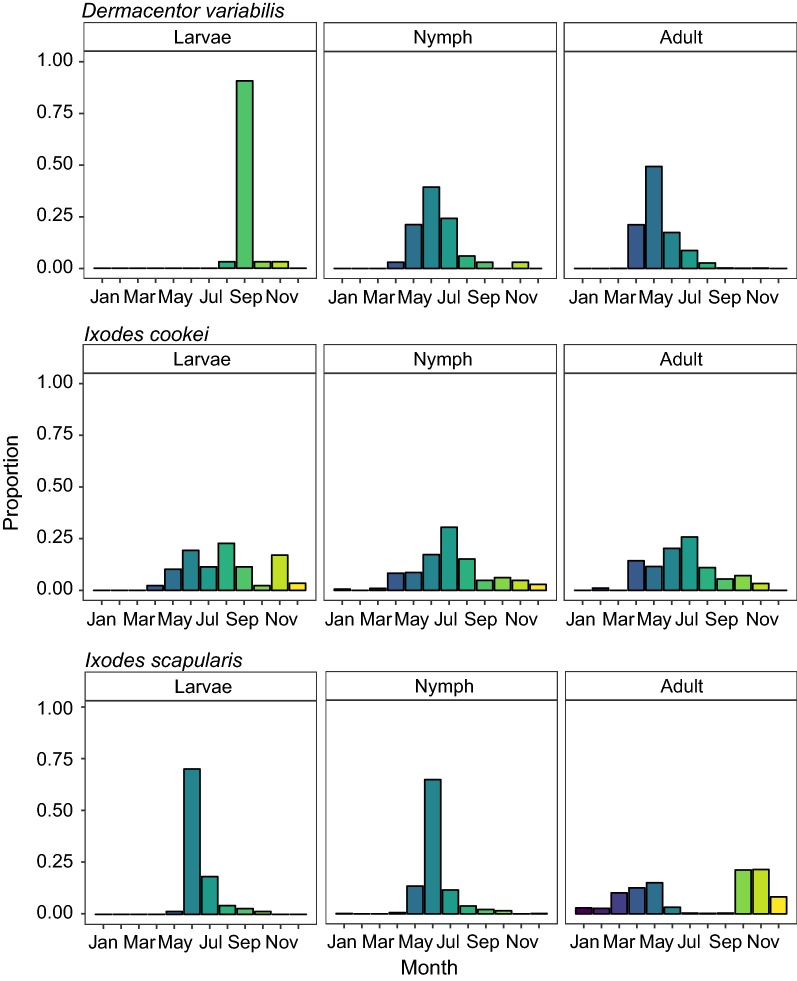
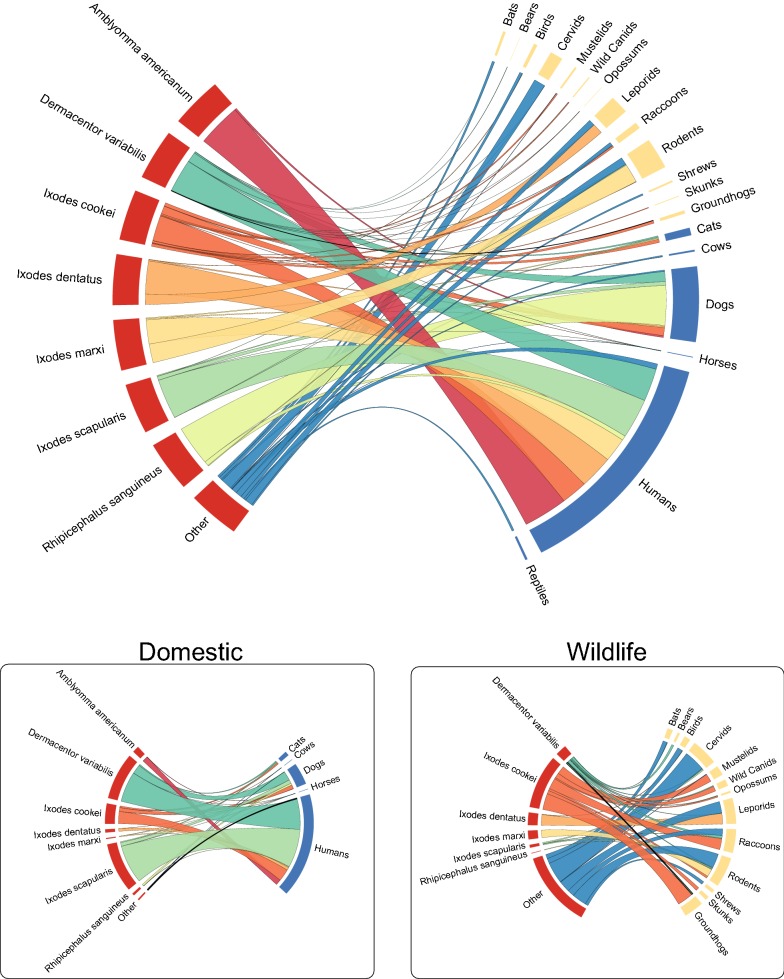
Results: In total there were 4491 submission lots consisting of 7132 tick specimens. Twenty-four different species were identified, with the large proportion of submissions represented by five tick species. We observed a shift in tick community composition in which the dominant species of tick (Ixodes cookei) was overtaken in abundance by Dermacentor variabilis in the early 1990s and then replaced in abundance by I. scapularis. We analyzed host data and identified overlaps in host range amongst tick species.
Conclusions: We highlight the importance of long-term passive tick surveillance in investigating the ecology of both common and rare tick species. Information on the geographical distribution, host-association, and seasonality of the tick community can help researchers and health-officials to identify high-risk areas.
Keywords: Community composition; Museum collections; Passive surveillance; Ticks.
Conflict of interest statement
The authors declare that they have no competing interests.
Figures

References
-
- Simon JA, Marrotte RR, Desrosiers N, Fiset J, Gaitan J, Gonzalez A, et al. Climate change and habitat fragmentation drive the occurrence of Borrelia burgdorferi, the agent of Lyme disease, at the northeastern limit of its distribution. Evol Appl. 2014;7:750–764. doi: 10.1111/eva.12165. - DOI - PMC - PubMed
Publication types
MeSH terms
Grants and funding
LinkOut - more resources
Full Text Sources
Medical
