. 2019 Apr 29;7(1):115.
doi: 10.1186/s40425-019-0573-5.

STING agonist inflames the pancreatic cancer immune microenvironment and reduces tumor burden in mouse models

Affiliations

STING agonist inflames the pancreatic cancer immune microenvironment and reduces tumor burden in mouse models

Weiqing Jing et al. J Immunother Cancer. .

Abstract

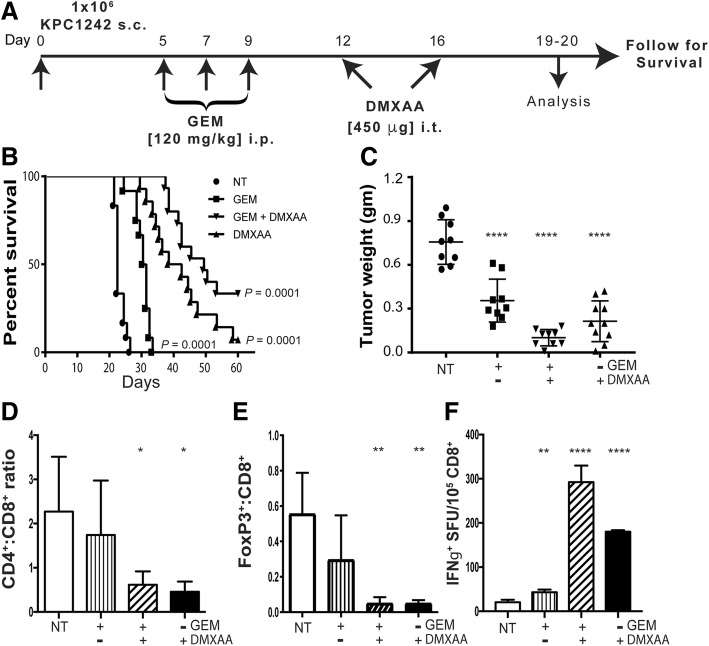
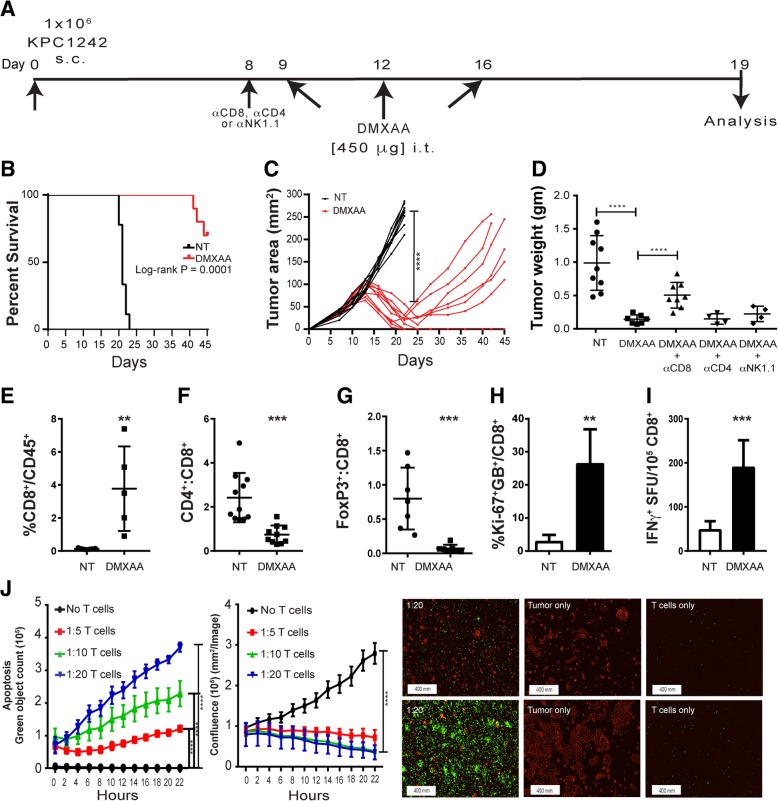
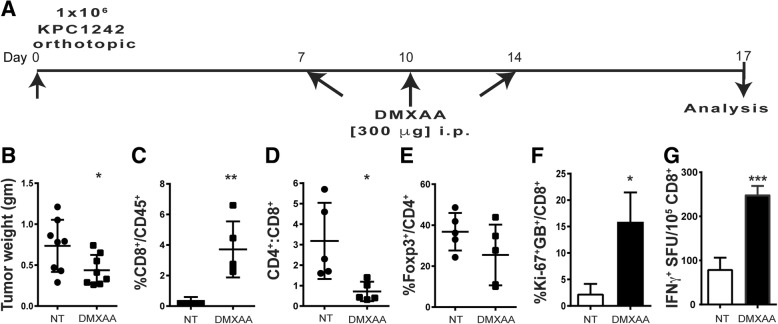
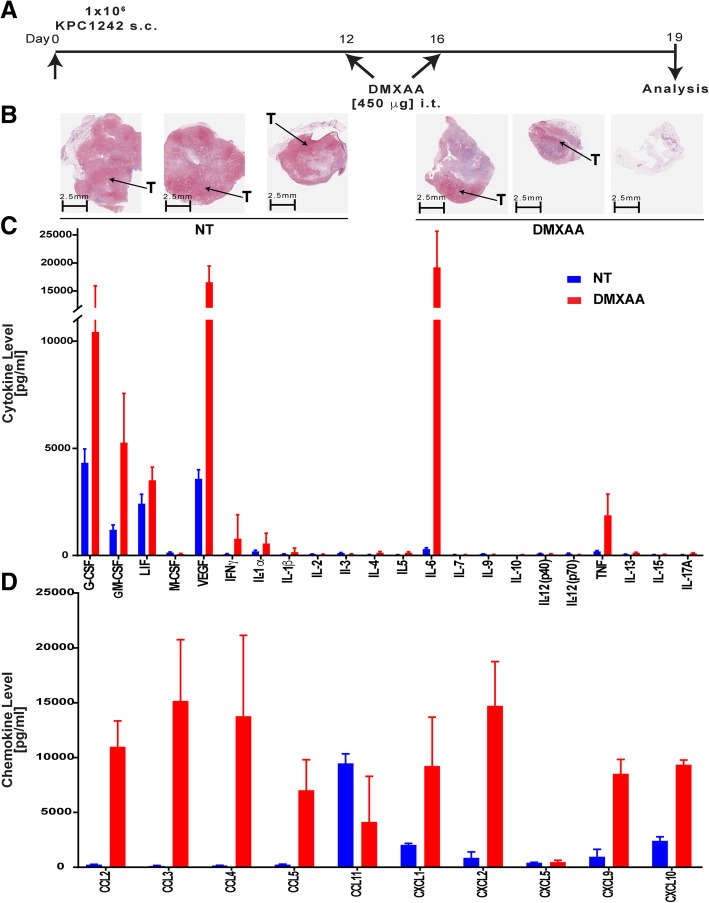
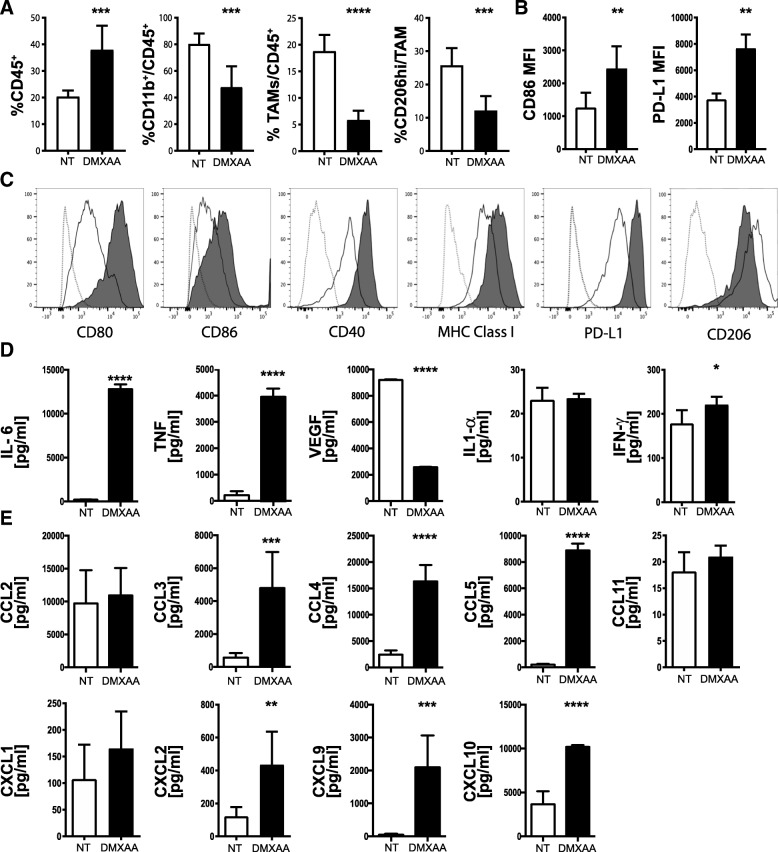
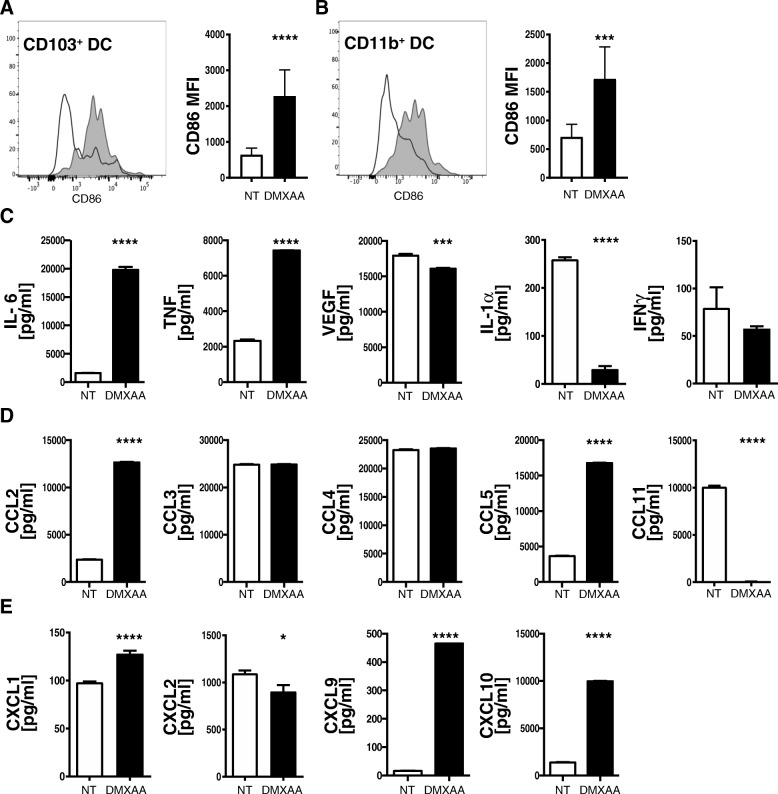
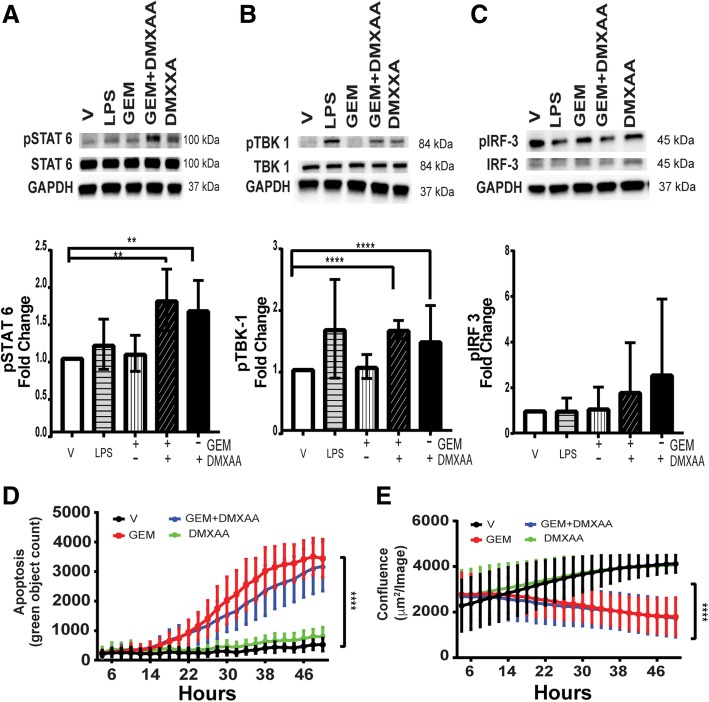
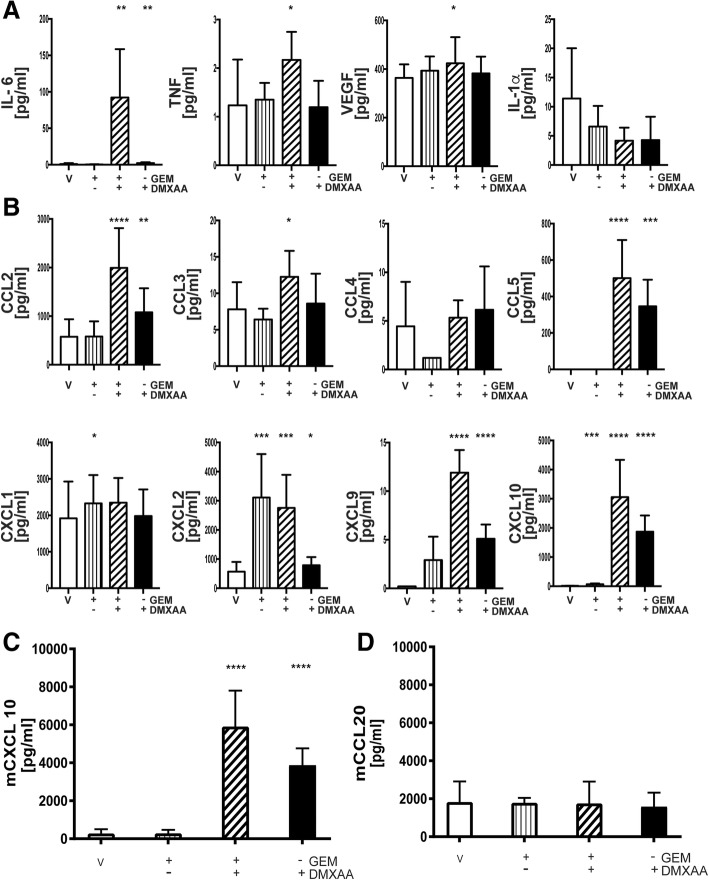
Pancreatic cancer is characterized by an immune suppressive stromal reaction that creates a barrier to therapy. A murine transgenic pancreatic cancer cell line that recapitulates human disease was used to test whether a STimulator of Interferon Genes (STING) agonist could reignite immunologically inert pancreatic tumors. STING agonist treatment potently changed the tumor architecture, altered the immune profile, and increased the survival of tumor-bearing mice. Notably, STING agonist increased numbers and activity of cytotoxic T cells within tumors and decreased levels of suppressive regulatory T cells. Further, STING agonist treatment upregulated costimulatory molecule expression on cross-presenting dendritic cells and reprogrammed immune-suppressive macrophages into immune-activating subtypes. STING agonist promoted the coordinated and differential cytokine production by dendritic cells, macrophages, and pancreatic cancer cells. Cumulatively, these data demonstrate that pancreatic cancer progression is potently inhibited by STING agonist, which reignited immunologically cold pancreatic tumors to promote trafficking and activation of tumor-killing T cells.

Keywords: CXCL10; Cancer proliferation; Cytotoxic T cells; Immune activation; STING agonist; Tumor infiltrating lymphocytes; Tumor selectivity.


Conflict of interest statement

Ethics approval and consent to participate

Not applicable.

Consent for publication

Not applicable.

Competing interests

M.B. Dwinell has ownership interests in Protein Foundry, LLC which produces ultra-pure recombinant chemokines for research (proteinfoundry.com). The other authors have no conflict of interest to disclose.

Publisher’s Note

Springer Nature remains neutral with regard to jurisdictional claims in published maps and institutional affiliations.

Figures

Fig. 1
Fig. 1
Increased survival and immune activation in mice treated with gemcitabine and STING agonist. a Experimental treatment strategy of subcutaneous (s.c.) pancreatic tumors in C57BL/6 mice. Control not treated (NT) and experimental mice were treated as indicated. b Kaplan-Meier survival curves are shown for the indicated control and experimental groups. Data are representative of 3 independent experiments (n = 14–15 mice per group). c Tumors were collected 19 or 20 days after implantation and tumor weight measured. d, e Tumors were processed into single cell suspensions and CD4:CD8 ratios and percent Foxp3+ cells within the CD8+ T cell compartment determined by flow cytometry. f Splenic CD8+ T cells were isolated by immunomagnetic sorting and tested in IFN-γ ELISPOT assays using KPC1242 tumor cells as stimulators. Values are mean IFN-γ spot forming unit (SFU) ± SD, n = 3 independent experiments. *, P ≤ 0.05; **, P ≤ 0.01; ***, P ≤ 0.001; ****, P ≤ 0.0001
Fig. 2
Fig. 2
STING activation with DMXAA activates CD8+ T cells and induces pancreatic cancer regression in mice. a Subcutaneous tumor cell implantation and treatment strategy. b Kaplan-Meier survival curves for non-treated (NT) control (black line) and experimental groups. c Tumor growth over time in DMXAA-treated (red lines) or control (black lines) mice. Data are from two separate experiments, n = 8–10 mice per group. d Excised tumor weights were measured 19 days after implantation. CD8, CD4, or NK cells were immunodepleted in vivo and tumor size measured at study end. e-h Tumors were collected and processed into single cell suspensions and immune profiling of CD8 T cells assessed using flow cytometry. Values are mean ± SD, n = 6–8. i Spleen-derived CD8+ T cells were isolated by immunomagnetic sorting and tested in IFN-γ ELISPOT assays using KPC1242 tumor cells as stimulators. Values are mean IFN-γ spot forming unit (SFU) ± SD. Data are from 1 of 3 replicate experiments, and the CD8+ T cells were isolated from the pooled splenocytes of 3 mice. j Killing of KPC1242 cancer cells by ex vivo-expanded tumor-infiltrating CD8+ T cells from DMXAA-treated tumors. Values are mean ± SD, n = 3. Representative images of apoptotic cells (green) and living tumor cells (red) at 2 h (top) and 22 h (bottom). *, P ≤ 0.05; **, P ≤ 0.01; ***, P ≤ 0.001
Fig. 3
Fig. 3
Systemic STING agonist activates CD8+ T cells and induces tumor regression in mice with pancreatic cancer. a Orthotopic tumor implantation and treatment strategy. b Excised tumor wet weights from experimental and control mice. Values are mean ± SD, n = 8 mice per group. *, P ≤ 0.05. c-e Tumors were collected and processed into single cell suspensions and immune profiling of infiltrated lymphocytes in DMXAA-treated and control mice completed using flow cytometry. c The percentage of CD8+ T cells as a percent of tumor infiltrated CD45+ cells. d CD4:CD8 ratio of CD45+ gated leukocytes. f Percentage of Foxp3+ T cells as a percent of CD4+ T cells. f Percentage of infiltrating CD8+ T cells expressing Ki-67 and Granzyme B (GB) within the tumor. g Spleen CD8+ T cells were isolated by immunomagnetic sorting and tested in IFN-γ ELISPOT assays using KPC1242 tumor cells as stimulators. Graphs represent the mean spot forming units (SFU) ± SD of 2 independent experiments. *, P ≤ 0.05; **, P ≤ 0.01; ***, P ≤ 0.001
Fig. 4
Fig. 4
DMXAA induces the production of proinflammatory cytokines and chemokines in vivo. a Timeline for intra-tumoral treatment with DMXAA. Control mice were not treated (NT). b Representative histopathologic tissue specimens stained with Masson’s trichrome from untreated and DMXAA-treated mice. Tumor tissues (T) stain red while collagen stains blue. c, d Multiplex analysis of intra-tumoral cytokines and chemokines in non-treated (NT, blue bars) or DMXAA-treated (red bars) tumors. Values are mean ± SD, n = 9 control non-treated and 15 DMXAA treated mice from 2 independent experiments
Fig. 5
Fig. 5
DMXAA reprograms TAMs in vivo and activates macrophages in vitro. Tumors were harvested on day 19, dissociated and immune cell subsets analyzed by flow cytometry. a Percent of viable CD45+ leukocytes, CD11b+,Ly6G, Ly6CLo, F4/80Hi, MHC Class II+ myeloid tumor-associated macrophages (TAM), and CD206hi TAMs. b Mean fluorescence intensity (MFI) of CD86 and PD-L1 levels expressed on CD45+CD11b+ TAMs from control (NT, open bar) or DMXAA [450 μg] (black bar) treated mice. Values are mean ± SD, n = 6 mice per group. *, P ≤ 0.05; **, P ≤ 0.01. c Cultured bone marrow-derived macrophages were untreated or treated for 18 h with 20 μg/ml DMXAA. Histograms from representative flow cytometry analyses for CD80, CD86, CD40, MHC class I, PD-L1 and CD206 expression on bone marrow-derived macrophages from non-treated (black line) DMXAA-treated (black area) and compared against unstained cells (gray dotted lines). d, e Multiplex analyses of cytokine and chemokine production measured in conditioned medium from bone marrow-derived macrophages cultured 18 h in the presence (black bars) or absence (open bars) of 20 μg/mL DMXAA. Values are mean ± SD of two combined experiments. *, P ≤ 0.05; **, P ≤ 0.01; ***, P ≤ 0.001
Fig. 6
Fig. 6
STING agonist induces DC activation and maturation in vivo and in vitro. Tumors were harvested on day 19, digested and viable CD45+ immune cell subsets analyzed by flow cytometry. Co-stimulatory molecule CD86 expression on tumor-infiltrating MHC Class I expressing CD103+ (a) or CD11b+ (b) DC in non-treated controls (black lines or open bars) or DMXAA treated tumors (shaded gray histograms or black bars). Values are mean ± SD, n = 8–9 mice per group. ***, P ≤ 0.001; ****, P ≤ 0.0001. Cytokines (c), CC-family chemokines (d) or CXC-family chemokines (e) were measured in conditioned medium from bone marrow-derived DCs cultured 18 h in the presence (black bars) or absence (open bars) of 20 μg/mL DMXAA. Data are representative of two experiments. *, P ≤ 0.05; **, P ≤ 0.01; ***, P ≤ 0.001; **** P ≤ 0.0001
Fig. 7
Fig. 7
Pancreatic cancer epithelial cells are activated by STING agonist. a KPC1242 cells were stimulated with 10 μg/mL gemcitabine (GEM) alone, with GEM with 100 μg/mL DMXAA, DMXAA alone, 1 μg/mL lipopolysaccharide (LPS) as a positive control, or a vehicle negative control. Protein lysates were analyzed with antibodies to (a) phospho-STAT6 (pSTAT6), total STAT6 or GAPDH. b phospho-TBK1, total TBK1, or GAPDH, (c) phosphoIRF-3, total IRF-3 or GAPDH. Blots were probed with antibody against GAPDH as a loading control. Immunoblots were quantitated and represented graphically below each respective blot. d KPC1242 cells were incubated with GEM alone, GEM plus DMXAA, DMXAA alone, LPS alone, or vehicle control and apoptosis (d) and cell growth (e) measured. **, P ≤ 0.01; ****, P ≤ 0.0001. Values are mean ± SD, n = 4
Fig. 8
Fig. 8
STING agonist stimulates T cell chemokine expression. Conditioned medium from KPC1242 cells that had been stimulated with GEM alone, 10 μg/mL GEM plus 100 μg/mL DMXAA, DMXAA alone, or vehicle as a control were analyzed by MultiPlex or ELISA. Cytokine a and chemokine (b) levels in conditioned medium from treated and control cells. Data are triplicate means from a representative of 3 independent analyses. c, d CXCL10 and CCL20 chemokine levels measured by ELISA. Data are mean ± SD, n = 4 biological replicates completed in triplicate. ****, P ≤ 0.0001

Similar articles

Cited by

References

    1. Miller KD, Siegel RL, Lin CC, Mariotto AB, Kramer JL, Rowland JH, Stein KD, Alteri R, Jemal A. Cancer treatment and survivorship statistics, 2016. CA Cancer J Clin. 2016;66(4):271–289. - PubMed
    1. Siegel RL, Miller KD, Jemal A. Cancer statistics, 2018. CA Cancer J Clin. 2018;68(1):7–30. - PubMed
    1. Spanknebel K, Conlon KC. Advances in the surgical management of pancreatic cancer. Cancer J. 2001;7(4):312–323. - PubMed
    1. Beatty GL, Winograd R, Evans RA, Long KB, Luque SL, Lee JW, Clendenin C, Gladney WL, Knoblock DM, Guirnalda PD, et al. Exclusion of T cells from pancreatic carcinomas in mice is regulated by Ly6C(low) F4/80(+) Extratumoral macrophages. Gastroenterology. 2015;149(1):201–210. - PMC - PubMed
    1. Dangi-Garimella S, Sahai V, Ebine K, Kumar K, Munshi HG. Three-dimensional collagen I promotes gemcitabine resistance in vitro in pancreatic cancer cells through HMGA2-dependent histone acetyltransferase expression. PLoS One. 2013;8(5):e64566. - PMC - PubMed

Publication types

MeSH terms