. 2019 May 14;116(20):10031-10038.
doi: 10.1073/pnas.1901659116. Epub 2019 Apr 29.

Pleiotropic neuroprotective effects of taxifolin in cerebral amyloid angiopathy

Affiliations

Pleiotropic neuroprotective effects of taxifolin in cerebral amyloid angiopathy

Takayuki Inoue et al. Proc Natl Acad Sci U S A. .

Abstract

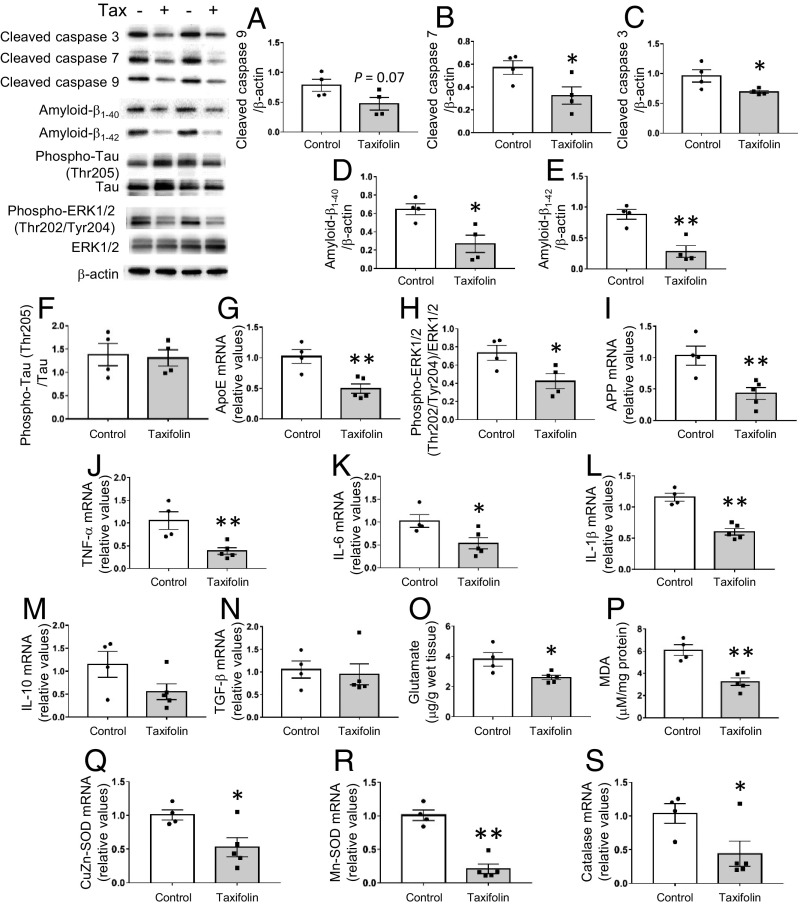
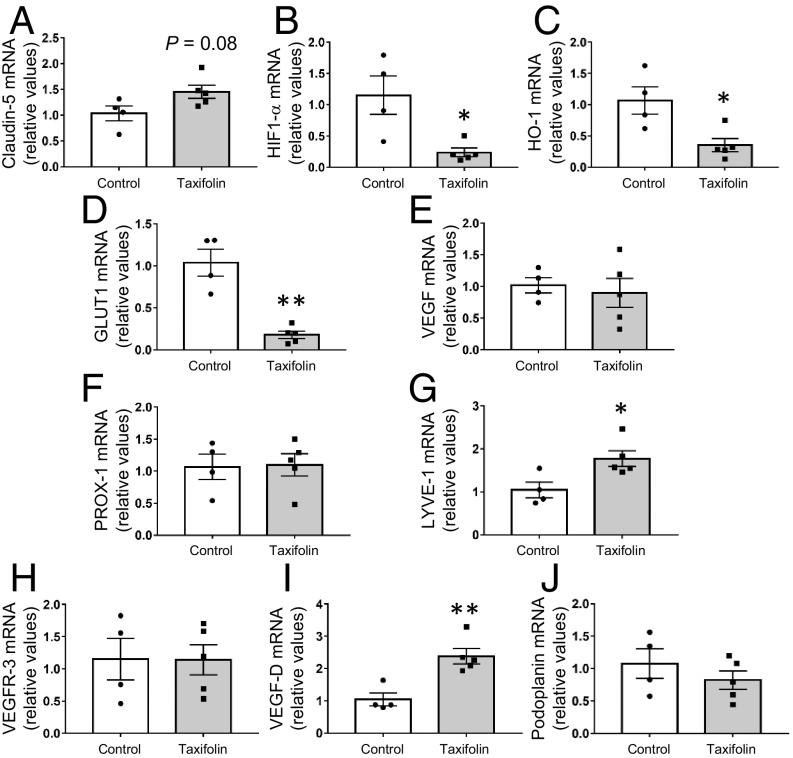
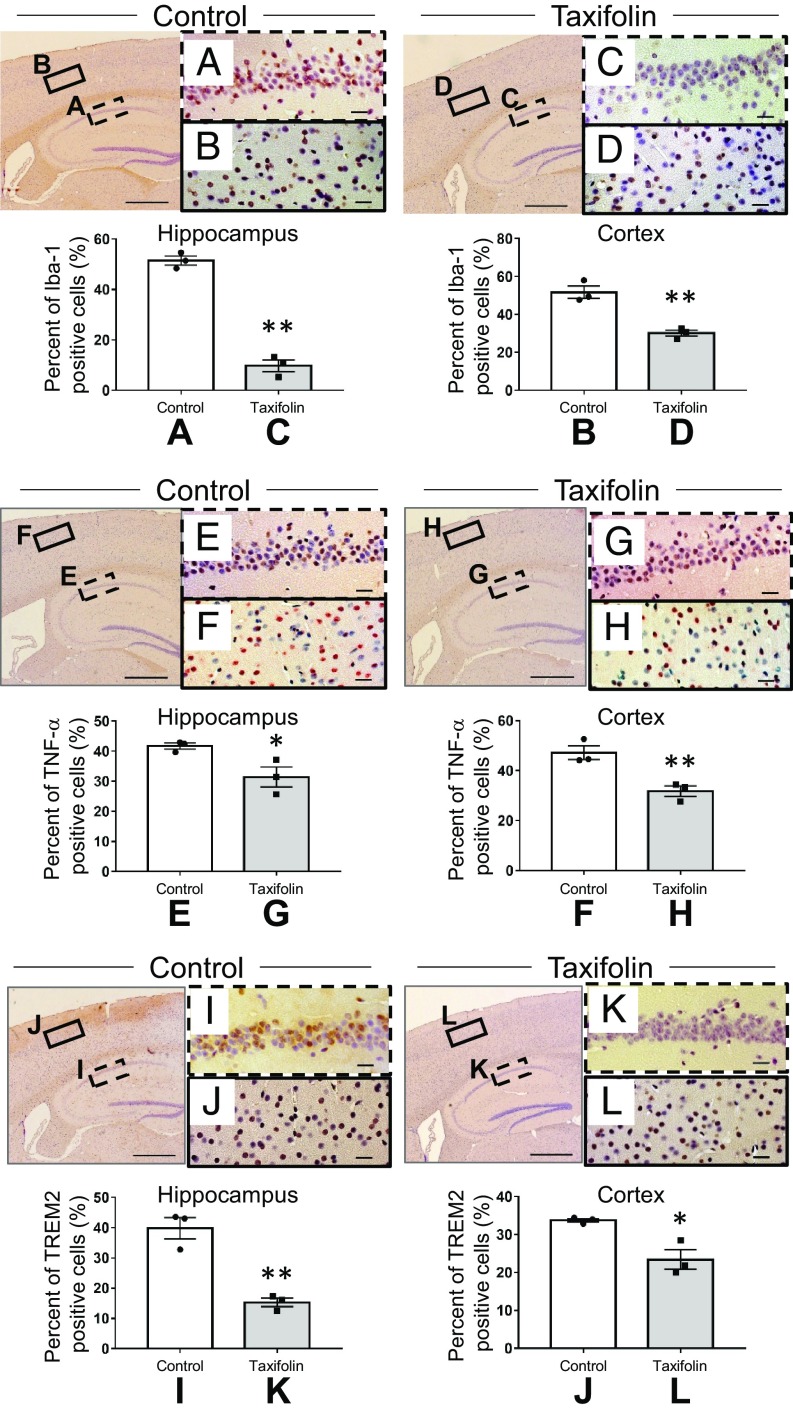
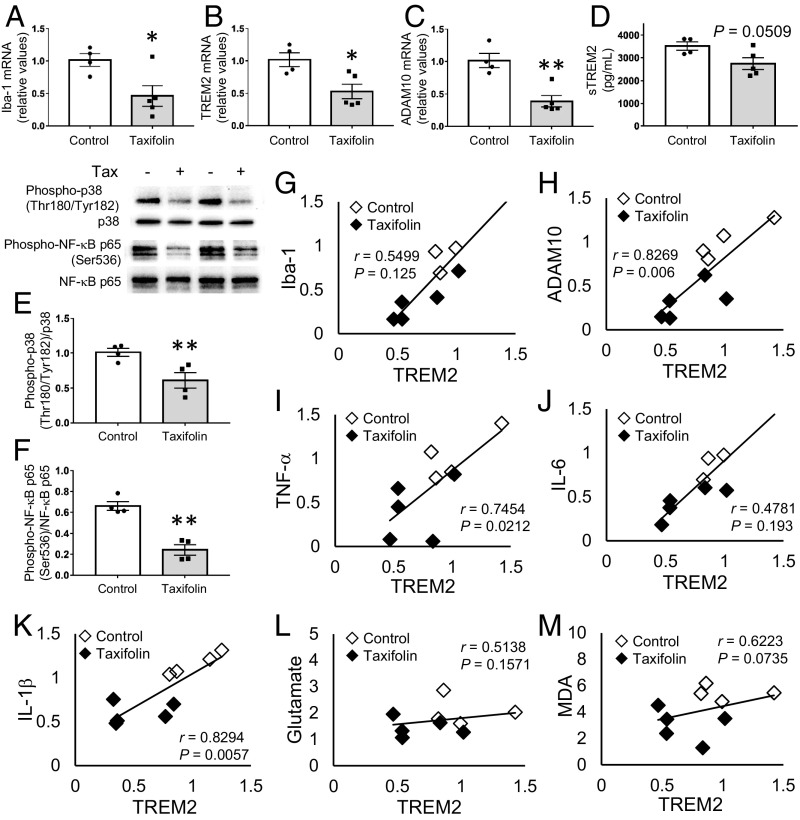
Cerebral amyloid angiopathy (CAA) results from amyloid-β deposition in the cerebrovasculature. It is frequently accompanied by Alzheimer's disease and causes dementia. We recently demonstrated that in a mouse model of CAA, taxifolin improved cerebral blood flow, promoted amyloid-β removal from the brain, and prevented cognitive dysfunction when administered orally. Here we showed that taxifolin inhibited the intracerebral production of amyloid-β through suppressing the ApoE-ERK1/2-amyloid-β precursor protein axis, despite the low permeability of the blood-brain barrier to taxifolin. Higher expression levels of triggering receptor expressed on myeloid cell 2 (TREM2) were associated with the exacerbation of inflammation in the brain. Taxifolin suppressed inflammation, alleviating the accumulation of TREM2-expressing cells in the brain. It also mitigated glutamate levels and oxidative tissue damage and reduced brain levels of active caspases, indicative of apoptotic cell death. Thus, the oral administration of taxifolin had intracerebral pleiotropic neuroprotective effects on CAA through suppressing amyloid-β production and beneficially modulating proinflammatory microglial phenotypes.

Keywords: cerebral amyloid angiopathy; neuroprotection; taxifolin; triggering receptor expressed on myeloid cell 2.


Conflict of interest statement

The authors declare no conflict of interest.

Figures

Fig. 1.
Fig. 1.
Protective effects of taxifolin on brain cells in the hippocampus of Tg-SwDI mice. Each histogram compares values for the same 14-mo-old Tg-SwDI mice that received either the control diet (n = 4) or taxifolin-containing chow (n = 5) for 13 mo. Relative amounts were analyzed by Western blot and densitometry, and mRNA expression levels were obtained by quantitative RT-PCR and normalized to those of GAPDH. Upper Left shows representative immunoblots. (AC) Activation levels of the apoptosis-related caspases cleaved caspase-9 (A), cleaved caspase-7 (B), and cleaved caspase-3 (C) relative to β-actin. (DF) Accumulation of amyloid-β and hyperphosphorylated tau proteins in the hippocampal tissue: amyloid-β1–40 (D) and amyloid-β1–42 (E) relative to β-actin and phospho-tau (Thr205) relative to total tau (F). (GI) Activation levels of pathways involved in amyloid-β production in the hippocampal tissue: mRNA levels of ApoE (G) and APP (I) and the amount of phospho-ERK1/2 (Thr202/Tyr204) relative to total ERK (H). (JN) Expression levels of proinflammatory and antiinflammatory cytokines in the hippocampal tissue: mRNA levels of TNF-α (J), IL-6 (K), IL-1β (L), IL-10 (M), and TGF-β (N). (O) Glutamate levels in the hippocampal tissue. (P) Levels of free lipid peroxides, MDA, in the hippocampal tissue. (QS) Expression levels of oxidative stress-responsive genes in the hippocampal tissue: mRNA levels of CuZn-SOD (Q), Mn-SOD (R), and catalase (S). Data are expressed as mean ± SEM (control, n = 4; taxifolin, n = 5). P values were determined by Student’s t test. *P < 0.05; **P < 0.01.
Fig. 2.
Fig. 2.
Effects of taxifolin on expression levels of blood and lymphatic vasculature-related or hypoxia-responsive genes in the hippocampus of Tg-SwDI mice. Each histogram compares values for the same 14-mo-old Tg-SwDI mice that received either the control diet (n = 4) or taxifolin-containing chow (n = 5) for 13 mo. mRNA levels were analyzed by quantitative RT-PCR and normalized to GAPDH. (A) Expression levels of tight-junction–related cerebrovascular endothelial marker, claudin-5, in the hippocampal tissue. (BE) mRNA expression levels of hypoxia-responsive genes in the hippocampal tissue: HIF-1α (B), HO-1 (C), GLUT1 (D), and VEGF (E). (FJ) Gene mRNA expression levels of markers for lymphatic endothelial cells in the hippocampal tissue: PROX-1 (F), LYVE-1 (G), VEGFR-3 (H), VEGF-D (I), and podoplanin (J). Data are expressed as mean ± SEM (control, n = 4; taxifolin, n = 5). P values were determined by Student’s t test. *P < 0.05; **P < 0.01.
Fig. 3.
Fig. 3.
Effects of taxifolin on the accumulation of cells expressing Iba-1, TNF-α, or TREM2 in the hippocampus or cortex of Tg-SwDI mice. The histograms and representative images are for Tg-SwDI mice that received the control diet (control group, n = 3) or chow containing taxifolin (taxifolin group, n = 3) for 7 mo. The various cells were detected immunohistochemically, and the total cells were visualized by counterstaining with hematoxylin. Representative images are shown for the control group (Left) and taxifolin group (Right). [Scale bars, 500 μm for the low-power field (Left) and 20 μm for the high-power field (Right).] The proportion of positive cells was obtained by dividing the number of immunohistochemically positive cells by the total number of cells. (AD) Immunohistochemical analyses of Iba-1–expressing cells in the hippocampus (A and C) and cortex (B and D) of the control group (A and B) and taxifolin group (C and D). (EH) Immunohistochemical analyses of TNF-α–positive cells in the hippocampus (E and G) and cortex (F and H) of the control group (E and F) and taxifolin group (G and H) (n = 3). (IL) Immunohistochemical analyses of cells positive for TREM2 in the hippocampus (I and K) and cortex (J and L) of the control group (I and J) and taxifolin group (K and L). Data are expressed as mean ± SEM (control, n = 3; taxifolin, n = 3). P values were determined by Student’s t test. *P < 0.05; **P < 0.01.
Fig. 4.
Fig. 4.
Beneficial effects of taxifolin on proinflammatory phenotypes of microglia in the hippocampus of Tg-SwDI mice. The histograms and graphs show results for the hippocampal tissue of 14-wk-old Tg-SwDI mice that received either the control diet (n = 4) or chow containing taxifolin (n = 5) for 13 mo. mRNA expression levels were measured by quantitative RT-PCR and normalized to GAPDH. (AC) Hippocampal mRNA expression levels of Iba-1 (A), TREM2 (B), and ADAM10 (C). (D) Concentration of sTREM2. (E and F) Activation levels of proinflammatory signaling pathways. The relative amounts of phospho-p38 (Thr180/Tyr182) to total p38 (E) and phospho-NF-κB p65 (Ser536) to total NF-κB p65 (F) were determined by Western blot and densitometry. Representative images are shown at the Upper Left. (GM) Relationships between expression levels of TREM2 and levels of Iba-1 (G), ADAM10 (H), TNF-α (I), IL-6 (J), IL-1β (K), glutamate (L), and lipid peroxidation (M) in the hippocampal tissue. In AF, data are expressed as mean ± SEM (control, n = 4; taxifolin, n = 5); P values were determined by Student’s t test; *P < 0.05; **P < 0.01. In GM, Pearson’s correlation coefficients (r) were used to test the associations of interest.

Similar articles

Cited by

References

    1. Saito S, Yamamoto Y, Ihara M (2015) Mild cognitive impairment: At the crossroad of neurodegeneration and vascular dysfunction. Curr Alzheimer Res 12:507–512. - PubMed
    1. Charidimou A, et al. (2017) Emerging concepts in sporadic cerebral amyloid angiopathy. Brain 140:1829–1850. - PMC - PubMed
    1. Saito S, et al. (2017) Taxifolin inhibits amyloid-β oligomer formation and fully restores vascular integrity and memory in cerebral amyloid angiopathy. Acta Neuropathol Commun 5:26. - PMC - PubMed
    1. Yang P, et al. (2016) Detection of 191 taxifolin metabolites and their distribution in rats using HPLC-ESI-IT-TOF-MS(n). Molecules 21:E1209. - PMC - PubMed
    1. Booth AN, Deeds F (1958) The toxicity and metabolism of dihydroquercetin. J Am Pharm Assoc Am Pharm Assoc 47:183–184. - PubMed

Publication types

MeSH terms

LinkOut - more resources