. 2019 May 14;116(20):9764-9769.
doi: 10.1073/pnas.1821015116. Epub 2019 Apr 29.

Economic resilience of Carthage during the Punic Wars: Insights from sediments of the Medjerda delta around Utica (Tunisia)

Affiliations

Economic resilience of Carthage during the Punic Wars: Insights from sediments of the Medjerda delta around Utica (Tunisia)

Hugo Delile et al. Proc Natl Acad Sci U S A. .

Abstract

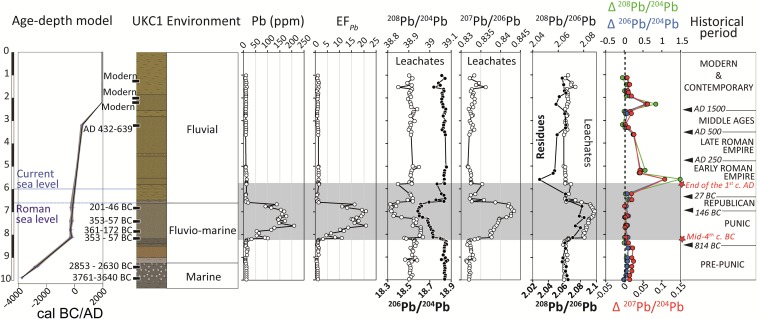
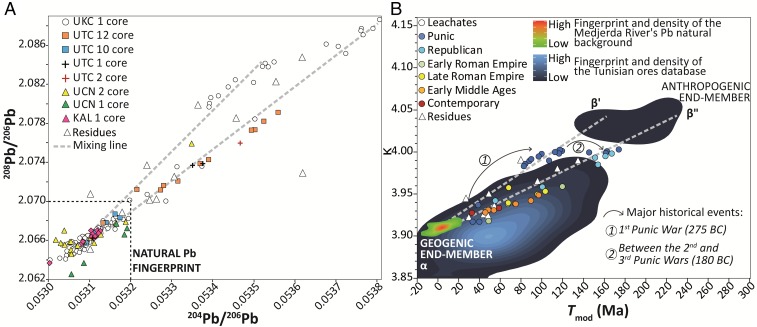
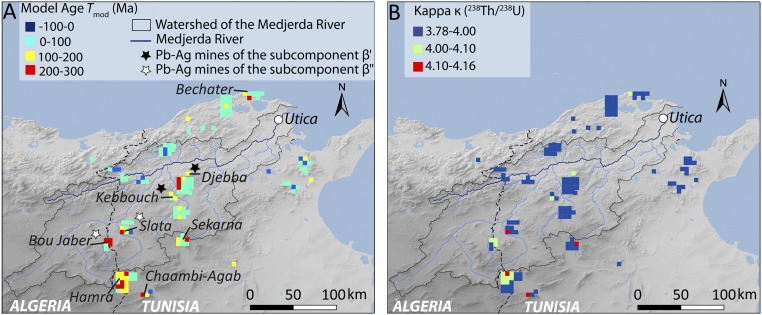
While the Punic Wars (264-146 BC) have been the subject of numerous studies, generally focused on their most sensational aspects (major battles, techniques of warfare, geopolitical strategies, etc.), curiously, the exceptional economic resilience of the Carthaginians in the face of successive defeats, loss of mining territory, and the imposition of war reparations has attracted hardly any attention. Here, we address this issue using a newly developed powerful tracer in geoarchaeology, that of Pb isotopes applied to paleopollution. We measured the Pb isotopic compositions of a well-dated suite of eight deep cores taken in the Medjerda delta around the city of Utica. The data provide robust evidence of ancient lead-silver mining in Tunisia and lay out a chronology for its exploitation, which appears to follow the main periods of geopolitical instability at the time: the Greco-Punic Wars (480-307 BC) and the Punic Wars (264-146 BC). During the last conflict, the data further suggest that Carthage was still able to pay indemnities and fund armies despite the loss of its traditional silver sources in the Mediterranean. This work shows that the mining of Tunisian metalliferous ores between the second half of the fourth and the beginning of the third century BC contributed to the emergence of Punic coinage and the development of the Carthaginian economy.

Keywords: Medjerda river; Punic Wars; Utica; mining resources; paleopollution.


Figures

Fig. 1.
Fig. 1.
Stratigraphic log of reference core UKC1 showing the paleoenvironmental successions, current (22) and Roman (48) sea levels, and the 14C age-depth model of core UKC1 constructed using the Clam software (47) on 10 radiocarbon dates (shown with black labels on the stratigraphic log). From this age-depth model are derived both the historical time slice boundaries (indicated with black arrowheads) and the time interval of anthropogenic lead pollution highlighted by the gray band and red stars. This figure shows the Pb concentrations (in ppm); the Pb enrichment factor (EFPb); down-core variations of 208Pb/204Pb, 206Pb/204Pb, 207Pb/206Pb, and 208Pb/206Pb for leachates; 208Pb/206Pb for residues; and ΔPb (the isotopic contrast between residue and leachate) of 208Pb/204Pb, 206Pb/204Pb, and 207Pb/204Pb.
Fig. 2.
Fig. 2.
(A) Plot of 204Pb/206Pb and 208Pb/206Pb for leachates from all eight cores and for residues (white triangles) from cores UKC1 and UTC12. (B) Similar plot using the geochemically informed parameters Tmod and κ for leachates (colored circles) from all eight cores and for residues (white triangles) from UKC1 and UTC12. Colors of leachates refer to the major historical periods. The two mixing lines (gray dashes) connect α and β′, and α and β″. The α end-member corresponds to the local geogenic Pb fingerprint (unpolluted water), whereas the β end-member corresponds to the anthropogenic component, which, in turn, exhibits two distinct Tunisian Pb-Ag mining clusters, β′ and β″. References for the Pb isotope database (n = 163) of the Tunisian ores are given in SI Appendix, Supplementary Text.
Fig. 3.
Fig. 3.
Map of the Pb isotope database (n = 135; see SI Appendix, Supplementary Text for references) of Tunisian metal ores (mainly galena) represented as a function of the Tmod (A) and κ (B) parameters. The Pb-Ag mining districts shown with black and white stars (A) caused the Pb pollution recorded in the sediment cores because they (i) form the subcomponents β' and β″ (Fig. 3), respectively, and (ii) are located inside the Medjerda catchment (unlike the mining districts of Hamra, Chaamb-Agab, and Sekarna, whose Pb isotopic signatures also are similar to those of component β). The cores of the present study are located around Utica (white circle).

Similar articles

Cited by

References

    1. Le Bohec Y. Histoire militaire des guerres puniques. Rocher; Monaco: 1995.
    1. Hoyos BD, editor. A Companion to the Punic Wars. Wiley-Blackwell; Chichester, UK: 2011.
    1. Frank T, editor. An Economic Survey of Ancient Rome. Johns Hopkins Univ Press; Baltimore: 1933.
    1. Kay P. Rome’s Economic Revolution. Oxford Univ Press; Oxford: 2014.
    1. McConnell JR, et al. Lead pollution recorded in Greenland ice indicates European emissions tracked plagues, wars, and imperial expansion during antiquity. Proc Natl Acad Sci USA. 2018;115:5726–5731. - PMC - PubMed

Publication types

LinkOut - more resources