. 2019 May 14;116(20):10048-10057.
doi: 10.1073/pnas.1900931116. Epub 2019 Apr 29.

Structure of the Ty3/Gypsy retrotransposon capsid and the evolution of retroviruses

Affiliations

Structure of the Ty3/Gypsy retrotransposon capsid and the evolution of retroviruses

Svetlana O Dodonova et al. Proc Natl Acad Sci U S A. .

Abstract

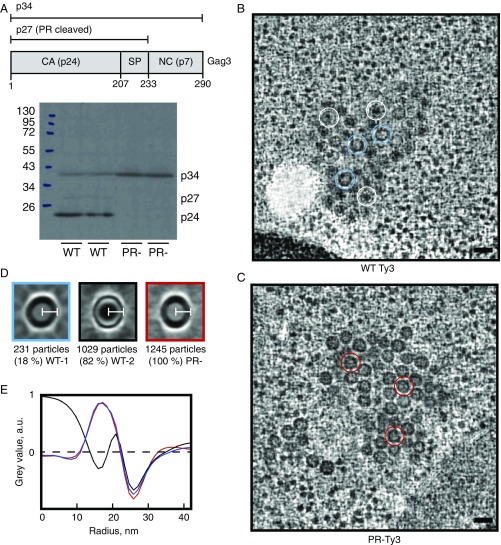
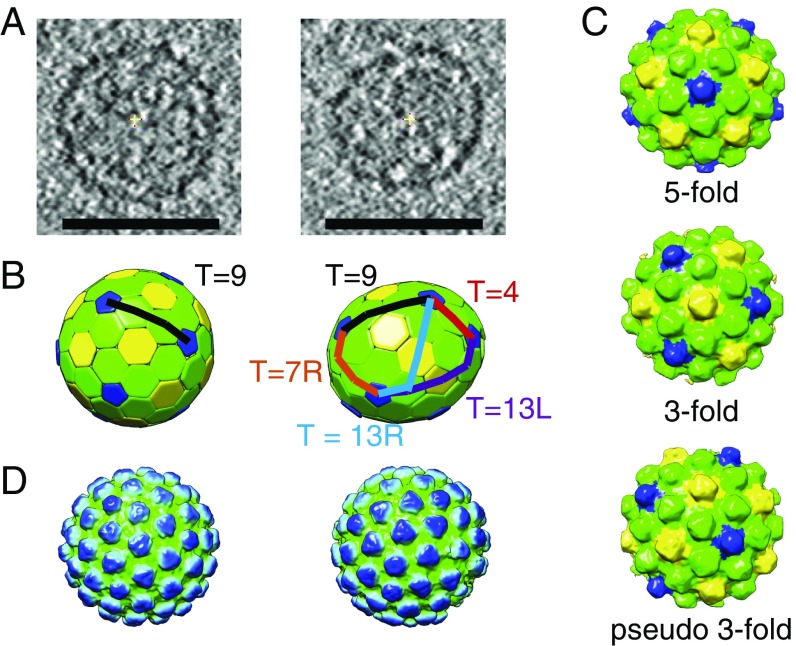
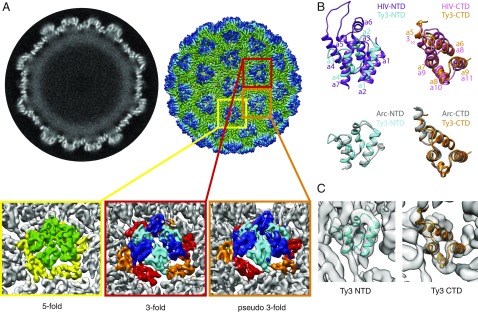
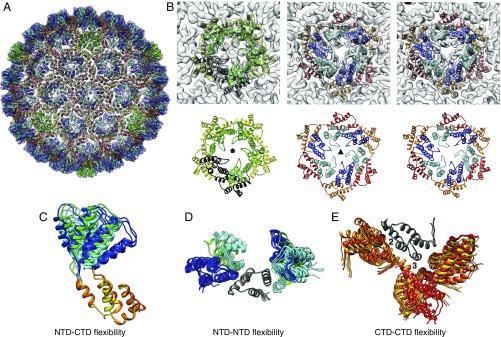
Retroviruses evolved from long terminal repeat (LTR) retrotransposons by acquisition of envelope functions, and subsequently reinvaded host genomes. Together, endogenous retroviruses and LTR retrotransposons represent major components of animal, plant, and fungal genomes. Sequences from these elements have been exapted to perform essential host functions, including placental development, synaptic communication, and transcriptional regulation. They encode a Gag polypeptide, the capsid domains of which can oligomerize to form a virus-like particle. The structures of retroviral capsids have been extensively described. They assemble an immature viral particle through oligomerization of full-length Gag. Proteolytic cleavage of Gag results in a mature, infectious particle. In contrast, the absence of structural data on LTR retrotransposon capsids hinders our understanding of their function and evolutionary relationships. Here, we report the capsid morphology and structure of the archetypal Gypsy retrotransposon Ty3. We performed electron tomography (ET) of immature and mature Ty3 particles within cells. We found that, in contrast to retroviruses, these do not change size or shape upon maturation. Cryo-ET and cryo-electron microscopy of purified, immature Ty3 particles revealed an irregular fullerene geometry previously described for mature retrovirus core particles and a tertiary and quaternary arrangement of the capsid (CA) C-terminal domain within the assembled capsid that is conserved with mature HIV-1. These findings provide a structural basis for studying retrotransposon capsids, including those domesticated in higher organisms. They suggest that assembly via a structurally distinct immature capsid is a later retroviral adaptation, while the structure of mature assembled capsids is conserved between LTR retrotransposons and retroviruses.

Keywords: Gag; LTR retrotransposon; capsid; maturation; retrovirus.


Conflict of interest statement

The authors declare no conflict of interest.

Figures

Fig. 1.
Fig. 1.
WT and PR- Ty3 particle morphology. (A) Schematic Ty3 Gag3 polyprotein showing regions corresponding to p34 (aa 1–290), p27 (aa 1–233), and CA p24 (aa 1–207). Western blot analysis of yeast cells expressing WT or PR- Ty3. Note that Gag3 (p34) and its PR cleavage products (p27, p24) are known to migrate anomalously (41). (B) Slices through representative tomographic reconstructions of resin-embedded yeast cells containing WT Ty3 particles. Representative WT type 1 particles (thick-ring morphology) are marked with blue circles, and representative WT type 2 particles (thin ring morphology) are marked with white circles. (Scale bar, 50 nm.) (C) Slices through representative tomographic reconstructions of plastic-embedded yeast cells containing PR- Ty3 particles. Representative PR- particles are marked with red circles. Particles are homogeneous, and all have a thick-ring morphology. (Scale bar, 50 nm.) (D) Central slices through the particle averages for WT-1, WT-2, and PR- Ty3 populations. (White scale bars, 21 nm.) (E) Radial profiles through the particle averages. The WT-1 and PR- particles with immature-like morphology have the same radius and radial profile, while WT-2 particles with mature-like morphology have the same radius but a different radial profile.
Fig. 2.
Fig. 2.
Cryo-ET of PR- Ty3 particles. (A) Slices through the tomographic reconstructions of purified, plunge-frozen PR- Ty3 particles (shown as an average of 10 computation slices). A regular icosahedral T = 9 particle (Left) and an irregular particle with a variable T-number (Right) are shown. (Scale bars, 50 nm.) (B) Ty3 lattice maps visualized by placing hexagons or pentagons at the positions of capsomers. Note the uniform distribution of pentamers in the T = 9 particle (Left) and the uneven distribution of pentamers in the other particle (Right). Vectors connecting neighboring fivefold positions are shown as lines, and local T-numbers are indicated. Fivefold positions are colored blue, threefold positions are colored yellow, and pseudothreefold positions are colored green. (C) Subtomogram averages of the fivefold, threefold, and pseudothreefold positions within the Ty3 PR- particles. Within each structure, the fivefold position is colored blue, the threefold positions is colored yellow, and the pseudothreefold position is colored green. (D) Composite representation of complete Ty3 particles, colored radially from green (low radius) to blue (high radius).
Fig. 3.
Fig. 3.
Cryo-EM reconstruction of a T = 9 PR- Ty3 particle. (A, Left) Slice through the center of the PR- Ty3 particle reconstruction resolved at 7.5 Å. The outer layer with distinct α-helical densities is the CA layer, and the fainter blurred layer underneath likely represents spacer, NC, and the associated genome. (A, Right) Three-dimensional reconstruction of a PR- Ty3 particle colored radially from green (low radius) to blue (high radius). (Insets) Close-up views of the fivefold (yellow box), threefold (red box), and pseudothreefold (orange box) positions. Within the positions with different symmetries, the densities are colored to indicate the different domains of CA: Fivefold CA-NTD is colored green, CA-CTD is colored yellow, threefold and pseudothreefold CA-NTD is colored cyan/blue in conformation A/B, and CA-CTD is colored orange/red in conformation A/B. (B) Ty3 CA-NTD (cyan) and Ty3 CA-CTD (orange) homology models are shown superimposed on the HIV CA-NTD (purple; PDB ID code 4XFX) and HIV CA-CTD (pink; PDB ID code 4XFX) structures (Upper, in which helices are numbered) and the templates used for homology modeling: Arc N-terminal lobe (gray; PDB ID code 4X3I) and Arc C-terminal lobe (gray; PDB ID code 4X3X), respectively (Lower). (C) Rigid body fitting of the Ty3 homology models of the CA-NTD (cyan) and CA-CTD (orange) into the Ty3 cryo-EM map.
Fig. 4.
Fig. 4.
Ty3 CA-NTD and CA-CTD at higher resolution. (A, Left) Structure of a Ty3 CA-CTD dimer at 4.9 Å generated by alignment and averaging of nine non–symmetry-related copies of the Ty3 CA-CTD. The homology models of the Ty3 CA domains have been flexibly fitted into the refined EM maps. Protein models are colored from blue (N terminus) to red (C terminus). The bulky side chains of F134, R135, W138, R157, and Y164 amino acids in the CA-CTD are colored pink. (A, Right) Close-up view of the very C-terminal part of the CA-CTD from the complete Ty3 particle map, which creates one of the contacts between two neighboring CA monomers in the particle lattice. (B) Structure of a CA-NTD dimer at 5.5 Å generated by alignment and averaging of four non–symmetry-related copies of the Ty3 CA-NTD dimer, colored as in A. (C) As in B, but shown at a lower isosurface level to illustrate the unoccupied densities in the refined EM map of the CA-NTD dimer. These represent the very N-terminal parts of the Ty3 CA-NTD. The N-terminal part of the CA-NTD is shown as a string of beads in cyan (conformation A) and blue (conformation B). In both conformations, the N-terminal part of the protein first runs outward along the inner interface between the CA-NTD helix 1 and helix 2 (C, Right). In conformation B, it then continues over the top of the CA-NTD and down the outer side of the threefold position (C, Left).
Fig. 5.
Fig. 5.
Variability of Ty3 CA-NTD and CA-CTD relative orientations. (A) Model of a complete Ty3 PR- particle showing fitted protein models and EM density (transparent gray). Proteins are colored as in Fig. 3. (B) Close-up views of the different positions within the Ty3 particle. One monomer in a fivefold position is highlighted in black for clarity. (C) Superimposition of the nine independent copies of CA showing the large relative movements of the CA-NTD and CA-CTD about the flexible interdomain linker. The CA-CTD was used for alignment of the structures. (D) Superimposition of the nine independent copies of CA-NTD, together with their neighbors, showing three distinct relative orientations aligned on one CA-CTD (gray). (E) Superimposition of the nine independent copies of CA-CTD, together with their neighbors, aligned on one CA-CTD (gray), illustrating continuous variability of the dimer and trimer CA CTD–CTD interfaces.
Fig. 6.
Fig. 6.
Structural comparison of the Ty3 and HIV capsid arrangements. (A) Superimposition of the Ty3 CA domains (red) and HIV-1 CA domains (blue). The α-helices are numbered. (B) Comparison of the fivefold CA-CTD quaternary structure of PR- Ty3 (Left) and mature HIV-1 (PDB ID code 3P05) (Center), and superposition of the two (Right). Note the high similarity of the arrangements. (C) Comparison of the dimeric CA-CTD arrangement of PR- Ty3 and mature HIV-1 (PDB ID code 4XFX). (D) Comparison of the trimeric CA-CTD arrangement of PR- Ty3 and mature HIV-1 (PDB ID code 4XFX).

Similar articles

Cited by

References

    1. Sandmeyer S, Patterson K, Bilanchone V. Ty3, a position-specific retrotransposon in budding yeast. Microbiol Spectr. 2015;3:MDNA3-0057-2014. - PubMed
    1. Curcio MJ, Lutz S, Lesage P. The Ty1 LTR-retrotransposon of budding yeast, Saccharomyces cerevisiae. Microbiol Spectr. 2015;3:MDNA3-0053-2014. - PubMed
    1. de la Chaux N, Wagner A. BEL/Pao retrotransposons in metazoan genomes. BMC Evol Biol. 2011;11:154. - PMC - PubMed
    1. Krupovic M, et al. Ortervirales: New virus order unifying five families of reverse-transcribing viruses. J Virol. 2018;92:e00515-18. - PMC - PubMed
    1. Llorens C, Fares MA, Moya A. Relationships of gag-pol diversity between Ty3/Gypsy and retroviridae LTR retroelements and the three kings hypothesis. BMC Evol Biol. 2008;8:276. - PMC - PubMed

Publication types