. 2019 Jun 19;39(25):4986-4998.
doi: 10.1523/JNEUROSCI.0305-19.2019. Epub 2019 Apr 29.

Dynamic Network Activation of Hypothalamic MCH Neurons in REM Sleep and Exploratory Behavior

Affiliations

Dynamic Network Activation of Hypothalamic MCH Neurons in REM Sleep and Exploratory Behavior

Carlos Blanco-Centurion et al. J Neurosci. .

Abstract

Most brain neurons are active in waking, but hypothalamic neurons that synthesize the neuropeptide melanin-concentrating hormone (MCH) are claimed to be active only during sleep, particularly rapid eye movement (REM) sleep. Here we use deep-brain imaging to identify changes in fluorescence of the genetically encoded calcium (Ca2+) indicator GCaMP6 in individual hypothalamic neurons that contain MCH. An in vitro electrophysiology study determined a strong relationship between depolarization and Ca2+ fluorescence in MCH neurons. In 10 freely behaving MCH-cre mice (male and female), the highest fluorescence occurred in all recorded neurons (n = 106) in REM sleep relative to quiet waking or non-REM sleep. Unexpectedly, 70% of the MCH neurons had strong fluorescence activity when the mice explored novel objects. Spatial and temporal mapping of the change in fluorescence between pairs of MCH neurons revealed dynamic activation of MCH neurons during REM sleep and activation of a subset of the same neurons during exploratory behavior. Functional network activity maps will facilitate comparisons of not only single-neuron activity, but also network responses in different conditions and disease.SIGNIFICANCE STATEMENT Functional activity maps identify brain circuits responding to specific behaviors, including rapid eye movement sleep (REM sleep), a sleep phase when the brain is as active as in waking. To provide the first activity map of individual neurons during REM sleep, we use deep-brain calcium imaging in unrestrained mice to map the activity of hypothalamic melanin-concentrating hormone (MCH) neurons. MCH neurons were found to be synchronously active during REM sleep, and also during the exploration of novel objects. Spatial mapping revealed dynamic network activation during REM sleep and activation of a subset of the neurons during exploratory behavior. Functional activity maps at the cellular level in specific behaviors, including sleep, are needed to establish a brain connectome.

Keywords: REM sleep; calcium imaging; hypothalamus; melanin concentrating hormone; sleep.


Figures

Figure 1.
Figure 1.
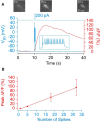
In vitro slice electrophysiology determines that GCaMP6s fluorescence is linearly related to the number of action potentials. A, An In vitro slice electrophysiology experiment confirmed that increased GCaMP6 fluorescence (ΔF/F), indicative of increased Ca2+, was associated with depolarization and subsequent spike activity in GCaMP6s-expressing MCH neurons. Red trace shows increased GCaMP6 fluorescence (middle and right images, acquired at 15 and 40 s, respectively, vs left image, acquired at 0 s) following a spike train (blue trace) evoked by a 0.5 s injection (via the patch pipette) of depolarizing current (200 pA) in a GCaMP6s-expressing MCH neuron recorded in the whole-cell configuration in an MCH-Cre mouse brain slice. Individual spikes within the spike train are shown at higher temporal resolution in the boxed inset. In six MCH neurons (from four mice) imaged and recorded simultaneously, ΔF/F increased by 49.5 ± 18.7% (mean ± SEM) following a 0.5 s injection of 283 ± 124 pA of current that evoked a depolarization of 30.5 ± 4.5 mV from a resting membrane potential of −74.2 ± 4.7 mV and resulted in 18 ± 6 spikes (range, 2–37 spikes) with an amplitude (first spike) of 73.4 ± 7.3 mV. ΔF/F (%), fluorescence at time t (F(t)) − baseline fluorescence (F, averaged fluorescence in the 10 s period before current injection), divided by F and multiplied by 100, after the subtraction of background fluorescence (fluorescence from a cell-free region); Vm, membrane potential. B, The plot shows the peak change in GCaMP6 fluorescence as a function of the number of spikes. Data points (left to right) are the mean ± SEM. values of peak ΔF/F (%) obtained from six MCH neurons (from four mice) following 10 ms, 100 ms, 0.5 s, and 1 s injections of depolarizing current that evoked 1 ± 0, 5 ± 1, 18 ± 6, and 32 ± 12 spikes, respectively.
Figure 2.
Figure 2.
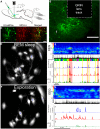
Deep-brain imaging of MCH neurons. A, Schematic of transfection of MCH neurons in MCH-Cre mice with AAV-DIO-GCaMP6 followed by placement of the GRIN lens in region transfected with GCaMP6 (slow or medium). The miniscope is attached to the GRIN lens via a baseplate on the skull. B, Photomicrograph depicts the location of the GRIN lens (outlined in dashed lines) atop the body of GCaMP6s containing neurons in the hypothalamus in a representative MCH-Cre mouse. The brain region containing the GRIN lens was sectioned along the coronal axis of the brain, and tissue containing the GCaMP6s neurons were identified. f, Fornix. Scale bar, 300 μm. C, Immunohistochemistry revealed that GCaMP6s-infected neurons (green) were also immunopositive for MCH. The coronal sections were incubated with the MCH antibody and visualized using a Leica confocal microscope. Scale bar, 80 μm. D, The field of view of the GRIN lens with fluorescence (ΔF/F0) in somata and processes during REM sleep in neurons extracted automatically by PCA-ICA analysis. We have labeled the three neurons (labeled 1, 2, and 3) whose Ca2+ fluorescence is plotted in E. E, GCaMP6s fluorescence (ΔF/F0) in MCH neurons is associated with REM sleep. Ca2+ imaging was performed simultaneously with recording of cortical EEG and EMG activity in the nuchal muscles. Behavioral video recordings were obtained and examined to identify behaviors such as walking, eating, grooming, or eating. Activity in the EEG (depicted as power spectra, 0.3–15 Hz) and the EMG is used to identify wake, NREM, and REM sleep states (labeled as hypnogram). The traces depict the change in fluorescence (ΔF/F) during wake–sleep bouts of the three neurons identified in D. In each neuron, the ΔF/F0 (expressed as a z-score) varies with the wake–sleep state of the animal, with peak fluorescence associated with REM sleep. The hypnogram categorizes the sleep–wake states in the following colors: purple, active wake; blue, quiet wake; green, NREM; yellow, pre-REM sleep; red, REM sleep. F, The same field of view as in D, but this image shows the PCA-ICA extracted neurons (ΔF/F0) while the mouse was engaged in exploring novel objects placed in its home cage. This image shows that some neurons that were evident in REM sleep (D) were also activated during exploratory behavior. However, some neurons in D were not evident during exploratory behavior, indicating selective activation of these neurons during REM sleep (D). Thirty percent of the neurons were activated during REM sleep but not during exploratory behavior, indicating that a subset of MCH neurons is selectively active in REM sleep. G, GCaMP6s fluorescence in MCH neurons while exploring novel objects. The traces are from the same neurons represented in REM sleep (E). Note that the GCaMP6s has a rapid response and a slow rate of decay, which makes it difficult to infer whether the imaged neuron fired as single spikes or in clusters.
Figure 3.
Figure 3.
Average fluorescence (ΔF/F0) in MCH neurons is highest during REM sleep and exploratory behavior. A, Average change in fluorescence (ΔF/F0 expressed as z-scores) in MCH neurons across wake–sleep states and wake behaviors in MCH-Cre mice. A total of 107 distinct neurons in 10 MCH-Cre transgenic mice was extracted automatically by the Mosaic software (Inscopix). Fluorescence in one neuron was twofold higher during REM sleep compared with the next data point, and it was excluded from the data analysis. Each data point represents the average fluorescence (z-score) of individual neurons in samples taken during the specific sleep–wake behavior. Table 1 summarizes the number of neurons recorded in each of the 10 mice. Table 1 also summarizes the number and length of the samples for each sleep–wake behavior represented in the bar graph. Each box in the bar graph summarizes mean and SE, and depicts data points representing individual neurons. The number of MCH neurons represented in each bar is as follows: first four bars = 106; eat = 72; groom = 61; walk = 92; dig = 33; rear = 71; explore = 74. A GLMM design was used based on the correlation of the fluorescence data between the neurons, the skewed distribution of the data (failed Kolmogorov–Smirnov test for normality), and unbalanced design. Pairwise comparisons were made with the Bonferroni post hoc test (sequential adjusted). There was a significant increase in Ca2+ activity during REM sleep compared with quiet wake, NREM, and pre-REM sleep (p < 0.001). Fluorescence in pre-REM sleep was significantly higher than quiet wake or NREM (p < 0.001). When the mice engaged in behaviors involving gross locomotor activity (eat, groom, walk, or dig), the fluorescence was significantly lower compared with REM sleep. However, during rearing behavior or exploration of novel objects, the fluorescence was not significantly different from REM sleep. Thus, a subset of the MCH neurons (69.8%; 74 of 106 neurons) was also as active during exploratory behavior as in REM sleep. B, Time course of change in fluorescence (ΔF/F0, expressed as z-scores) during the transition from quiet wake (QW) to NREM to pre-REM to REM sleep to QW. The sleep and the imaging data were analyzed separately in a blind manner, and the two datasets were combined once PCA-ICA analysis had established the z-scores. The figure summarizes the average fluorescence of MCH neurons (n = 106) in 1.0 s epochs during the transition periods between sleep states. The fluorescence began to increase 30 s after the onset of NREM sleep and peaked midway into the REM sleep bout. The time course of increase in fluorescence during NREM and REM sleep is similar to the pattern of action potentials of MCH neurons (Hassani et al., 2009). In that study (Hassani et al., 2009), the rate of action potentials of single MCH neurons during REM sleep was 12 Hz. In the present study, Ca2+ fluorescence occurred in volleys during REM sleep indicating the high rate of activity of the underlying MCH neurons (Movie 1). The steady progression of the fluorescence suggests that optogenetic stimulation of the MCH neurons during NREM sleep should further depolarize the MCH neurons and increase NREM sleep, which it does in both mice and rats (Konadhode et al., 2013; Blanco-Centurion et al., 2016). Optogenetic stimulation during the pre-REM sleep period should trigger REM sleep, which it does (Jego et al., 2013). Stimulation during REM sleep should not prolong the REM sleep bout, which is also consistent with published data (Jego et al., 2013).
Figure 4.
Figure 4.
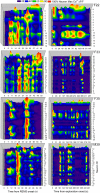
Fluorescence in MCH neurons occurs in synchronous volleys during REM sleep and exploratory behavior. To identify the temporal pattern of the fluorescence peaks across the MCH neurons, the Ca2+ traces (expressed as z-score) were plotted during individual bouts of REM sleep (left) and exploratory behavior (right). The spatial location of the neurons in the GRIN lens field of view is depicted in Figure 5. The four MCH-Cre mice with the most MCH neurons were plotted (Table 1). In the four mice, there were 84 of 106 neurons in REM sleep and 56 of 106 neurons in exploration. Each line represents the change in Ca2+ fluorescence (shown as a contour heat map with red indicating maximum) in individual neurons (y-axis) across time (x-axis; 1.0 s epochs) during REM sleep and exploratory behavior. In each animal, the neurons are sorted based on the strength of the correlation of fluorescence peaks between pairs of neurons during REM sleep; neurons with the most pairwise correlation are at the bottom. While this figure depicts the temporal relationship of fluorescence between neurons, Figure 5 depicts the spatial location of the neurons within the GRIN lens field of view. During exploratory behavior, a subset of MCH neurons was not activated, and the trace of the neurons does not appear in the right panel. There was high correlation in the change in fluorescence among the MCH neurons in each animal during REM sleep (r = 0.96, df = 15; r = 0.98, df = 25; r = 0.85, df = 21; r = 0.90, df = 23) vs exploratory behavior (r = 0.7, df = 11; r = 0.76, df = 16; r = 0.70, df = 13; r = 0.71, df = 16), indicating synchronous activity.
Figure 5.
Figure 5.
Spatial activation of MCH neurons during REM sleep and exploratory behavior. Spatial correlograms showing the relationship of the fluorescence between MCH neurons during REM sleep and exploratory behavior. The fluorescence data are from the same four mice depicted in Figure 4. Lines connecting neuronal pairs are colored to reflect the strength of the correlation coefficient (r = 0.6–1.0). The number of associations between pairs of neurons is denoted by the size of the neurons (larger diameter = more associations). Each panel depicts the extracted neurons in the field of view of the GRIN lens, with each neuron plotted along its x and y coordinates in the GRIN lens field of view. During REM sleep, there are more associations between MCH neurons indicating a more complete activation of the MCH neuronal network compared with exploratory condition (rank sum test). Such maps provide a heuristic basis for comparing network activation in two different conditions.

Similar articles

Cited by

References

    1. Aston-Jones G, Bloom FE (1981) Activity of norepinephrine-containing locus coeruleus neurons in behaving rats anticipates fluctuations in the sleep-waking cycle. J Neurosci 1:876–886. 10.1523/JNEUROSCI.01-08-00876.1981 - DOI - PMC - PubMed
    1. Bayguinov PO, Ma Y, Gao Y, Zhao X, Jackson MB (2017) Imaging voltage in genetically defined neuronal subpopulations with a cre recombinase-targeted hybrid voltage sensor. J Neurosci 37:9305–9319. 10.1523/JNEUROSCI.1363-17.2017 - DOI - PMC - PubMed
    1. Bittencourt JC, Presse F, Arias C, Peto C, Vaughan J, Nahon JL, Vale W, Sawchenko PE (1992) The melanin-concentrating hormone system of the rat brain: an immuno- and hybridization histochemical characterization. J Comp Neurol 319:218–245. 10.1002/cne.903190204 - DOI - PubMed
    1. Blanco-Centurion C, Liu M, Konadhode RP, Zhang X, Pelluru D, van den Pol AN, Shiromani PJ (2016) Optogenetic activation of melanin-concentrating hormone neurons increases non-rapid eye movement and rapid eye movement sleep during the night in rats. Eur J Neurosci 44:2846–2857. 10.1111/ejn.13410 - DOI - PMC - PubMed
    1. Chen KS, Xu M, Zhang Z, Chang WC, Gaj T, Schaffer DV, Dan Y (2018) A hypothalamic switch for REM and non-REM sleep. Neuron 97:1168–1176.e4. 10.1016/j.neuron.2018.02.005 - DOI - PubMed

Publication types

LinkOut - more resources