

Vitamin D in Wild and Farmed Atlantic Salmon (Salmo Salar)-What Do We Know?
- PMID: 31036792
- PMCID: PMC6566758
- DOI: 10.3390/nu11050982
Vitamin D in Wild and Farmed Atlantic Salmon (Salmo Salar)-What Do We Know?
Abstract
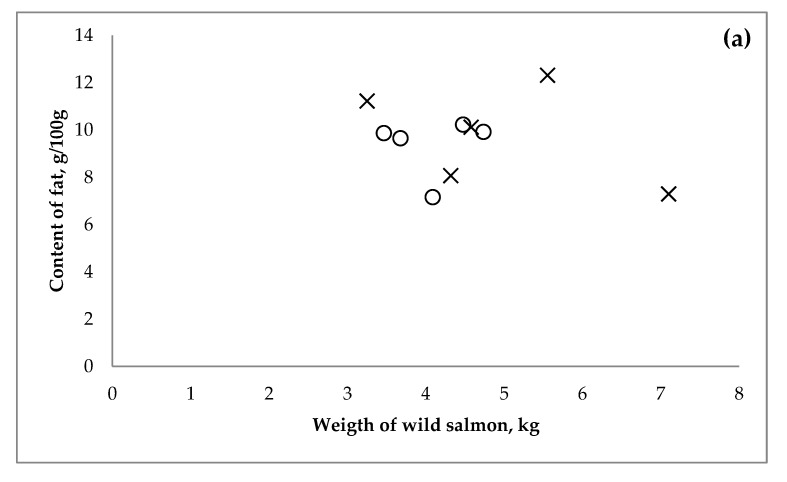
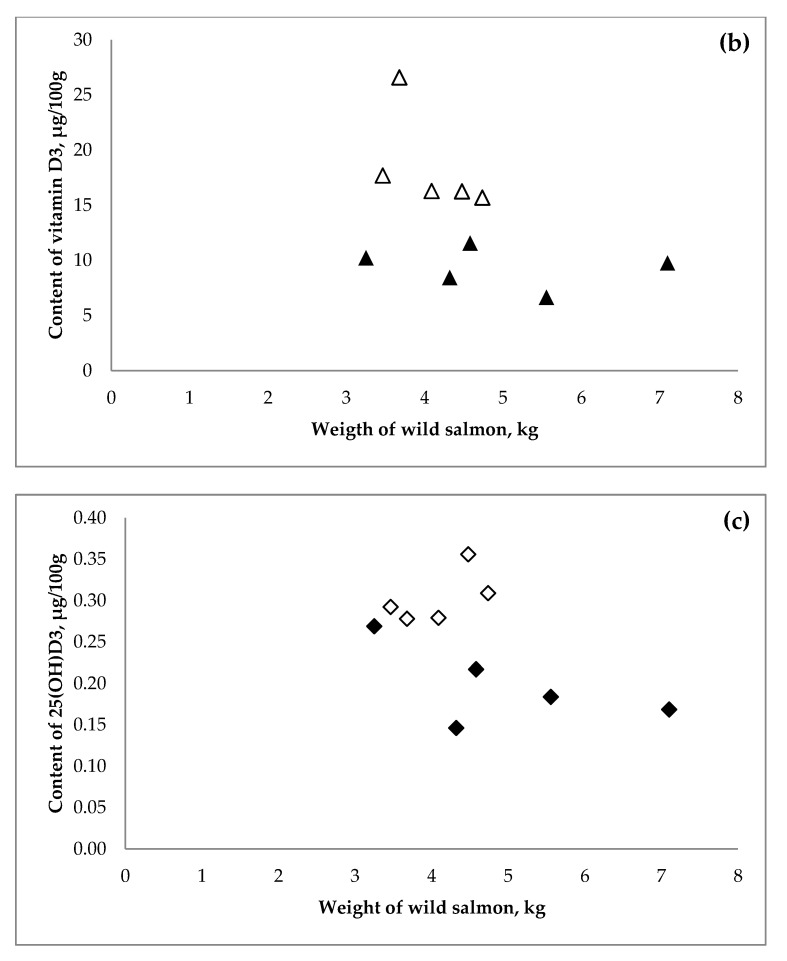
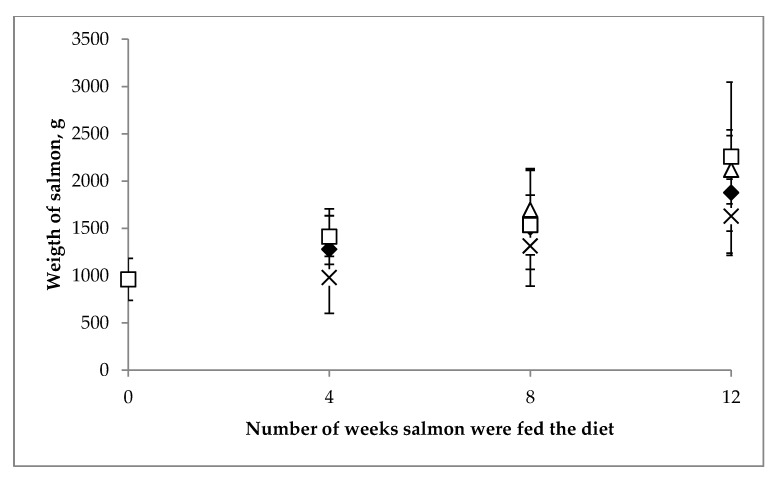
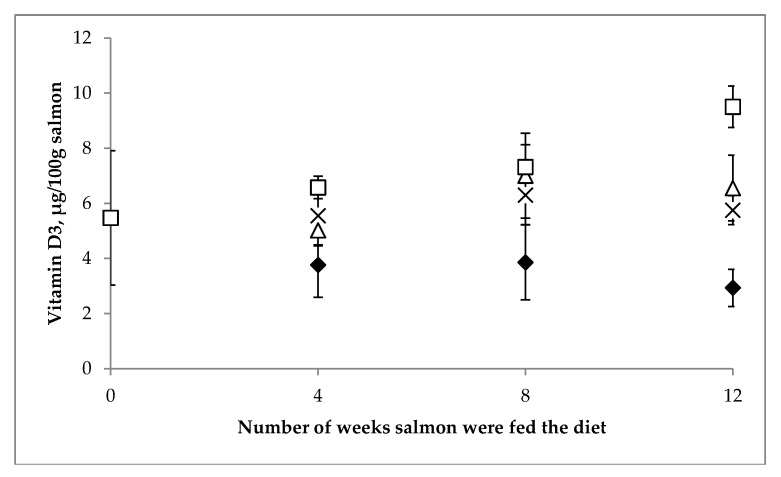
Salmon have been widely publicized as a good dietary source of vitamin D, but recent data points to large variation in vitamin D content and differences between wild and farmed salmon. We aimed to: (1) investigate the content of vitamin D in Atlantic salmon (Salmo salar) in wild species caught in two different waters, (2) perform a 12-week feeding trial in farmed Salmo salar with 270-1440 µg vitamin D3/kg feed (4-20 times maximum level in the EU) and (3) conduct a review for the published data on the content of vitamin D in salmonids. Content of vitamin D3 in the fillet from wild salmon caught in the Baltic Sea and the North Sea was significantly different (p < 0.05), being 18.5 ± 4.6 µg/100 g and 9.4 ± 1.9 µg/100 g, respectively. In the farmed salmon the content ranged from 2.9 ± 0.7 µg vitamin D3/100 g to 9.5 ± 0.7 µg vitamin D3/100 g. Data from 2018 shows that farmed salmon contained 2.3-7.3 µg vitamin D3/100 g. Information on the content of vitamin D in wild and farmed salmonids is very limited, which calls for further research to ensure a sustainable production of salmon with adequate vitamin D.
Keywords: Salmo salar; aquaculture; farmed; salmon; salmonids; vitamin D; vitamin D3; wild.
Conflict of interest statement
The authors declare no conflict of interest and the funders had no role in the design of the study; in the collection, analyses, or interpretation of data; in the writing of the manuscript, or in the decision to publish the results.
Figures
References
-
- Holick M.F. Vitamin D and health: Evolution, biologic functions, and recommended dietary intakes for vitamin D. Clin. Rev. Bone Miner. MeTable. 2009;7:2–19. doi: 10.1007/s12018-009-9026-x. - DOI
-
- O’Neill C.M., Kazantzidis A., Ryan M.J., Barber N., Sempos C.T., Durazo-Arvizu R.A., Jorde R., Grimnes G., Eiriksdottir G., Gudnason V., et al. Seasonal changes in vitamin D-effective UVB availability in Europe and associations with population serum 25-hydroxyvitamin D. Nutrients. 2016;8:533. doi: 10.3390/nu8090533. - DOI - PMC - PubMed
-
- Nordic Council of Ministers . Nordic Nutrition Recommendations 2012. 5th ed. Norden; Copenhagen, Denmark: 2012.
MeSH terms
Substances
Grants and funding
LinkOut - more resources
Full Text Sources
