. 2019 Apr 29;10(1):1962.
doi: 10.1038/s41467-019-09980-7.

Near physiological spectral selectivity of cochlear optogenetics

Affiliations

Near physiological spectral selectivity of cochlear optogenetics

Alexander Dieter et al. Nat Commun. .

Abstract

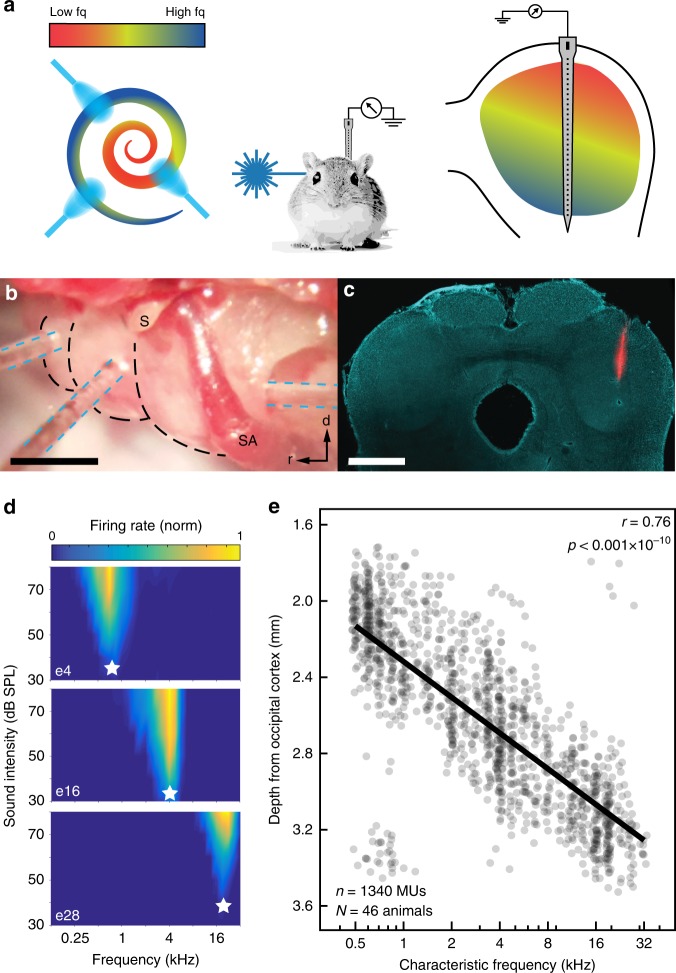
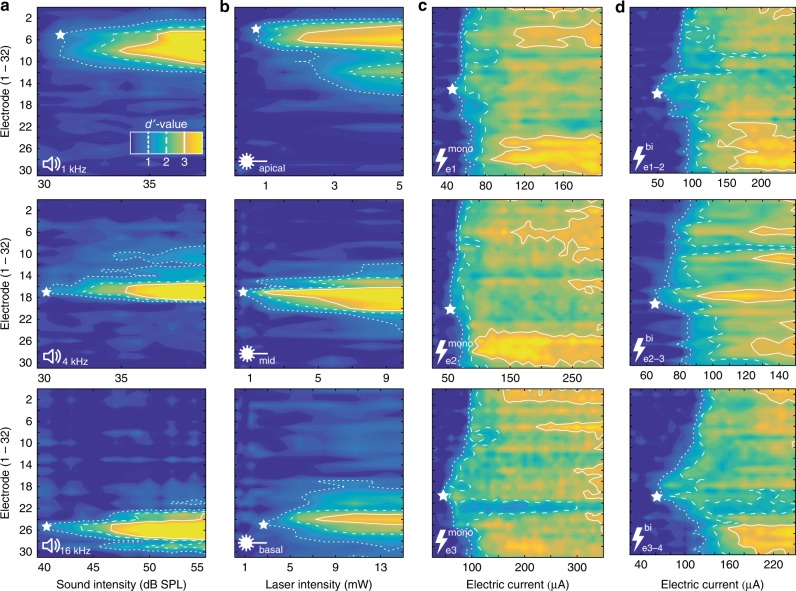
Cochlear implants (CIs) electrically stimulate spiral ganglion neurons (SGNs) and partially restore hearing to half a million CI users. However, wide current spread from intracochlear electrodes limits spatial selectivity (i.e. spectral resolution) of electrical CIs. Optogenetic stimulation might become an alternative, since light can be confined in space, promising artificial sound encoding with increased spectral selectivity. Here we compare spectral selectivity of optogenetic, electric, and acoustic stimulation by multi-channel recordings in the inferior colliculus (IC) of gerbils. When projecting light onto tonotopically distinct SGNs, we observe corresponding tonotopically ordered IC activity. An activity-based comparison reveals that spectral selectivity of optogenetic stimulation is indistinguishable from acoustic stimulation for modest intensities. Moreover, optogenetic stimulation outperforms bipolar electric stimulation at medium and high intensities and monopolar electric stimulation at all intensities. In conclusion, we demonstrate better spectral selectivity of optogenetic over electric SGN stimulation, suggesting the potential for improved hearing restoration by optical CIs.


Conflict of interest statement

The authors declare no competing interests.

Figures

Fig. 1
Fig. 1
Experimental layout and acoustic response properties. a Experimental design. b Optical fibers (blue dashed lines) inserted via cochleostomies at the apical and mid-turn of the cochlea (black dashed lines), as well as in the round window (from left to right). S: stapes, SA: stapedial artery. Scale bar: ~1mm. c DiI-stained electrode track (red) in a DAPI-stained (cyan) coronal section of the inferior colliculus. Scale bar: 1 mm. d Frequency response areas and characteristic frequencies (CFs; white stars) recorded at electrode 4, 16, and 24 (e4, 16, 28) in one animal. e CFs as a function of recording depth. Solid line: linear fit of all CFs, according to Pearson’s correlation coefficient. Data is pooled from all animals (virus-injected as well as non-injected). Source data of (e) is provided as a source data file
Fig. 2
Fig. 2
Acoustic, optogenetic, and electric activation of the auditory system. ad Monotonicity indices (MI) normalized to the maximum bin for acoustic stimulation in non-injected animals (a), optogenetic stimulation in virus-injected animals (b), monopolar (c), and bipolar electric stimulation in non-injected animals (d). Dashed lines mark a monotonicity index of 0.5, above which units are considered as monotonic. eh Firing rates of multi-units as a function of stimulus intensity (thin, transparent lines) and average per animal and stimulus (solid lines) for acoustic (e), optogenetic (f), monopolar (g), and bipolar (h) electric stimulation. i Distribution of dynamic ranges (DRs) per multi-unit in dB (SPL), dB (mW), and dB (µA). j DRs of averaged multi-units per animal and stimulus, units as in (e). k Maximum strength of response that could be evoked by any stimulus modality. Data in (i), (j), and (k) is displayed as mean ± s.d. Stars indicate statistical significance (*p < 0.05, **p < 0.01, ***p < 0.001), based on one-way ANOVA and post-hoc pairwise comparison. Only significant differences are indicated. Source data of all panels is provided as a source data file
Fig. 3
Fig. 3
Exemplary spatial tuning curves (STC) for different stimulus modalities. a STCs in response to pure tones of different frequencies in naive animals. b STCs in response to laser pulses delivered via optical fibers placed at different positions in the cochlea of virus-injected animals. c STCs in response to electric current delivered via different electrodes (e1, e2, and e3) of an electrical cochlear implant in non-injected animals in the monopolar configuration. d STCs in response to electric current delivered via the same electrodes in bipolar configuration. White stars indicate the best electrode (BE) of each STC. The color scale in (a) applies to all panels displayed in this figure
Fig. 4
Fig. 4
Quantification of spatial tuning curves (STCs). a Quantification of STCs: STC in response to a 2 kHz pure tone in a non-injected gerbil. Cumulative d′ values are color-coded in a matrix sorted according to electrode number (ordinate) and stimulus intensity (abscissa). The electrode with the lowest threshold (d’ = 1) is defined as the best electrode (BE, white star) and the spread of excitation (SoE) is measured at different activation strengths (exemplary shown for a d′ of 3 at the BE). b BEs as a function of stimulation frequency recorded from non-injected gerbils. Solid line: linear fit of tonotopic slope. Different symbols mark different animals. c BEs as a function of optical stimulation site in virus-injected animals, including mean and standard deviation for each stimulation site. Symbols mark different animals. d BEs as a function of stimulation electrode for monopolar electrical stimulation in non-injected animals, including mean and standard deviation for each electrode. e BEs as a function of stimulating electrode pair for bipolar electrical stimulation in non-injected animals, including mean and standard deviation for each electrode pair. Pearson’s correlation coefficient r and the corresponding p-values were calculated for panel be. fi Spectral spread has been quantified at different d′-values for acoustic (f), optogenetic (g), monopolar (h) and bipolar electric stimulation (i). Box plots indicate minimum (lower) and maximum (upper) whisker, median (center line), as well as 25th percentile and 75th percentile. j Mean and SEM for the spread of excitation upon acoustic, optogenetic, monopolar, and bipolar electric stimulation. Stars indicate statistical significance (*p < 0.05, **p < 0.01, ***p < 0.001), according to repeated-measures ANOVA and post-hoc pairwise comparison tests. Only significant differences have been indicated. Source data of panels bj is provided as a source data file

References

    1. Zeng FG, Rebscher S, Harrison WV, Sun X, Feng H. Cochlear implants:system design, integration and evaluation. IEEE Rev. Biomed. Eng. 2008;1:115–142. doi: 10.1109/RBME.2008.2008250. - DOI - PMC - PubMed
    1. Lenarz T. Cochlear implant—state of the art. GMS Curr. Top. Otorhinolaryngol. Head Neck Surg. 2018;16:Doc04. - PMC - PubMed
    1. Middlebrooks JC, Bierer JA, Snyder RL. Cochlear implants: the view from the brain. Curr. Opin. Neurobiol. 2005;15:488–493. doi: 10.1016/j.conb.2005.06.004. - DOI - PubMed
    1. Kral A, Hartmann R, Mortazavi D, Klinke R. Spatial resolution of cochlear implants: the electrical field and excitation of auditory afferents. Hear. Res. 1998;121:11–28. doi: 10.1016/S0378-5955(98)00061-6. - DOI - PubMed
    1. Friesen LM, Shannon RV, Baskent D, Wang X. Speech recognition in noise as a function of the number of spectral channels: comparison of acoustic hearing and cochlear implants. J. Acoust. Soc. Am. 2001;110:1150. doi: 10.1121/1.1381538. - DOI - PubMed

Publication types