. 2019 Apr 29;10(1):1930.
doi: 10.1038/s41467-019-09982-5.

CUT&Tag for efficient epigenomic profiling of small samples and single cells

Affiliations

CUT&Tag for efficient epigenomic profiling of small samples and single cells

Hatice S Kaya-Okur et al. Nat Commun. .

Abstract

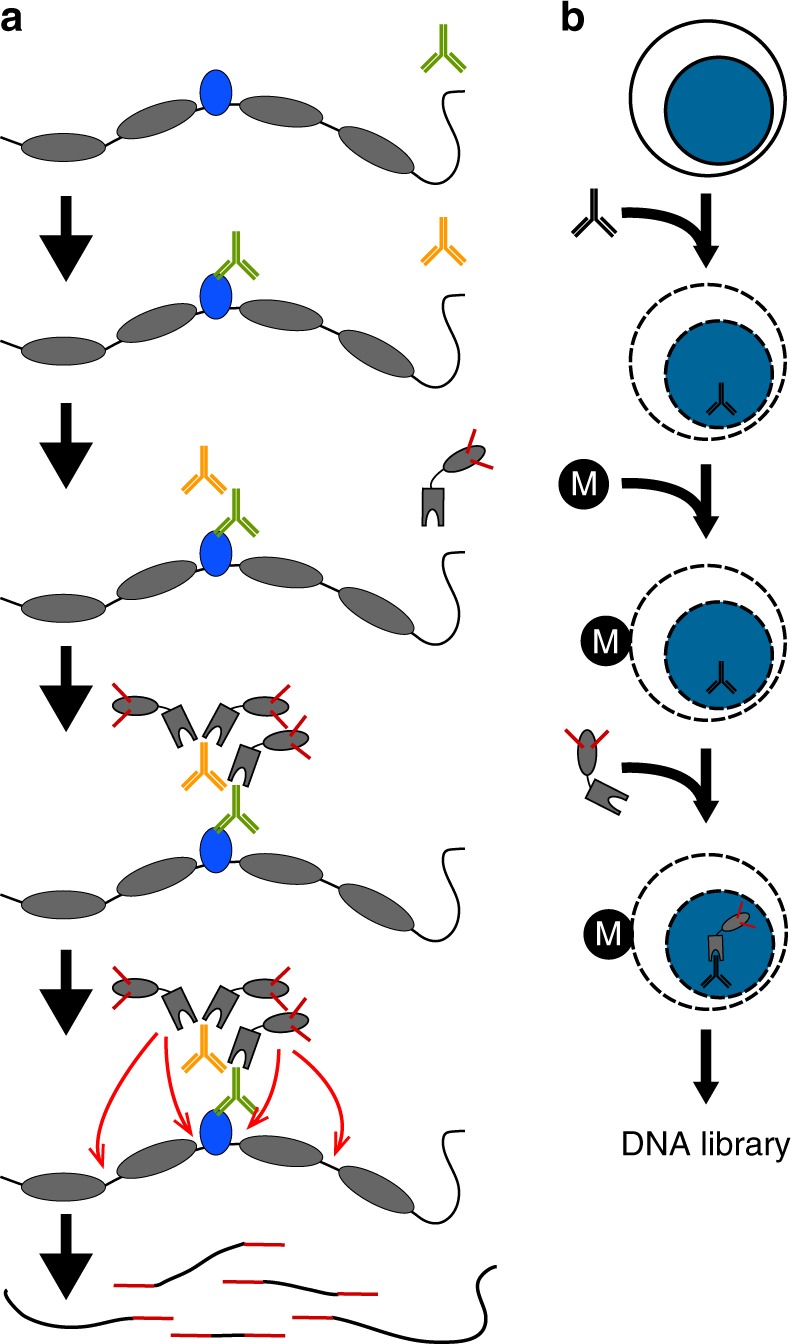
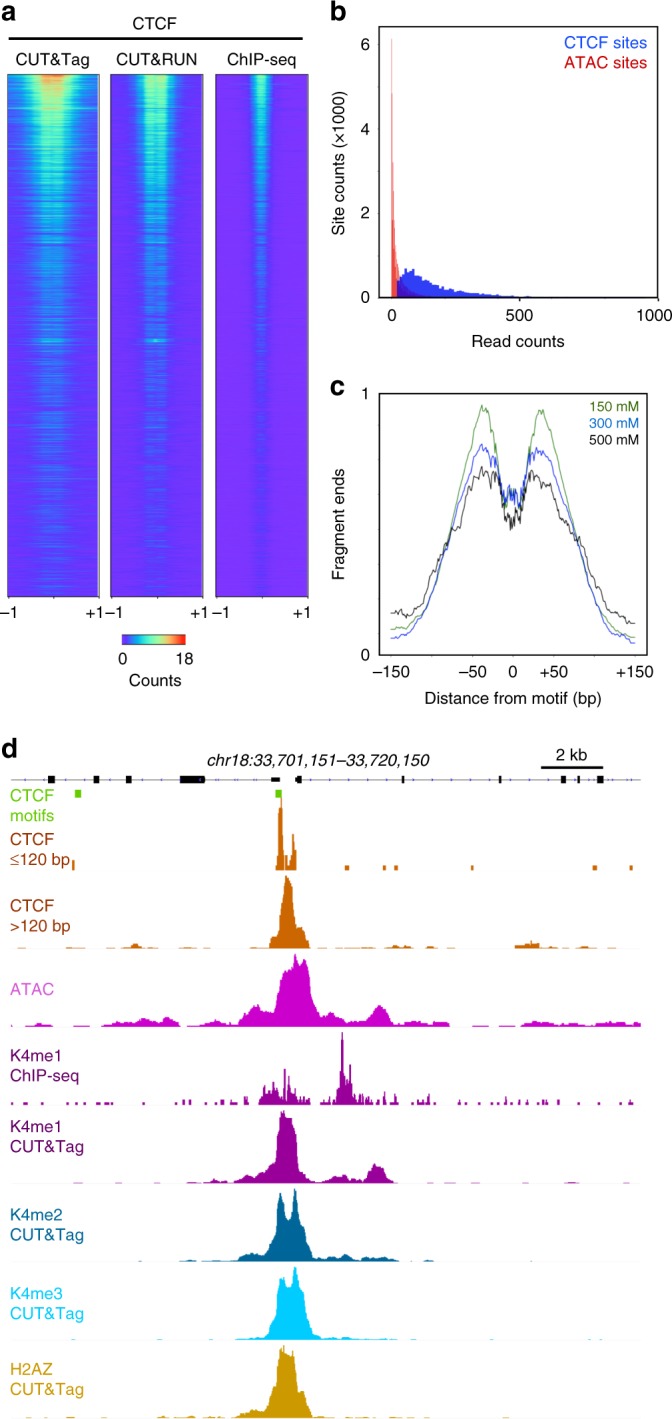
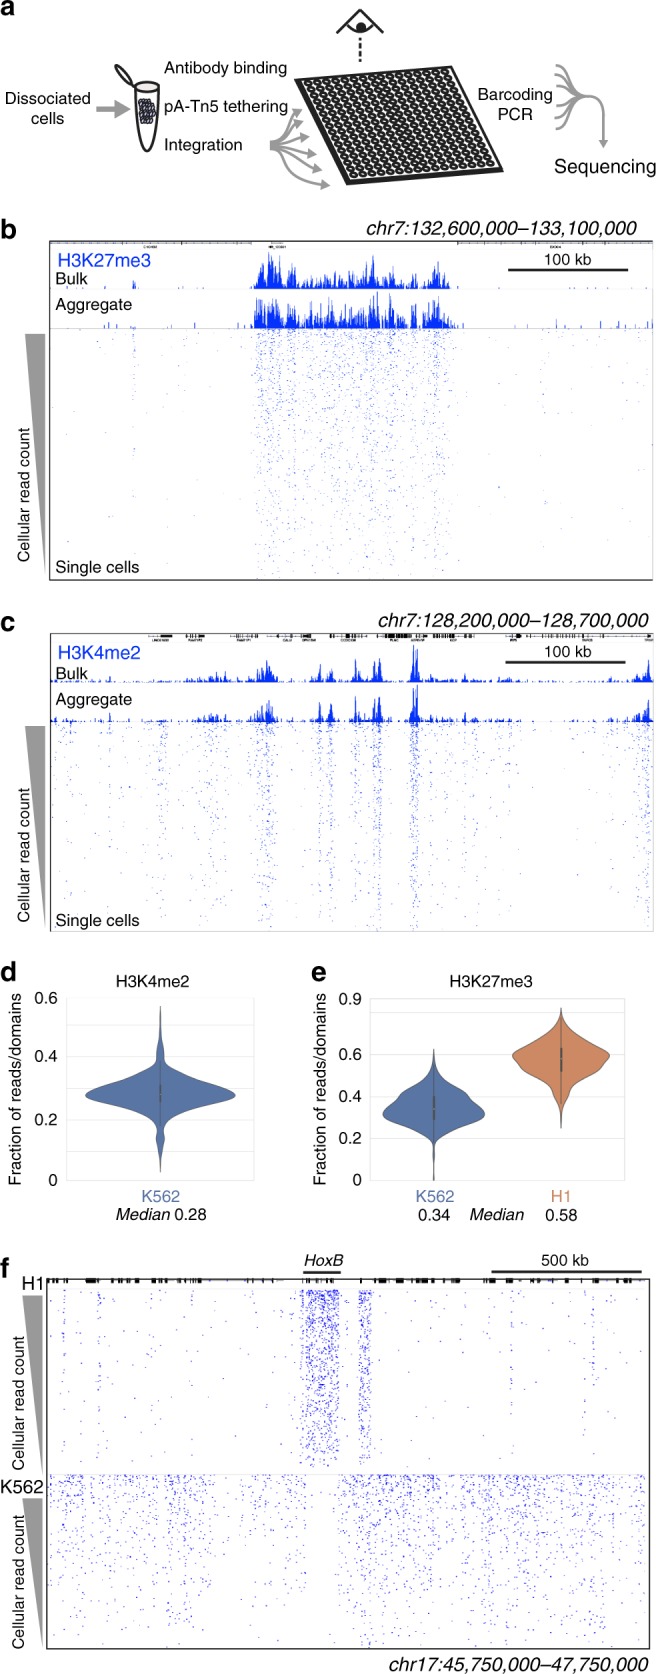
Many chromatin features play critical roles in regulating gene expression. A complete understanding of gene regulation will require the mapping of specific chromatin features in small samples of cells at high resolution. Here we describe Cleavage Under Targets and Tagmentation (CUT&Tag), an enzyme-tethering strategy that provides efficient high-resolution sequencing libraries for profiling diverse chromatin components. In CUT&Tag, a chromatin protein is bound in situ by a specific antibody, which then tethers a protein A-Tn5 transposase fusion protein. Activation of the transposase efficiently generates fragment libraries with high resolution and exceptionally low background. All steps from live cells to sequencing-ready libraries can be performed in a single tube on the benchtop or a microwell in a high-throughput pipeline, and the entire procedure can be performed in one day. We demonstrate the utility of CUT&Tag by profiling histone modifications, RNA Polymerase II and transcription factors on low cell numbers and single cells.


Conflict of interest statement

The authors declare no competing interests.

Figures

Fig. 1
Fig. 1
In situ tethering for CUT&Tag chromatin profiling. a The steps in CUT&Tag. Added antibody (green) binds to the target chromatin protein (blue) between nucleosomes (gray ovals) in the genome, and the excess is washed away. A second antibody (orange) is added and enhances tethering of pA-Tn5 transposome (gray boxes) at antibody-bound sites. After washing away excess transposome, addition of Mg++ activates the transposome and integrates adapters (red) at chromatin protein binding sites. After DNA purification genomic fragments with adapters at both ends are enriched by PCR. b CUT&Tag is performed on a solid support. Unfixed cells or nuclei (blue) are permeabilized and mixed with antibody to a target chromatin protein. After addition and binding of cells to Concanavilin A-coated magnetic beads (M), all further steps are performed in the same reaction tube with magnetic capture between washes and incubations, including pA-Tn5 tethering, integration, and DNA purification
Fig. 2
Fig. 2
CUT&Tag for histone modification profiling and RNAPII. a Representative chromatin landscapes across a 3 Mb segment of the human genome generated by the indicated method. For H3K27me3, we downsampled ChIP-seq and CUT&RUN datasets to the same total mapped read counts as CUT&Tag for direct comparison. The high background in downsampled ChIP-seq is from singleton reads distributed across the genome. b Same as a except for H1 ES cells. c Comparison of profiling methods for the H3K4me1 histone modification in K562 cells. The same antibody was used in all experiments. Peaks were called and ordered for each dataset using MACS2. Each dataset was downsampled to the same read depth for comparison and plotted on their called peaks. Color intensities are scaled to the maximum read count at peaks in each dataset. d Detection of gene activity by RNAPII CUT&Tag. Gene promoters were ordered by associated RNA-seq counts (gray wedge) and read counts from RNAPII S2/5p CUT&Tag were plotted on these sites. e Active RNAPII is enriched at RNAPII CUT&Tag peaks. Peaks were called from RNAPII S2/5p CUT&Tag and ordered using MACS2 (gray wedge). PRO-seq reads were displayed onto these positions for (+) strand reads (yellow) and (–) strand reads (blue). f Comparison of ATAC-seq and H3K4me2 CUT&Tag profiling in K562 cells. Peaks were called on ATAC-seq data and heat maps were produced as in c. The top and bottom 2.5% of peaks were discarded to remove outliers. g Metaplot comparison of H3K4me1 histone modification signal in CUT&RUN, CUT&Tag, and ChIP-seq in K562 cells, averaged at the top 10,000 peaks detected by MACS2 in ChIP-seq data. Profiling with the same antibody was compared at the downsampled read depths of 8 million mapped reads for all three methods (blue, cyan, and green), and for 40 million mapped reads (orange) from ChIP-seq. h Metaplot comparison of ATAC-seq and H3K4me2 CUT&Tag profiling in K562 cells. 53,805 peaks were called on ATAC-seq data using MACS2, and read counts from each method were averaged across the intervals. The top and bottom 2.5% of peaks were discarded to remove outliers. Read counts at 17,000 randomly-chosen intervals for each dataset are displayed as dotted lines. Source data are available in the Source Data file
Fig. 3
Fig. 3
Reproducibility and efficiency of CUT&Tag. a Hierarchically clustered correlation matrix of CUT&Tag replicates (R1 and R2) and with CUT&RUN and ChIP-seq profiling for the H3K4me1 histone modification. The same antibody was used in all experiments. Pearson correlations were calculated using the log2-transformed values of read counts split into 500 bp bins across the genome. b Efficiency of peak-calling between methods. Mitochondrial reads were removed from datasets from each method profiling the H3K4me2 histone modification. The remaining read counts were downsampled to varying depths, and then used to call peaks using MACS2. The summed number of reads falling within called peaks in each dataset was plotted. Source data are available in the Source Data file
Fig. 4
Fig. 4
CUT&Tag profiling of the NPAT chromatin factor and chromatin accessibility. a Ideograms of chromosome 1 and chromosome 6 with the clusters of replication-dependent histone genes (6 genes at 1q21.2 and 55 genes at 6p22.2) indicated. An NPAT CUT&Tag profiling track is displayed over each chromosome. The major NPAT peaks fall at the histone genes. b Distribution of read counts in CUT&Tag profiling. Called accessible sites from ATAC-seq data were segregated into those at histone genes and other ATAC sites. Read counts from NPAT CUT&Tag were plotted for each category. c Boxplots of NPAT CUT&Tag signal at the promoters of replication-dependent histone genes (His), at other accessible sites called from ATAC-seq data, and at a random selection of genomic background sites (bkgd). Source data are available in the Source Data file
Fig. 5
Fig. 5
CUT&Tag profiling of the CTCF DNA-binding protein. a Comparison of methods for CTCF mapping. CTCF motifs in the genome were ranked by e-value, datasets from each method were downsampled to the same read depth, and then read counts were plotted on the fixed order of sites. b Distribution of read counts in CTCF CUT&Tag profiling. Sites were called from CUT&RUN profiling (blue) and at non-overlapping accessible sites (red, called from ATAC-seq). Read counts from CTCF CUT&Tag were plotted for each category. c Resolution of CUT&Tag. Mean plots of fragment end positions from CTCF CUT&Tag centered over CTCF motifs in called peaks. Three different NaCl concentrations were used in wash buffers during and after pA-Tn5 tethering. Data are represented as a fraction of the maximum signal within the interval. d Resolved structure of a CTCF binding site. The promoter of the SLC39A6 gene on chromosome 18 shows the chromatin features around a CTCF-bound site. Source data are available in the Source Data file
Fig. 6
Fig. 6
Chromatin profiling of individual cells. a Single cell CUT&Tag (scCUT&Tag) processing. All steps from antibody incubations through adapter tagmentation are done on a population of permeabilized unfixed cells. Individual cells are then dispensed into nanowells of a Takara ICELL8 chip. After verifying nanowells with single cells by microscopy, combinations of two indexed barcoded primers are added to each well and fragment libraries are enriched by PCR. Libraries from the chip are pooled for multiplex sequencing. b A chromatin landscape across a 500 kb segment of the human genome is shown for H3K27me3 CUT&Tag on K562 cells. Tracks from bulk CUT&Tag, aggregated scCUT&Tag, and for 956 single cells are shown. Single cells are ordered by total read counts in each cell. c A chromatin landscape across a 500 kb segment of the human genome for H3K4me2 CUT&Tag on K562 cells. Tracks from bulk CUT&Tag, aggregated scCUT&Tag, and for 808 single cells are shown. Single cells are ordered by total read counts in each cell. d Fraction of reads in single K562 cells falling within called active peaks for the H3K4me2 histone modification using stringent criteria. Narrow peaks were called using MACS2 on bulk profiling data, and reads from scCUT&Tag were assigned to those peaks. e Fraction of reads in single K562 and H1 cells falling within called silenced domains for the H3K27me3 histone modification. Domains were called using SEACR on bulk profiling data for each cell type, and reads from scCUT&Tag were assigned to those domains. f Comparison of chromatin landscapes in H1 and K562 single cells across a 2 Mb segment including the HoxB locus. Four hundred and seventy-nine single cells of each type were ordered by total read counts. Source data are available in the Source Data file

References

    1. Zentner GE, Henikoff S. High-resolution digital profiling of the epigenome. Nat. Rev. Genet. 2014;15:814–827. doi: 10.1038/nrg3798. - DOI - PubMed
    1. Policastro RA, Zentner GE. Enzymatic methods for genome-wide profiling of protein binding sites. Brief. Funct. Genom. 2018;17:138–145. - PubMed
    1. Rhee HS, Pugh BF. Comprehensive genome-wide protein-DNA interactions detected at single-nucleotide resolution. Cell. 2011;147:1408–1419. doi: 10.1016/j.cell.2011.11.013. - DOI - PMC - PubMed
    1. Skene PJ, Henikoff S. A simple method for generating high-resolution maps of genome-wide protein binding. eLife. 2015;4:e09225. doi: 10.7554/eLife.09225. - DOI - PMC - PubMed
    1. Kasinathan S, Orsi GA, Zentner GE, Ahmad K, Henikoff S. High-resolution mapping of transcription factor binding sites on native chromatin. Nat. Methods. 2014;11:203–209. doi: 10.1038/nmeth.2766. - DOI - PMC - PubMed

Publication types

MeSH terms