. 2019 Apr 29;9(1):6634.
doi: 10.1038/s41598-019-43024-w.

Cortical circuit alterations precede motor impairments in Huntington's disease mice

Affiliations

Cortical circuit alterations precede motor impairments in Huntington's disease mice

Johanna Burgold et al. Sci Rep. .

Abstract

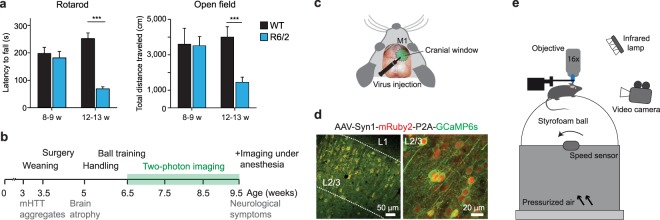
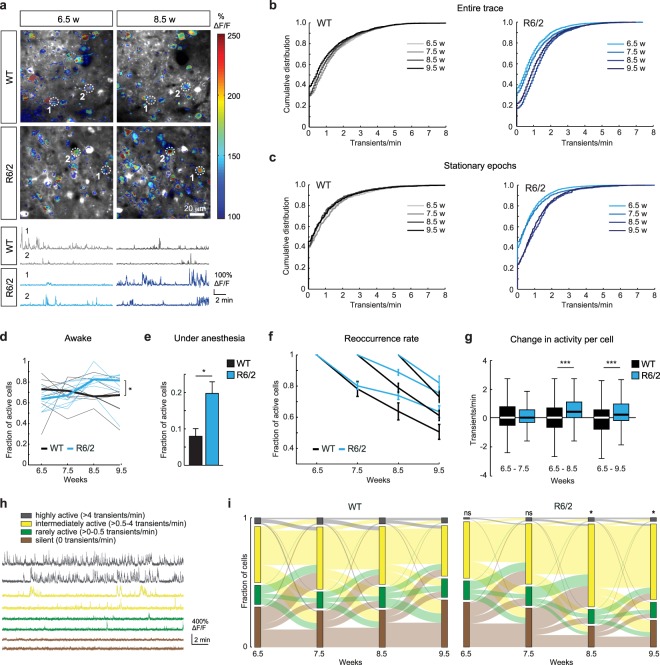
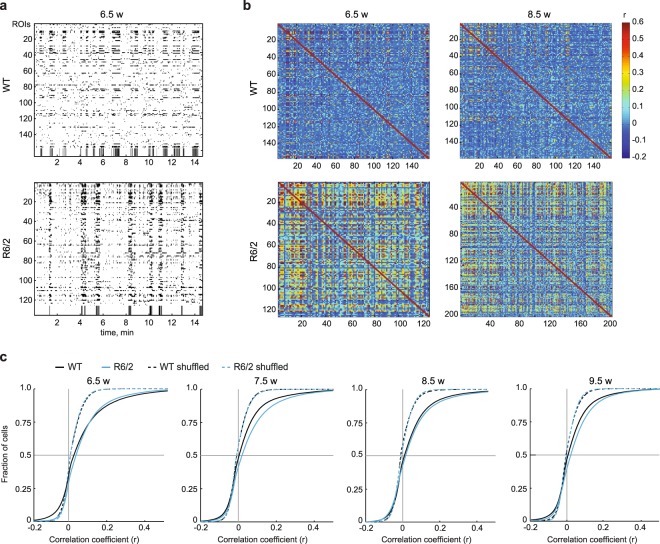
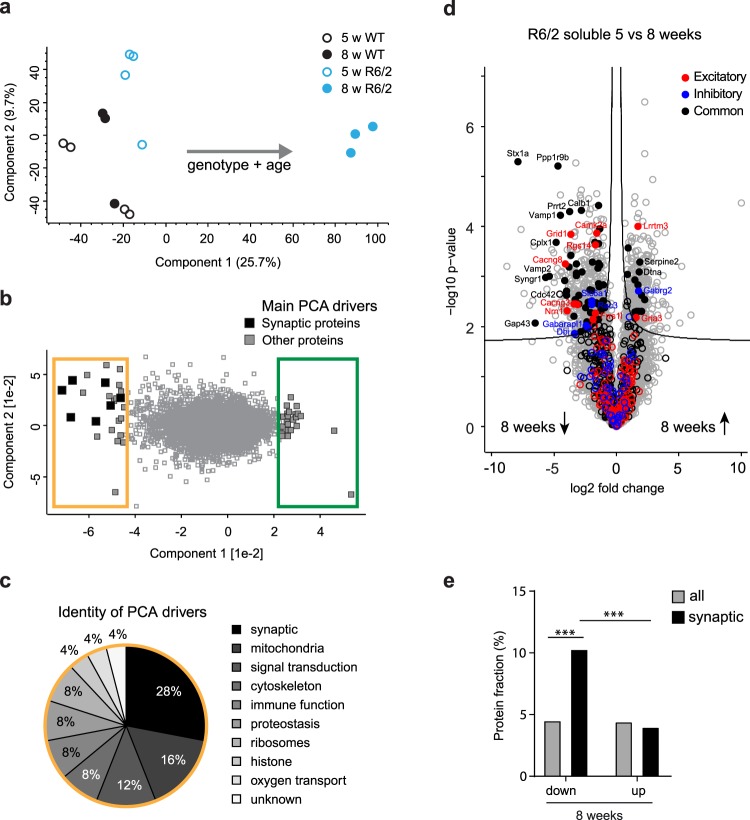
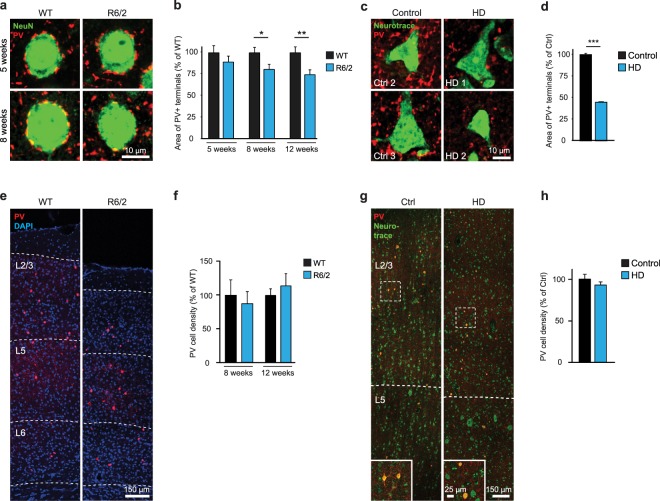
Huntington's disease (HD) is a devastating hereditary movement disorder, characterized by degeneration of neurons in the striatum and cortex. Studies in human patients and mouse HD models suggest that disturbances of neuronal function in the neocortex play an important role in disease onset and progression. However, the precise nature and time course of cortical alterations in HD have remained elusive. Here, we use chronic in vivo two-photon calcium imaging to longitudinally monitor the activity of identified single neurons in layer 2/3 of the primary motor cortex in awake, behaving R6/2 transgenic HD mice and wildtype littermates. R6/2 mice show age-dependent changes in cortical network function, with an increase in activity that affects a large fraction of cells and occurs rather abruptly within one week, preceeding the onset of motor defects. Furthermore, quantitative proteomics demonstrate a pronounced downregulation of synaptic proteins in the cortex, and histological analyses in R6/2 mice and human HD autopsy cases reveal a reduction in perisomatic inhibitory synaptic contacts on layer 2/3 pyramidal cells. Taken together, our study provides a time-resolved description of cortical network dysfunction in behaving HD mice and points to disturbed excitation/inhibition balance as an important pathomechanism in HD.


Conflict of interest statement

The authors declare no competing interests.

Figures

Figure 1
Figure 1
Chronic two-photon calcium imaging in awake R6/2 mice. (a) Left: Latency to fall on the accelerating rotarod. Right: Distance traveled in the open field. ***p < 0.001. (b) Experimental design and timeline of R6/2 phenotypes. (c) Scheme of a cranial window over the M1 cortex. (d) Coronal brain section showing AAV1/2-mediated expression of mRuby2 (red) and GCaMP6s (green) in L2/3 neurons in M1. (e) Imaging setup. A mouse head-fixed under a two-photon microscope is placed on a spherical treadmill floating on pressurized air. Neuronal activity is monitored through a cranial window. Running behavior is registered by an IR-sensitive video camera and a speed sensor.
Figure 2
Figure 2
Increased neuronal activity before the onset of motor defects in R6/2 mice. (a) Top: Examples of imaged areas in WT and R6/2 mice superimposed by activity maps. Color coding shows normalized maximum activity. Bottom: Calcium traces of neurons marked on the images above. (b) Cumulative distributions of calcium transient frequencies at the indicated time points in WT (left) and R6/2 (right) animals. Note a shift in the distribution towards higher frequencies occurring at 8.5 weeks in R6/2 mice. (c) Cumulative distributions of calcium transient frequencies during stationary epochs at the indicated time points in WT (left) and R6/2 (right) animals. (d) Fraction of active cells at different imaging time points in WT and R6/2 mice. (e) Fraction of active cells under 1.5% isoflurane anesthesia at 9.5 weeks. (f) Reoccurrence rate of active cells in WT and R6/2 mice. (g) Box plots showing activity changes of single cells between the first and later time points. (h) Example traces of highly active, intermediately active, rarely active and silent neurons. (i) Alluvial plots showing the distribution of imaged cells into four activity categories at each time point (stacked bars), as well as changes between the activity categories over time (stream fields) in WT (left) and R6/2 (right) animals. *p < 0.05, ***p < 0.001.
Figure 3
Figure 3
Increased synchrony in R6/2 mice. (a) Representative raster plots of single-cell activity in a WT (top) and R6/2 (bottom) mouse during an imaging session at 6.5 weeks of age. Running episodes are depicted in black and stationary periods in white at the bottom of the plots. (b) Correlograms from a WT (top) and R6/2 (bottom) mouse shown in (a) at 6.5 weeks (left) and 8.5 weeks (right). Only active cells were included in the analysis, resulting in the different numbers of ROIs captured in the correlograms at different time points. (c) Cumulative distributions of pairwise correlation values (Pearson’s r) for actual (solid lines) and shuffled (dashed lines) data at different time points. Pairwise correlation analysis was performed on entire traces.
Figure 4
Figure 4
Downregulation of synaptic proteins in R6/2 cortex. (a) PCA projections of soluble cortical samples from 5- and 8-week-old R6/2 mice and WT littermates. (b) Main PCA drivers of the separation that are downregulated (yellow frame) and upregulated (green frame) in 8-week-old R6/2 mice. Synapse-related proteins are highlighted in black. Main drivers were defined as the top 25 proteins accounting for the separation of samples in the PCA. (c) Functional groups of the main PCA drivers downregulated in 8-week-old R6/2 mice (indicated by the yellow frame in b). See also Supplementary Table S1. (d) Volcano plot showing proteins up- or downregulated in the soluble fraction of 8-week-old compared to 5-week-old R6/2 cortex. Proteins above the curved q-value cutoff line are statistically significantly changed (q < 5%); Excitatory synaptic proteins are highlighted in red, inhibitory in blue, common in black; filled circles indicate significantly changed synaptic proteins. (e) Fraction of proteins significantly (q-value < 5%) up- or downregulated in the soluble proteome of the R6/2 compared to WT cortex at 8 weeks. ***p < 0.001. See also Supplementary Table S2.
Figure 5
Figure 5
Reduction in inhibitory synaptic terminals on PCs in R6/2 mice and HD patients. (a,b) Representative images (a) and quantification (b) of PV+ synaptic terminals (red) on NeuN-labeled PC cell bodies (green) in L2/3 of M1 cortex from R6/2 mice and WT controls. (c,d) Representative images (c) and quantification (d) of PV+ synaptic terminals (red) on Neurotrace-labeled PC cell bodies (green) in L2/3 of M1 cortex from HD autopsy cases and controls. (e) Representative images of PV+ cells in M1 cortex of 8-week-old WT and R6/2 mice. Nuclei were counterstained with DAPI. Dashed lines denote borders between cortical layers. (f) Quantification of PV+ cell densities in M1 cortex of WT and R6/2 mice. (g) Representative images of PV+ cells in M1 cortex of HD cases and controls. Neuronal cell bodies are labeled with Neurotrace. Dashed lines denote borders between cortical layers. Insets show a higher magnification of the areas marked by dashed boxes. (h) Quantification of PV+ cell densities in M1 cortex of HD cases and controls. *p < 0.05; **p < 0.01; ***p < 0.001.

References

    1. The Huntington’s Disease Collaborative Research Group A novel gene containing a trinucleotide repeat that is expanded and unstable on Huntington’s disease chromosomes. Cell. 1993;72:971–983. doi: 10.1016/0092-8674(93)90585-E. - DOI - PubMed
    1. Labbadia J, Morimoto RI. Huntington’s disease: underlying molecular mechanisms and emerging concepts. Trends in biochemical sciences. 2013;38:378–385. doi: 10.1016/j.tibs.2013.05.003. - DOI - PMC - PubMed
    1. Saudou F, Humbert S. The Biology of Huntingtin. Neuron. 2016;89:910–926. doi: 10.1016/j.neuron.2016.02.003. - DOI - PubMed
    1. Raymond LA, et al. Pathophysiology of Huntington’s disease: time-dependent alterations in synaptic and receptor function. Neuroscience. 2011;198:252–273. doi: 10.1016/j.neuroscience.2011.08.052. - DOI - PMC - PubMed
    1. Vonsattel JP, DiFiglia M. Huntington disease. J Neuropathol Exp Neurol. 1998;57:369–384. doi: 10.1097/00005072-199805000-00001. - DOI - PubMed

Publication types

Substances