

Leukocyte Derived Microvesicles as Disease Progression Biomarkers in Slow Progressing Amyotrophic Lateral Sclerosis Patients
- PMID: 31037054
- PMCID: PMC6476347
- DOI: 10.3389/fnins.2019.00344
Leukocyte Derived Microvesicles as Disease Progression Biomarkers in Slow Progressing Amyotrophic Lateral Sclerosis Patients
Abstract
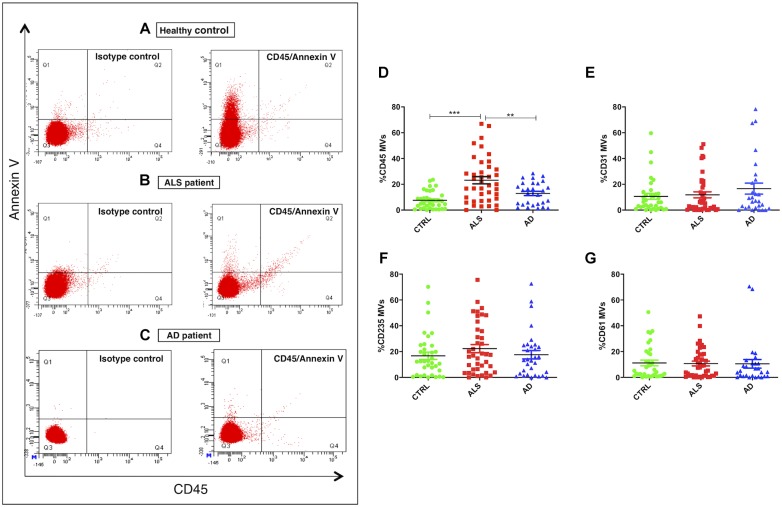
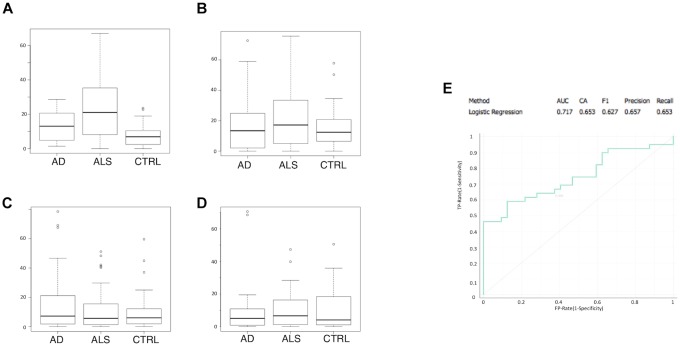
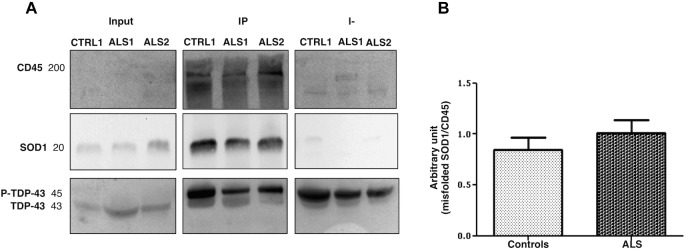
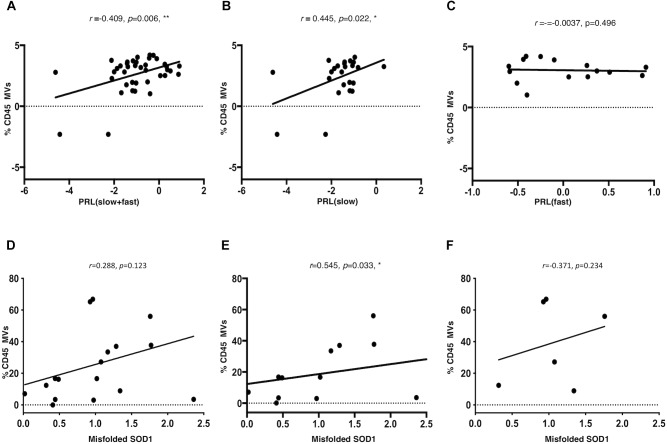
The lack of biomarkers in Amyotrophic Lateral Sclerosis (ALS) makes it difficult to determine the stage of the disease in patients and, therefore, it delays therapeutic trials. Microvesicles (MVs) are possible biomarkers implicated in physiological and pathological functions, however, their role in ALS remains unclear. We investigated whether plasma derived microvesicles could be overrepresented in a group of 40 patients affected by ALS compared to 28 Alzheimer's Disease (AD) patients and 36 healthy volunteers. Leukocyte derived MVs (LMVs) compared to endothelial, platelet, erythrocyte derived MVs, were mostly present in ALS patients compared to AD patients and healthy donors. Correlation analysis corrected for the presence of confounding variables (riluzole, age at onset, site of onset, gender) was tested between PRL (Progression Rate at the Last visit) and LMVs, and a statistically significant value was found (Pearson partial correlation r = 0.407, p = 0.006). We also investigated SOD1, TDP-43 intravesicular protein level in LMVs. Misfolded SOD1 was selectively transported by LMVs and its protein level was associated with the percentage of LMVs in slow progressing patients (r = 0.545, p = 0.033). Our preliminary findings suggest that LMVs are upregulated in ALS patients and they can be considered possible markers of disease progression.
Keywords: SOD1; TDP-43; amyotrophic lateral sclerosis; biomarkers; disease progression; microvesicles.
Figures
Similar articles
-
Pathological Proteins Are Transported by Extracellular Vesicles of Sporadic Amyotrophic Lateral Sclerosis Patients.Front Neurosci. 2018 Jul 19;12:487. doi: 10.3389/fnins.2018.00487. eCollection 2018. Front Neurosci. 2018. PMID: 30072868 Free PMC article.
-
Pathological Modification of TDP-43 in Amyotrophic Lateral Sclerosis with SOD1 Mutations.Mol Neurobiol. 2019 Mar;56(3):2007-2021. doi: 10.1007/s12035-018-1218-2. Epub 2018 Jul 7. Mol Neurobiol. 2019. PMID: 29982983 Free PMC article.
-
Tissue-enhanced plasma proteomic analysis for disease stratification in amyotrophic lateral sclerosis.Mol Neurodegener. 2018 Nov 7;13(1):60. doi: 10.1186/s13024-018-0292-2. Mol Neurodegener. 2018. PMID: 30404656 Free PMC article.
-
Tofersen for SOD1 ALS.Neurodegener Dis Manag. 2024;14(5):149-160. doi: 10.1080/17582024.2024.2402216. Epub 2024 Sep 27. Neurodegener Dis Manag. 2024. PMID: 39330700 Free PMC article. Review.
-
Protein aggregation and therapeutic strategies in SOD1- and TDP-43- linked ALS.Front Mol Biosci. 2024 May 24;11:1383453. doi: 10.3389/fmolb.2024.1383453. eCollection 2024. Front Mol Biosci. 2024. PMID: 38855322 Free PMC article. Review.
Cited by
-
Extracellular Vesicles as Innovative Treatment Strategy for Amyotrophic Lateral Sclerosis.Front Cell Dev Biol. 2021 Nov 11;9:754630. doi: 10.3389/fcell.2021.754630. eCollection 2021. Front Cell Dev Biol. 2021. PMID: 34858980 Free PMC article. Review.
-
Extracellular Vesicles in Amyotrophic Lateral Sclerosis.Life (Basel). 2022 Dec 31;13(1):121. doi: 10.3390/life13010121. Life (Basel). 2022. PMID: 36676070 Free PMC article. Review.
-
Circulating GLAST+ EVs are increased in amyotrophic lateral sclerosis.Front Mol Biosci. 2024 Nov 21;11:1507498. doi: 10.3389/fmolb.2024.1507498. eCollection 2024. Front Mol Biosci. 2024. PMID: 39640847 Free PMC article.
-
Inflammation and cell-to-cell communication, two related aspects in frailty.Immun Ageing. 2022 Oct 26;19(1):49. doi: 10.1186/s12979-022-00306-8. Immun Ageing. 2022. PMID: 36289502 Free PMC article.
-
Attenuation of amyotrophic lateral sclerosis via stem cell and extracellular vesicle therapy: An updated review.Neuroprotection. 2023 Dec;1(2):130-138. doi: 10.1002/nep3.26. Epub 2023 Nov 20. Neuroprotection. 2023. PMID: 38188233 Free PMC article.
References
Grants and funding
LinkOut - more resources
Full Text Sources
Miscellaneous