. 2019 Feb 28;9(6):1698-1713.
doi: 10.7150/thno.30640. eCollection 2019.

Berberine Protects Glomerular Podocytes via Inhibiting Drp1-Mediated Mitochondrial Fission and Dysfunction

Affiliations

Berberine Protects Glomerular Podocytes via Inhibiting Drp1-Mediated Mitochondrial Fission and Dysfunction

Xin Qin et al. Theranostics. .

Abstract

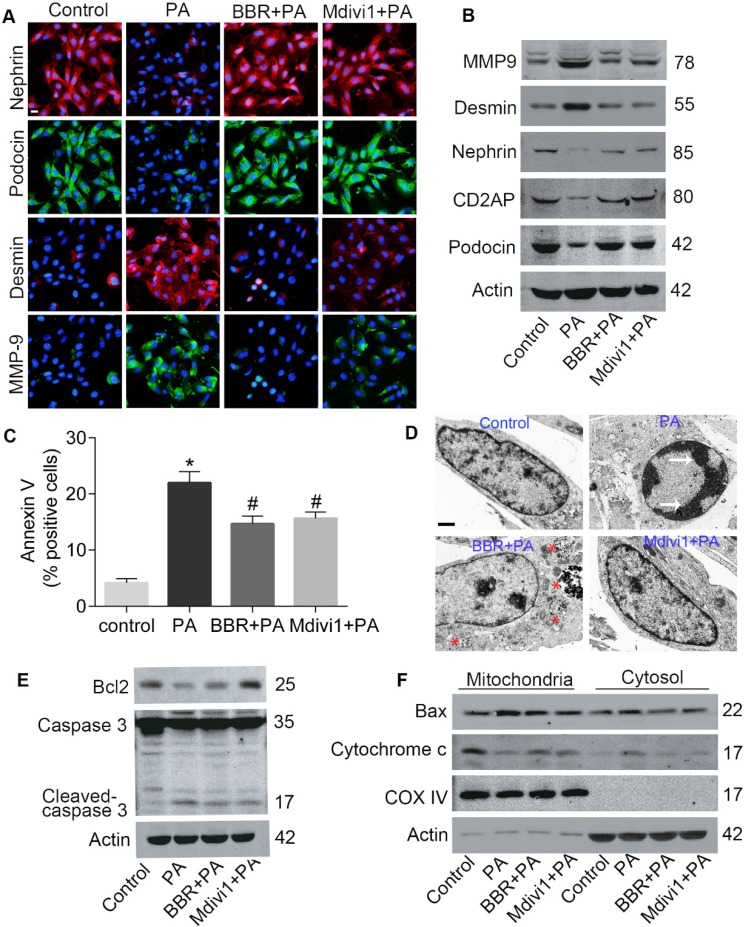
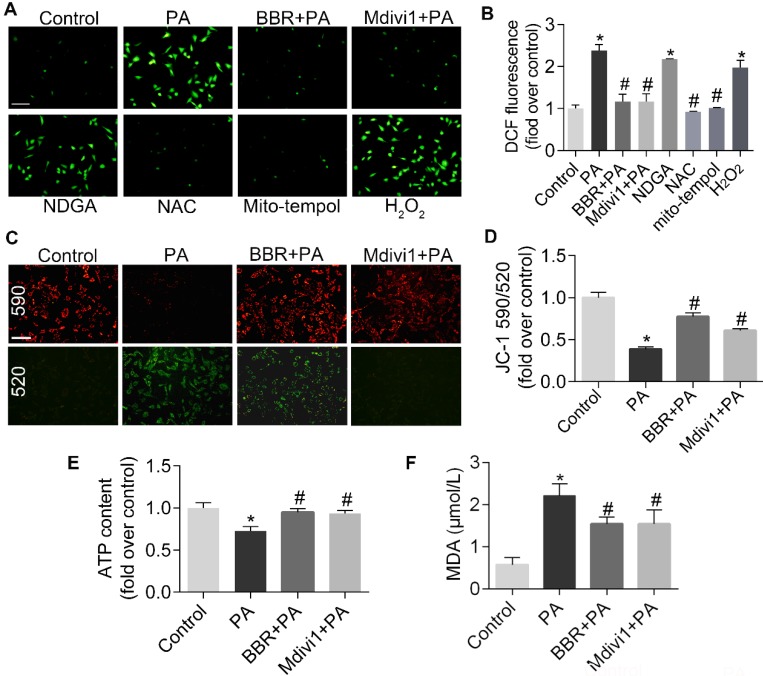
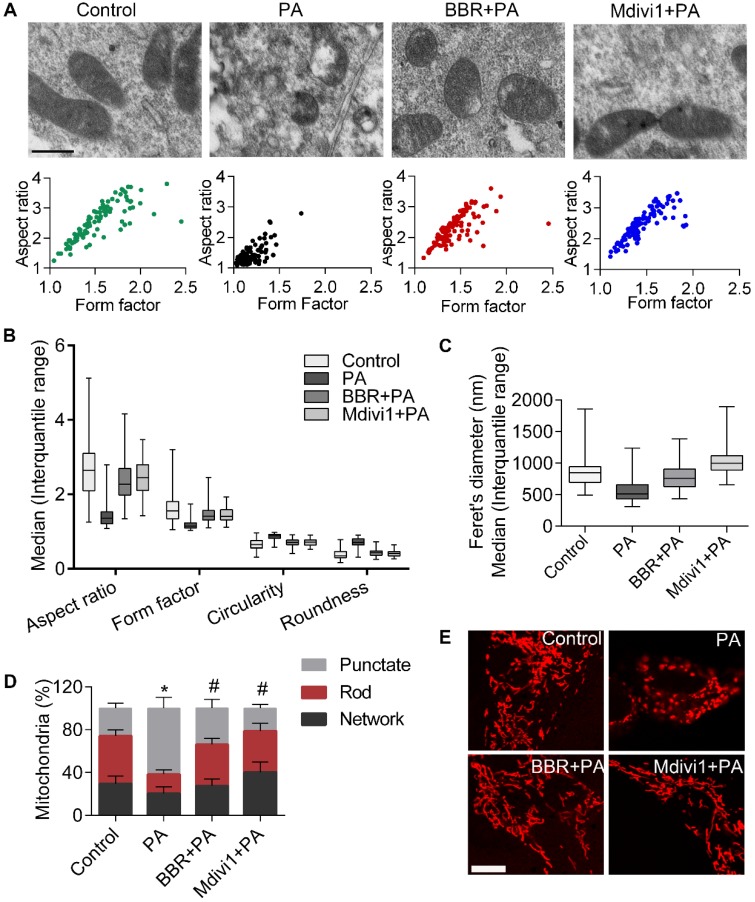
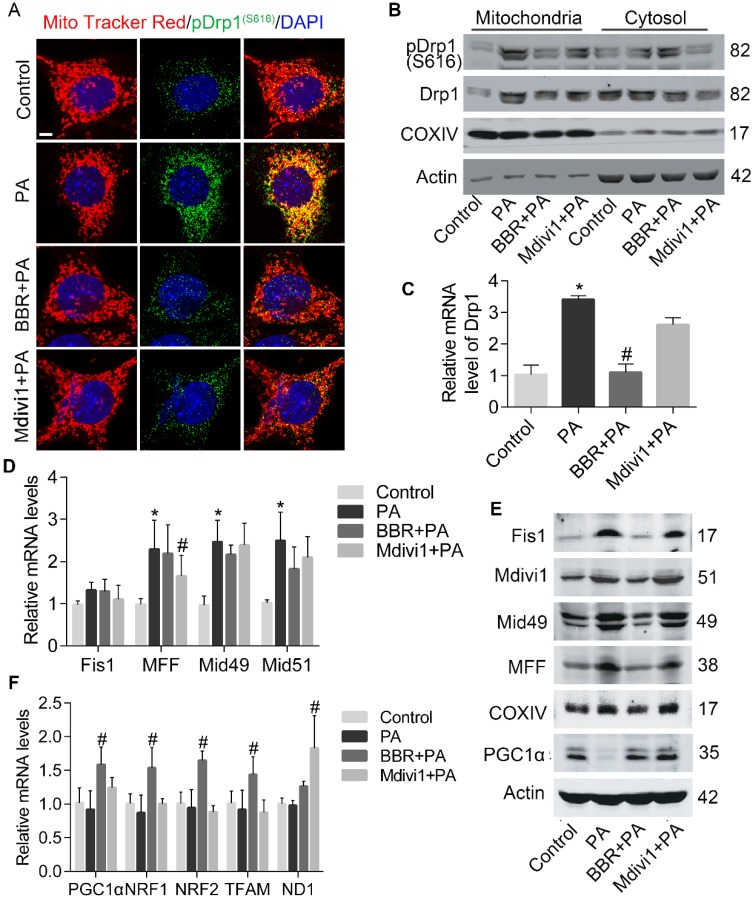
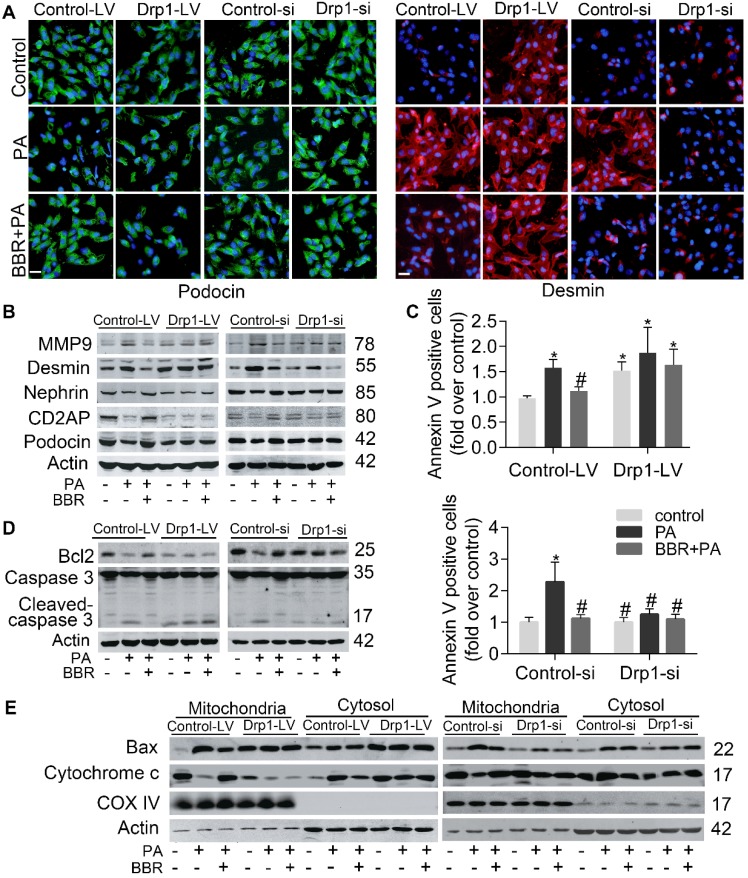
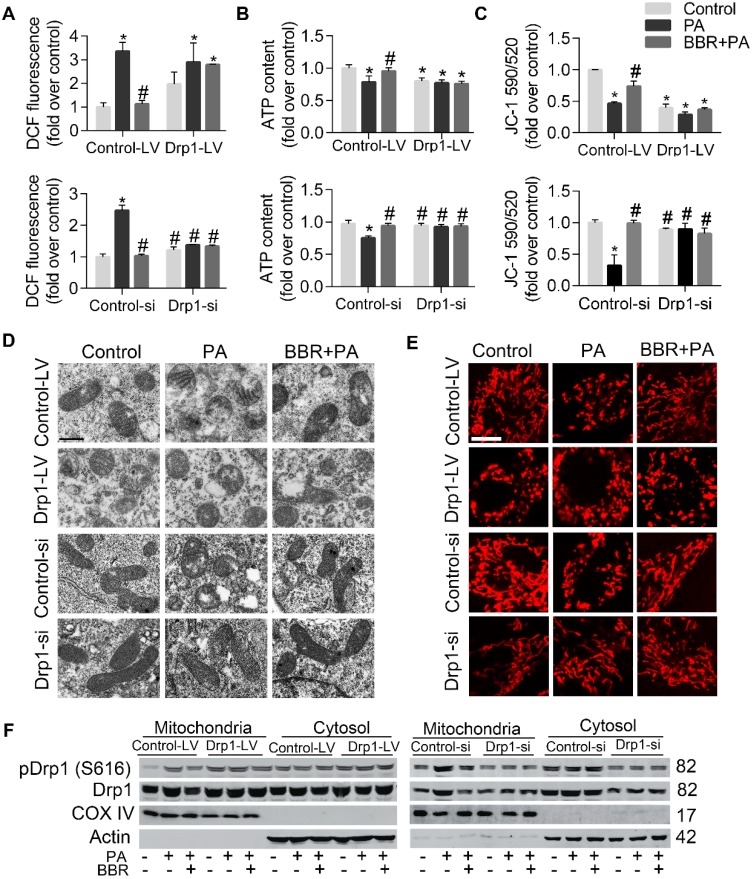
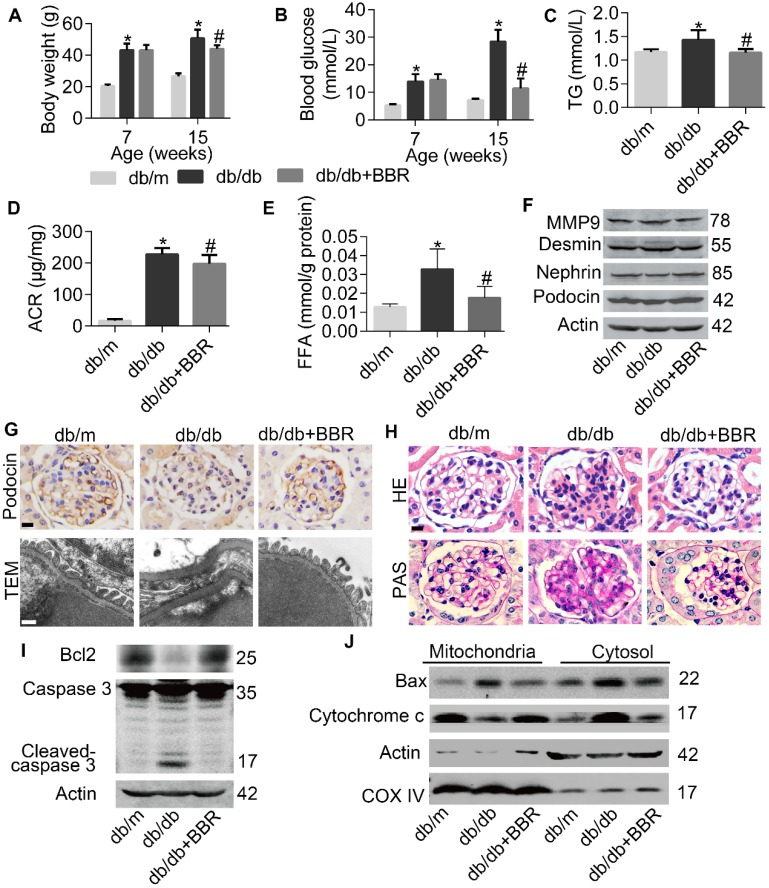
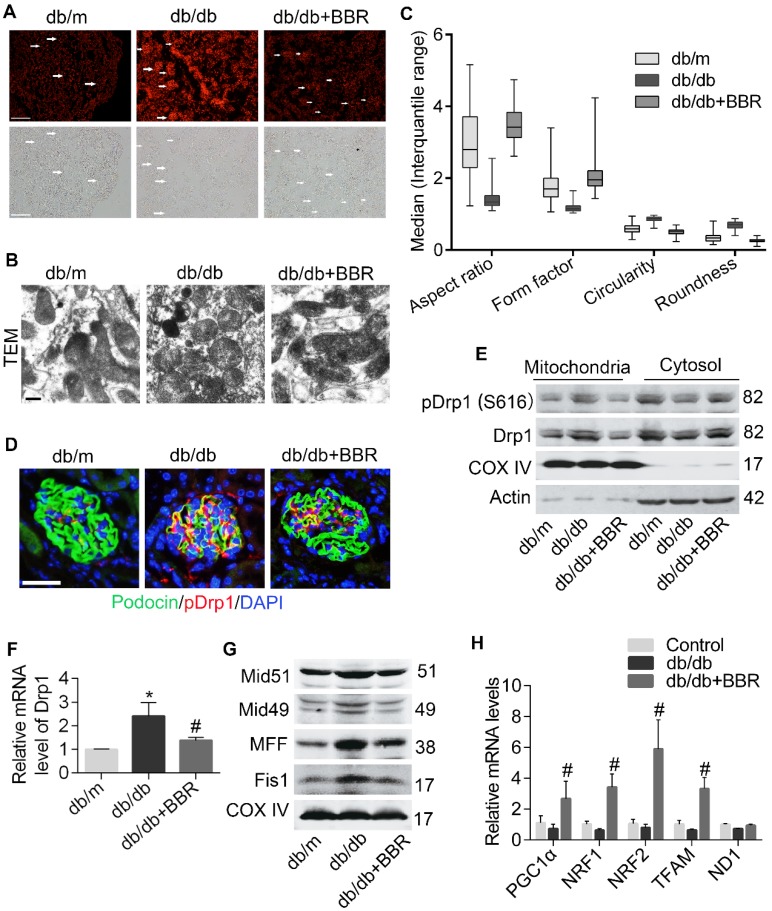
Elevated levels of plasma free fatty acid (FFA) and disturbed mitochondrial dynamics play crucial roles in the pathogenesis of diabetic kidney disease (DKD). However, the mechanisms by which FFA leads to mitochondrial damage in glomerular podocytes of DKD and the effects of Berberine (BBR) on podocytes are not fully understood. Methods: Using the db/db diabetic mice model and cultured mouse podocytes, we investigated the molecular mechanism of FFA-induced disturbance of mitochondrial dynamics in podocytes and testified the effects of BBR on regulating mitochondrial dysfunction, podocyte apoptosis and glomerulopathy in the progression of DKD. Results: Intragastric administration of BBR for 8 weeks in db/db mice significantly reversed glucose and lipid metabolism disorders, podocyte damage, basement membrane thickening, mesangial expansion and glomerulosclerosis. BBR strongly inhibited podocyte apoptosis, increased reactive oxygen species (ROS) generation, mitochondrial fragmentation and dysfunction both in vivo and in vitro. Mechanistically, BBR could stabilize mitochondrial morphology in podocytes via abolishing palmitic acid (PA)-induced activation of dynamin-related protein 1 (Drp1). Conclusions: Our study demonstrated for the first time that BBR may have a previously unrecognized role in protecting glomerulus and podocytes via positively regulating Drp1-mediated mitochondrial dynamics. It might serve as a novel therapeutic drug for the treatment of DKD.

Keywords: Berberine; diabetic kidney disease; dynamin-related protein 1; mitochondrial fission; podocyte.


Conflict of interest statement

Competing Interests: The authors have declared that no competing interest exists.

Figures

Figure 1
Figure 1
Effects of BBR on PA-induced podocyte injury and apoptosis. (A) SDs and markers of podocyte dedifferentiation were analyzed by fluorescence microscopy. Nephrin, red; Podocin, green; Desmin, red; MMP-9, green. Scale bars, 50 μm. (B) Western blotting of SDs and markers of podocyte dedifferentiation. (C) Cell apoptosis was assessed by flow cytometry after annexin V/PI staining. Annexin Ⅴ positive cells indicate early apoptosis. (D) Cell apoptosis related condensation of chromatin in nucleus and autophage were observed using TEM. Arrows indicate the condensation of chromatin; * indicates autophagosomes. Scale bars, 1 μm. (E) Levels of apoptotic protein caspase 3 and antiapoptotic protein Bcl2 in podocytes by western blotting. (F) Western blots of Bax and cytochrome c in mitochondria and cytosol. Error bars represent mean ± SEM. *P < 0.05 vs. Control; #P < 0.05 vs. PA. BBR, Berberine; PA, palmitate; SDs, slit diaphragm proteins; MMP-9, matrix metalloproteinase-9; TEM, transmission electron microscope.
Figure 2
Figure 2
BBR inhibited PA-induced mtROS production and mitochondrial dysfunction in podocytes. (A, B) Cellular ROS production was detected by fluorescence microscopy (A) and flow cytometry (B) after DCFH-DA staining. Scale bar, 200 μm. (C, D) MMP was detected by fluorescence microscopy (C) and flow cytometry (D) after JC-1 staining. Scale bar, 200 μm. (E) ATP content were assayed in cells of different conditions. (F) MDA content was measured in podocytes. Error bars represent mean ± SEM. *P < 0.05 vs. Control; #P < 0.05 vs. PA. BBR, Berberine; PA, palmitate; ROS, mitochondrial reactive oxygen species; NDGA, nordihydroguaiaretic acid; NAC, N-acetylcysteine; DCF, dichlorofluorescein; MMP, mitochondrial membrane potential; ATP, adenosine triphosphate; MDA, malondialdehyde.
Figure 3
Figure 3
BBR inhibited PA-induced mitochondrial fragmentation in podocytes. (A) Mitochondrial morphology was observed by TEM and assessed by aspect ratio and form factor using Image J from three independent experiments (>100 mitochondria). Scale bars, 500 nm. (B) Aspect ratio, form factor, circularity, and roundness were quantified for each condition (>100 mitochondria). (C) Feret's diameter that reflects the longitudinal mitochondrial length was measured by Image J analysis (>100 mitochondria). (D) Quantification of the mitochondrial morphology shown in (E) by Image J analysis from three independent experiments (>500 mitochondria). (E) Mitochondria were stained by MitoTracker Red and imaged by laser scanning confocal microscopy. Scale bars, 10 μm. Error bars represent mean ± SEM, except morphological parameters of mitochondria shown as the median (interquartile range). *P < 0.05 vs. Control; #P < 0.05 vs. PA. BBR, Berberine; PA, palmitate; TEM, transmission electron microscope.
Figure 4
Figure 4
BBR prohibited PA-induced mitochondrial fission via regulating Drp1 in podocytes. (A) Immunofluorescence of MitoTracker and pDrp1 (S616). MitoTracker, red; pDrp1 (S616), green; DAPI, blue; merge, yellow. Scale bars, 10 μm. (B) Western blotting of Drp1 and pDrp1 (S616) protein expression in mitochondria and cytosol. (C) Gene expression of Drp1 was determined by RT-PCR. (D) Mitochondrial fission-related gene expression profile in podocytes. (E) Western blots showing the levels of mitochondrial fission-related proteins. (F) Mitochondrial biogenesis-related gene expression in podocytes. Error bars represent mean ± SEM. *P < 0.05 vs. Control; #P < 0.05 vs. PA. BBR, Berberine; PA, palmitate; Drp1, dynamin-related protein 1; RT-PCR, quantitative real-time PCR; Mid51 and Mid49, mitochondrial dynamics proteins of 51 and 49 kDa; Fis1, mitochondrial fission protein 1; MFF, mitochondrial fission protein; PGC1α, peroxisome proliferator-activated receptor-γ co-activator 1α; TFAM, transcription factor A, mitochondrial; NRF1 and NRF2, nuclear respiratory factors 1 and 2.
Figure 5
Figure 5
Upregulation and downregulation of Drp1 blunted and enhanced the effects of BBR on cell injury and apoptosis in PA-treated podocytes respectively. (A) Effects of Drp1 upregulation and downregulation on PA-induced podocyte injury in the presence or absence of BBR. Podocin (left panel) and desmin (right panel) protein expression were detected by fluorescence microscopy. Podocin, green; Desmin, red. Scale bars, 200 μm. (B) Western blots indicating Drp1 upregulation (right panel) and downregulation (right panel) blunted and enhanced the effects of BBR on PA-induced podocyte injury respectively. (C) Effects of Drp1 upregulation (upper panel) and downregulation (lower panel) on PA-induced apoptosis in the presence or absence of BBR were measured by flow cytometry. (D) Effects of Drp1 upregulation (left panel) and downregulation (right panel) on podocyte apoptosis. Protein expression of apoptotic family members were detected by western blotting. (E) Cell apoptosis-associated Bax and cytochrome c levels in mitochondria and cytosol were assessed by western blotting after Drp1 upregulation (left panel) and downregulation (right panel). Error bars represent mean ± SEM. *P < 0.05 vs. Control; #P < 0.05 vs. PA. BBR, Berberine; PA, palmitate; MMP-9, matrix metalloproteinase-9; Drp1, dynamin-related protein 1; LV, lentivirus; si, si RNA.
Figure 6
Figure 6
The effects of BBR on mitochondrial fission in PA-treated podocytes were blunted and enhanced by Drp1 upregulation and downregulation respectively. (A) Upregulation and downregulation of Drp1 blunted and enhanced the effects of BBR on cellular ROS production in PA-treated podocytes respectively, assessed by flow cytometry. (B) The effects of BBR on ATP production in PA-treated podocytes was blunted and enhanced by upregulation and downregulation of Drp1 respectively. (C) The effects of BBR on mitochondrial membrane potential in PA-treated podocytes were blunted and enhanced by upregulation and downregulation of Drp1 respectively, measured by flow cytometry. (D) The effects of BBR on mitochondrial morphology after upregulation and downregulation of Drp1 was observed by TEM. Scale bars, 500 nm. (E) The effects of BBR on mitochondrial morphology after upregulation and downregulation of Drp1 was visualized by MitoTracker Red. Scale bars, 10 μm (F) Western blotting of Drp1 and pDrp1 (S616) protein expression in cytosol and mitochondria after upregulation and downregulation of Drp1. Error bars represent mean ± SEM. *P < 0.05 vs. Control; #P < 0.05 vs. PA. BBR, Berberine; PA, palmitate; Drp1, dynamin-related protein 1; ROS, reactive oxygen species; DCF, dichlorofluorescein; LV, lentivirus; si, si RNA; ATP, adenosine triphosphate; TEM, transmission electron microscope.
Figure 7
Figure 7
BBR prevented progression of DKD in db/db mice. (A) Body weight of mice before and after intervention. (B) Fasting blood glucose at two points. (C) Blood TG in different groups. (D) Microalbumin-to-creatinine ratios (ACR) in different groups. (E) FFA levels in kidney glomeruli from different groups. (F) SDs and markers of podocyte injury in kidney glomeruli were detected by western blotting. (G) Podocin staining of podocytes (row 1) and TEM of podocyte foot processes and glomerular basement membrane (row 2). Scale bars, 10μm for row 1, 500 nm for row 2. (H) Representative micrographs of HE (row 1) and PAS (row 2)-stained kidney sections from different groups treated with or without BBR. Scale bars, 10 μm for row 1 and 2; (I) Levels of apoptotic family members in glomerular podocytes were detected by western blotting. (J) Western blotting reflected the levels of Mitochondrial and cytoplasmic Bax and cytochrome c in glomerular podocytes. Error bars represent mean ± SEM. *P < 0.05 vs. db/m; #P < 0.05 vs. db/db. BBR, berberine; TG, triglyceride; ACR, microalbumin-to-creatinine ratios; FFA, free fatty acids; DKD, diabetic kidney disease; HE, hematoxylin-eosin; PAS, periodic acid-schiff. SDs, slit diaphragm proteins; TEM, transmission electron micrographs.
Figure 8
Figure 8
BBR attenuated Drp1-mediated mitochondrial fission in db/db mice. (A) The ROS content in glomeruli were measured by DHE staining. Arrows indicate the glomeruli. Scale bars, 200 μm. (B, C) Mitochondrial morphology in glomerular podocytes was observed by TEM (B) and quantified by image j (C), as reflected by aspect ratio, form factor, circularity, and roundness. A minimum of 50 glomeruli in three sections per animal were assessed (n = 5-8/group, >100 mitochondria). Scale bars, 500 nm. (D) Immunofluorescence of kidney sections stained with podocin (green) and pDrp1 (S616) (red). Nuclei were counterstained with DAPI (blue). Scale bars, 50 μm. (E) Western blotting of Drp1 and pDrp1 (S616) protein expression in glomerular podocytes. (F) Gene expression of Drp1 was determined in kidney glomeruli. (G) The changes of mitochondrial fission-related proteins in kidney glomeruli were assessed by western blotting. (H) Mitochondrial biogenesis-related gene expression in kidney glomeruli. Error bars represent mean ± SEM, except morphological parameters of mitochondria shown as the median (interquartile range). *P < 0.05 vs. db/m; #P < 0.05 vs. db/db. BBR, berberine; ROS, reactive oxygen species; DHE, dihydroethidium; Drp1, dynamin-related protein 1; TEM, transmission electron micrograph; Mid51 and Mid49, mitochondrial dynamics proteins of 51 and 49 kDa; Fis1, mitochondrial fission protein 1; MFF, mitochondrial fission protein; PGC1α, peroxisome proliferator-activated receptor-γ co-activator 1α; TFAM, transcription factor A, mitochondrial; NRF1 and NRF2, nuclear respiratory factors 1 and 2.

References

    1. Chan DC. Fusion and fission: interlinked processes critical for mitochondrial health. Annu Rev Genet. 2012;46:265–87. - PubMed
    1. Tilokani L, Nagashima S, Paupe V. et al. Mitochondrial dynamics: overview of molecular mechanisms. Essays Biochem. 2018;62:341–60. - PMC - PubMed
    1. Shirihai OS, Song M, Dorn GW 2nd. How mitochondrial dynamism orchestrates mitophagy. Circ Res. 2015;116:1835–49. - PMC - PubMed
    1. Youle RJ, van der Bliek AM. Mitochondrial fission, fusion, and stress. Science. 2012;337:1062–5. - PMC - PubMed
    1. Smirnova E, Griparic L, Shurland DL. et al. Dynamin-related protein Drp1 is required for mitochondrial division in mammalian cells. Mol Biol Cell. 2001;12:2245–56. - PMC - PubMed

Publication types