

Composition-Tunable Ultrasmall Manganese Ferrite Nanoparticles: Insights into their In Vivo T1 Contrast Efficacy
- PMID: 31037137
- PMCID: PMC6485191
- DOI: 10.7150/thno.31233
Composition-Tunable Ultrasmall Manganese Ferrite Nanoparticles: Insights into their In Vivo T1 Contrast Efficacy
Abstract
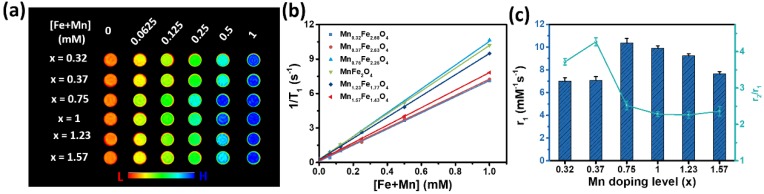
The development of a highly efficient, low-toxicity, ultrasmall ferrite nanoparticle-based T1 contrast agent for high-resolution magnetic resonance imaging (MRI) is highly desirable. However, the correlations between the chemical compositions, in vitro T1 relaxivities, in vivo nano-bio interactions and toxicities remain unclear, which has been a challenge in optimizing the in vivo T1 contrast efficacy. Methods: Ultrasmall (3 nm) manganese ferrite nanoparticles (MnxFe3-xO4) with different doping concentrations of the manganese ions (x = 0.32, 0.37, 0.75, 1, 1.23 and 1.57) were used as a model system to investigate the composition-dependence of the in vivo T1 contrast efficacy. The efficacy of liver-specific contrast-enhanced MRI was assessed through systematic multiple factor analysis, which included the in vitro T1 relaxivity, in vivo MRI contrast enhancement, pharmacokinetic profiles (blood half-life time, biodistribution) and biosafety evaluations (in vitro cytotoxicity testing, in vivo blood routine examination, in vivo blood biochemistry testing and H&E staining to examine the liver). Results: With increasing Mn doping, the T1 relaxivities initially increased to their highest value of 10.35 mM-1s-1, which was obtained for Mn0.75Fe2.25O4, and then the values decreased to 7.64 m M-1s-1, which was obtained for the Mn1.57Fe1.43O4 nanoparticles. Nearly linear increases in the in vivo MRI signals (ΔSNR) and biodistributions (accumulation in the liver) of the MnxFe3-xO4 nanoparticles were observed for increasing levels of Mn doping. However, both the in vitro and in vivo biosafety evaluations suggested that MnxFe3-xO4 nanoparticles with high Mn-doping levels (x > 1) can induce significant toxicity. Conclusion: The systematic multiple factor assessment indicated that the MnxFe3-xO4 (x = 0.75-1) nanoparticles were the optimal T1 contrast agents with higher in vivo efficacies for liver-specific MRI than those of the other compositions of the MnxFe3-xO4 nanoparticles. Our work provides insight into the optimization of ultrasmall ferrite nanoparticle-based T1 contrast agents by tuning their compositions and promotes the translation of these ultrasmall ferrite nanoparticles for clinical use of high-performance contrast-enhanced MRI.
Keywords: MRI; composition effect; in vivo T1 contrast efficacy; ultrasmall ferrite nanoparticles.
Conflict of interest statement
Competing Interests: The authors have declared that no competing interest exists.
Figures


References
-
- Kim BH, Lee N, Kim H, An K, Park YI, Choi Y. et al. Large-scale synthesis of uniform and extremely small-sized iron oxide nanoparticles for high-resolution T1 magnetic resonance imaging contrast agents. J Am Chem Soc. 2011;133:12624–31. - PubMed
-
- Li Z, Yi PW, Sun Q, Lei H, Li Zhao H, Zhu ZH. et al. Ultrasmall water-soluble and biocompatible magnetic iron oxide nanoparticles as positive and negative dual contrast agents. Adv Funct Mater. 2012;22:2387–93.
-
- Lu Y, Xu YJ, Zhang GB, Ling D, Wang MQ, Zhou Y. et al. Iron oxide nanoclusters for T1 magnetic resonance imaging of non-human primates. Nat Biomed Eng. 2017;1:637–43. - PubMed
-
- Taboada E, Rodrı´guez E, Roig A, Oro´ J, Roch A, Muller RN. Relaxometric and magnetic characterization of ultrasmall iron oxide nanoparticles with high magnetization evaluation as potential T1 magnetic resonance imaging contrast agents for molecular imaging. Langmuir. 2007;23:4583–8. - PubMed
-
- Tromsdorf UI, Bruns OT, Salmen SC, Beisiegel U, Weller H. A highly effective, nontoxic T1 MR contrast agent based on ultrasmall PEGylated iron oxide nanoparticles. Nano Lett. 2009;9:4434–40. - PubMed
Publication types
MeSH terms
Substances
LinkOut - more resources
Full Text Sources
Other Literature Sources
Medical
Research Materials
Miscellaneous
