. 2020 Jan;11(1):1-22.
doi: 10.1007/s13238-019-0623-2. Epub 2019 Apr 30.

Rescue of premature aging defects in Cockayne syndrome stem cells by CRISPR/Cas9-mediated gene correction

Affiliations

Rescue of premature aging defects in Cockayne syndrome stem cells by CRISPR/Cas9-mediated gene correction

Si Wang et al. Protein Cell. 2020 Jan.

Erratum in

Abstract

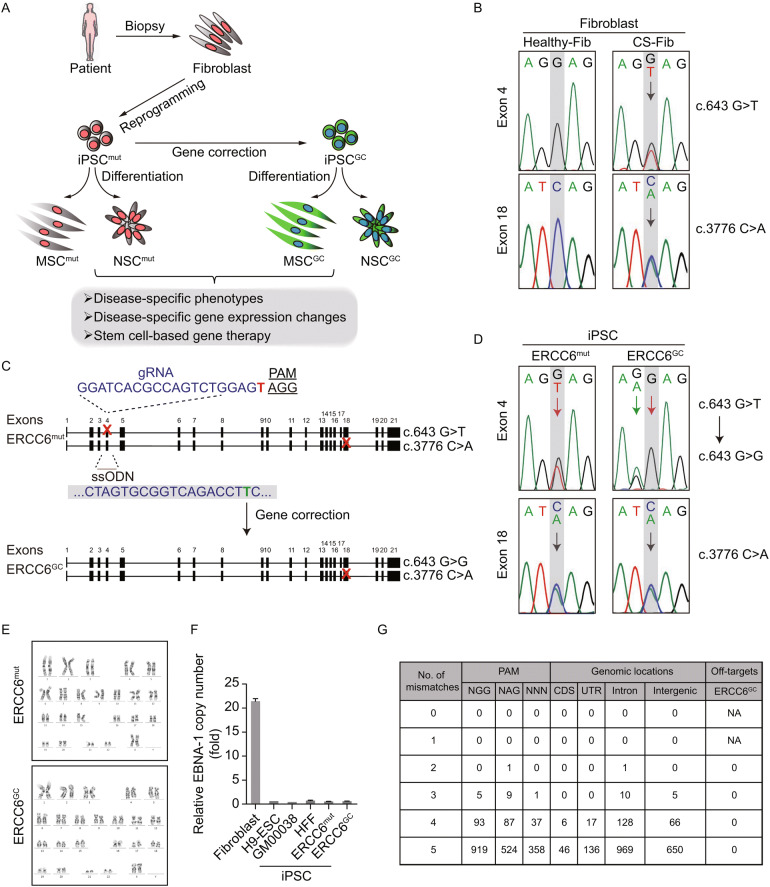
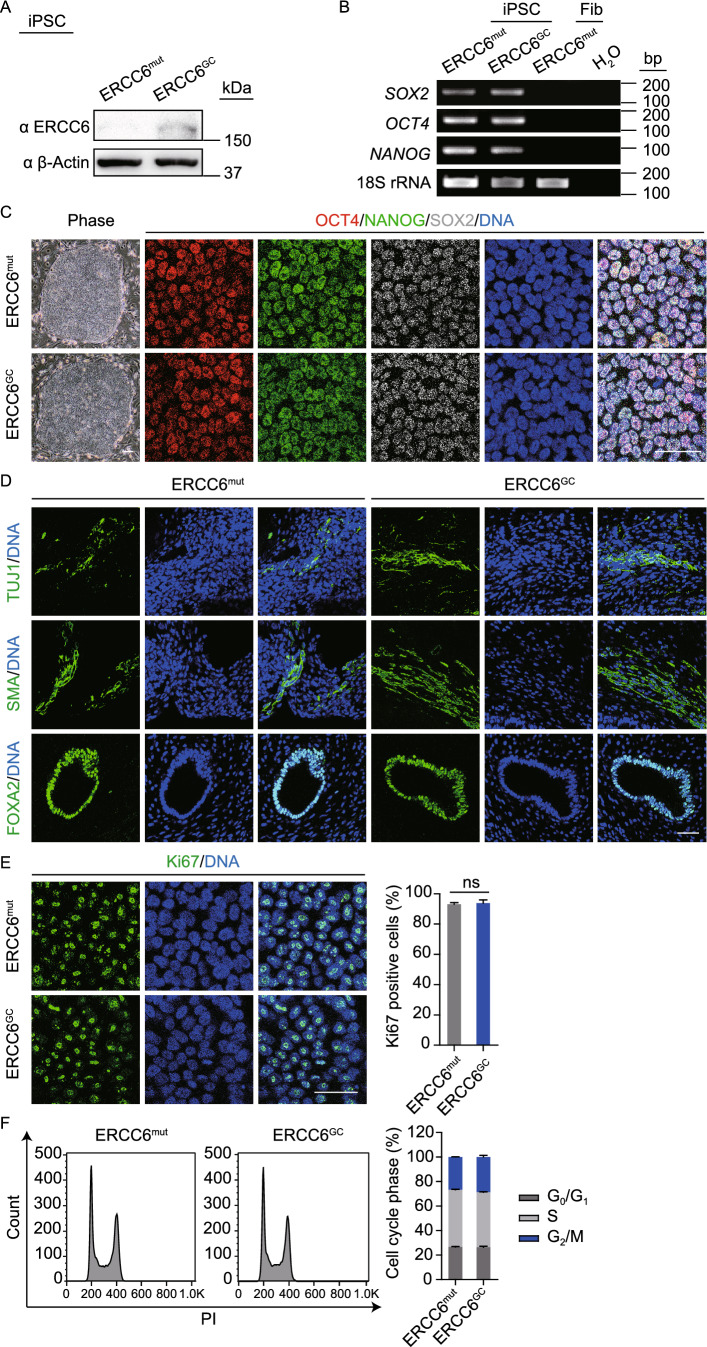
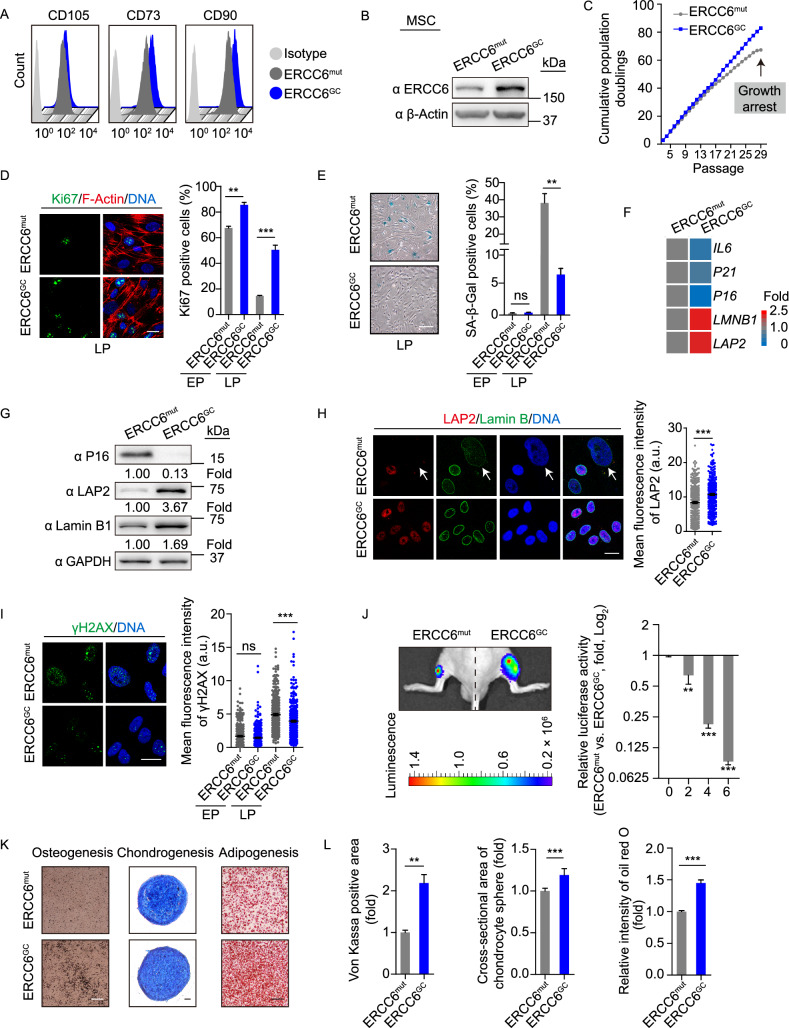
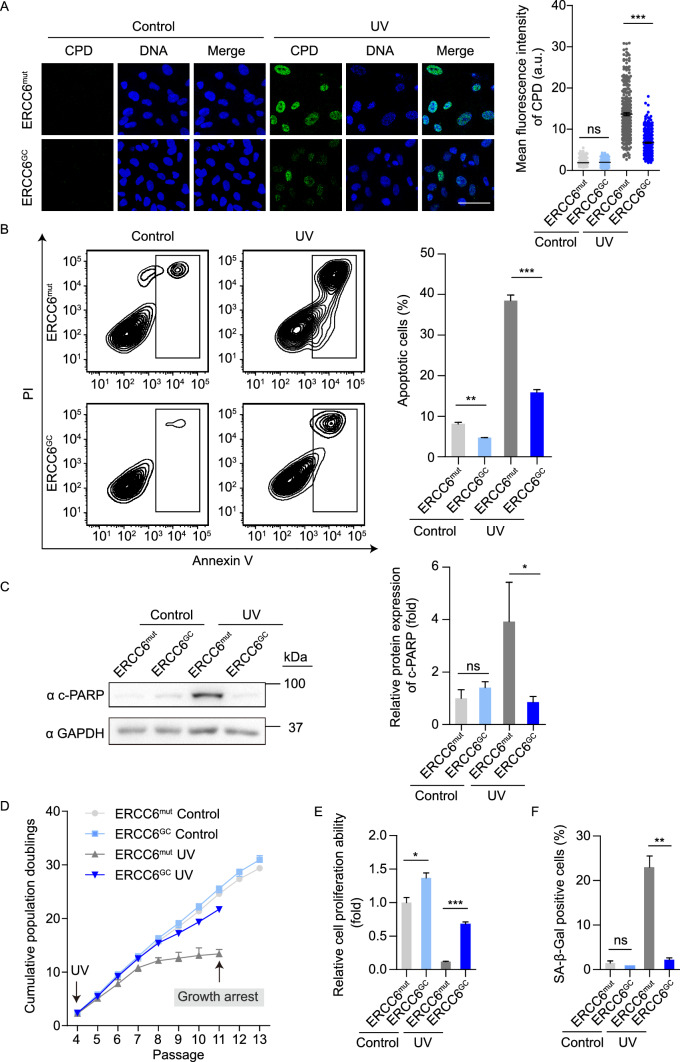
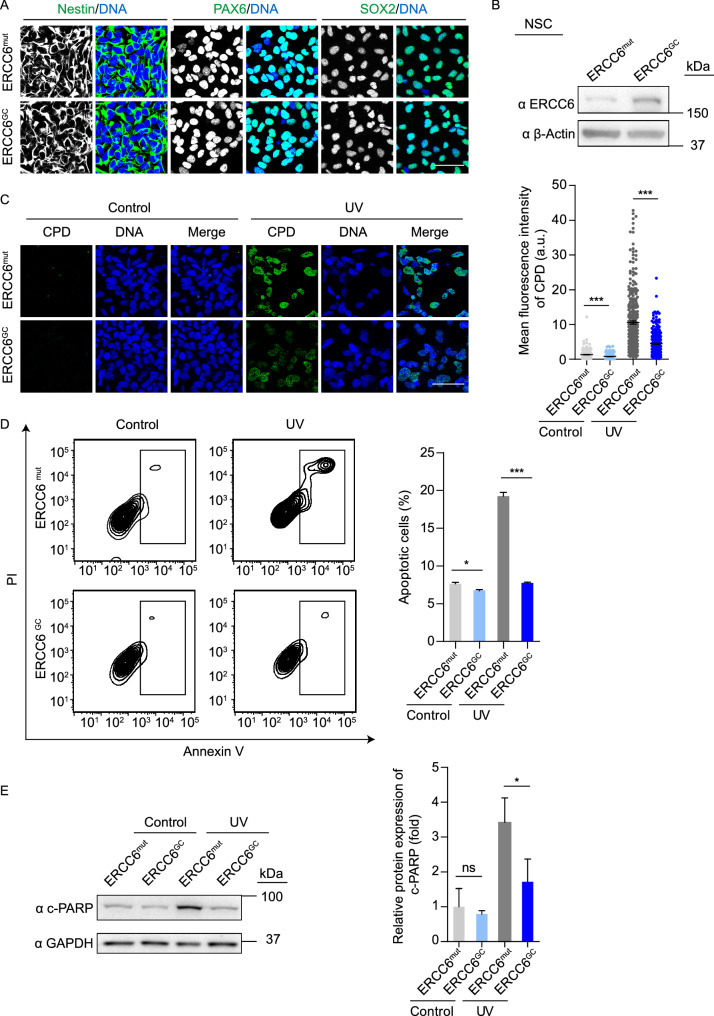
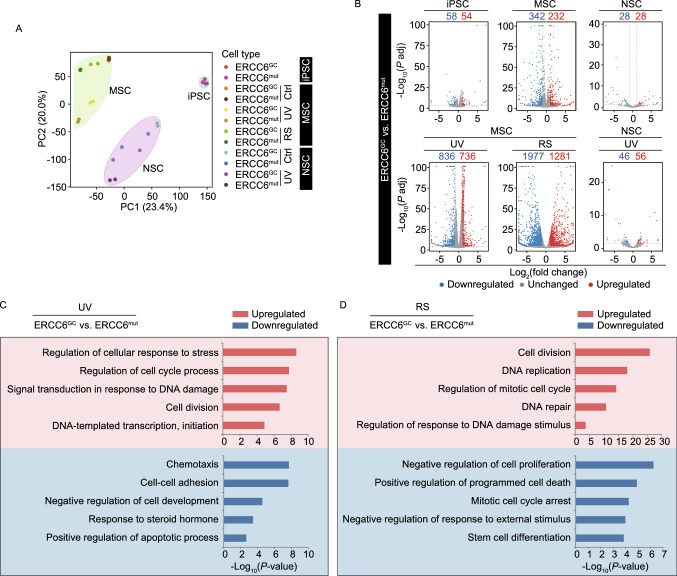
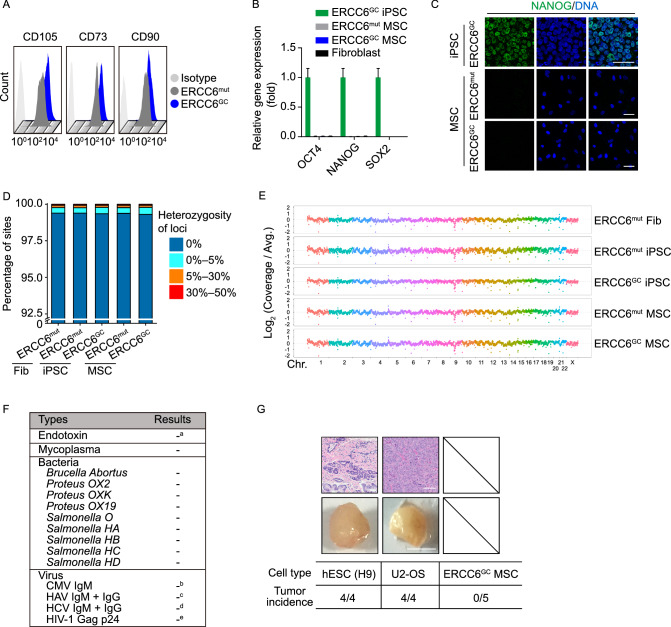
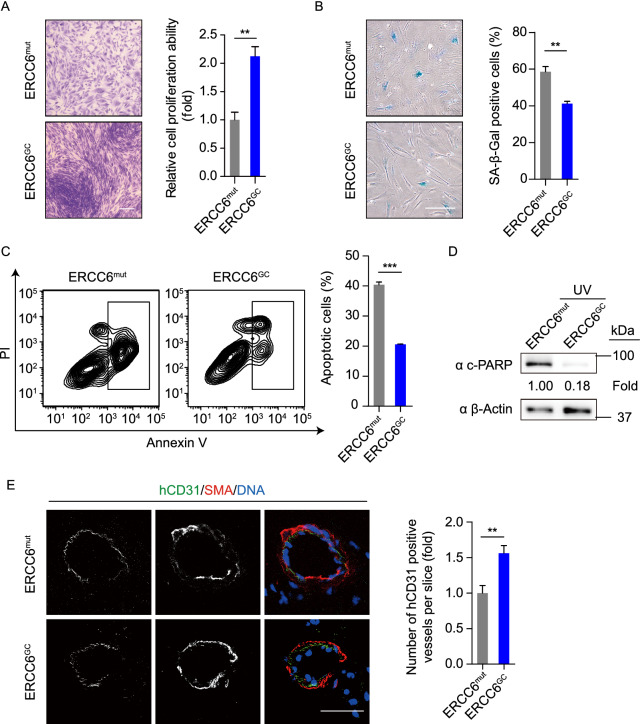
Cockayne syndrome (CS) is a rare autosomal recessive inherited disorder characterized by a variety of clinical features, including increased sensitivity to sunlight, progressive neurological abnormalities, and the appearance of premature aging. However, the pathogenesis of CS remains unclear due to the limitations of current disease models. Here, we generate integration-free induced pluripotent stem cells (iPSCs) from fibroblasts from a CS patient bearing mutations in CSB/ERCC6 gene and further derive isogenic gene-corrected CS-iPSCs (GC-iPSCs) using the CRISPR/Cas9 system. CS-associated phenotypic defects are recapitulated in CS-iPSC-derived mesenchymal stem cells (MSCs) and neural stem cells (NSCs), both of which display increased susceptibility to DNA damage stress. Premature aging defects in CS-MSCs are rescued by the targeted correction of mutant ERCC6. We next map the transcriptomic landscapes in CS-iPSCs and GC-iPSCs and their somatic stem cell derivatives (MSCs and NSCs) in the absence or presence of ultraviolet (UV) and replicative stresses, revealing that defects in DNA repair account for CS pathologies. Moreover, we generate autologous GC-MSCs free of pathogenic mutation under a cGMP (Current Good Manufacturing Practice)-compliant condition, which hold potential for use as improved biomaterials for future stem cell replacement therapy for CS. Collectively, our models demonstrate novel disease features and molecular mechanisms and lay a foundation for the development of novel therapeutic strategies to treat CS.

Keywords: CRISPR/Cas9; Cockayne syndrome; disease modelling; gene correction; mesenchymal stem cell; neural stem cell.


Figures

Figure 1
Figure 1
Generation of CS-iPSCs and gene-corrected CS-iPSCs. (A) Schematic diagram of the generation of CS-iPSCs and GC-iPSCs, as well as their adult stem cell derivatives, for modelling Cockayne syndrome. “Mut” represents mutant, “GC” represents gene corrected. (B) Genotype validation of two heterozygous mutations in the ERCC6 gene by genomic DNA sequencing. Fibroblasts isolated from a healthy individual were used as a control. (C) Strategy for correcting the ERCC6+/G643T mutation by the CRISPR/Cas9 system. The sequence of the gRNA is shown with the PAM sequence. Red crosses represent mutations in exon 4 and exon 18. The single-stranded oligodeoxynucleotide (ssODN) carrying a silent mutation (marked in green) was used as a repair template. (D) The correction of the ERCC6+/G643T mutation was verified by genomic DNA sequencing. The red arrow highlights the corrected base pair. The green arrow indicates the inclusion of silent mutation introduced by the exogenous ssODN template. ERCC6mut represents CS-iPSCs, ERCC6GC represents GC-iPSCs. (E) Karyotyping analysis of CS-iPSCs and GC-iPSCs indicating their normal karyotypes. (F) No residual episomal vector element EBNA-1 was observed in CS-iPSCs or GC-iPSCs by qPCR analysis. CS-fibroblasts were electroporated with pCXLE-hOCT3/4-shp53-F, pCXLE-hSK and pCXLE-hUL. The fibroblasts were cultured for 4 more days after electroporation and then collected as the positive control, and human ESCs (line H9), GM00038-iPSCs and HFF-iPSCs were used as negative controls. Data are shown as the mean ± SEM, n = 3. (G) No off-target mutations were observed in GC-iPSCs. Whole-genome sequencing was applied to detect potential off-target mutations in the GC-iPSC sample. NA, not applicable
Figure 2
Figure 2
Characterization of CS-iPSCs and gene-corrected CS-iPSCs. (A) Western blot analysis showing increased protein levels of ERCC6 in GC-iPSCs. β-Actin was used as the loading control. (B) RT-PCR analysis of the pluripotency markers SOX2, OCT4, and NANOG in the CS-iPSCs and GC-iPSCs. 18S rRNA was used as the loading control. (C) Immunostaining of CS-iPSCs and GC-iPSCs for the pluripotency markers OCT4, NANOG, and SOX2. Nuclei were stained with Hoechst 33342. Scale bar, 50 μm. (D) Immunostaining of TUJ1 (ectoderm), SMA (mesoderm), and FOXA2 (endoderm) in teratomas derived from CS-iPSCs and GC-iPSCs. Nuclei were stained with Hoechst 33342. Scale bar, 50 μm. (E) The percentages of Ki67-positive cells in CS-iPSCs and GC-iPSCs were determined and compared. Nuclei were stained with Hoechst 33342. Scale bar, 50 μm. Data are presented as the mean ± SEM, n = 3, ns, not significant. (F) Cell cycle profiles showing comparable percentages of different cell cycle phases in CS-iPSCs and GC-iPSCs by PI staining. Data are presented as the mean ± SEM, n = 3
Figure 3
Figure 3
Alleviated cellular senescence in gene-corrected CS-MSCs. (A) FACS analysis indicating the expression of the cell surface markers CD73, CD90 and CD105 in CS-MSCs and GC-MSCs. ERCC6mut represents CS-MSCs, ERCC6GC represents GC-MSCs. (B) Western blot analysis showing increased protein levels of ERCC6 in GC-MSCs. β-Actin was used as the loading control. (C) Growth curves showing the cumulative population doublings of CS-MSCs and GC-MSCs. (D) Immunostaining of Ki67 showing the decreased cell proliferation of CS-MSCs compared to GC-MSCs. The percentages of Ki67-positive cells are shown in the right panel. Scale bar, 20 μm. Data are presented as the mean ± SEM, n = 3, **P < 0.01, ***P < 0.001. EP, early passage (P6); LP, late passage (P28). (E) SA-β-Gal staining of CS-MSCs and GC-MSCs at EP (P6) and LP (P28), respectively. The percentages of SA-β-Gal-positive cells are shown in the right panel. Scale bar, 50 μm. Data are presented as the mean ± SEM, n = 3, **P < 0.01, ns, not significant. (F) RT-qPCR analysis of the expression of senescence markers in CS-MSCs and GC-MSCs at passage 28. The mRNA levels were normalized to CS-MSCs. (G) Western blot analysis of P16, LAP2 and Lamin B1 in CS-MSCs and GC-MSCs. GAPDH was used as the loading control. (H) Immunostaining of LAP2 and Lamin B in CS-MSCs and GC-MSCs. The relative intensity of LAP2 was measured with ImageJ software, and the data are shown as the mean ± SEM, ***P < 0.001. More than 300 nuclei for each group were used for calculations. Scale bar, 20 μm. a.u., arbitrary units. (I) Immunostaining of γH2AX in CS-MSCs and GC-MSCs. The relative intensity of γH2AX was measured with ImageJ software, and the data are shown as the mean ± SEM, ***P < 0.001. More than 300 nuclei for each group were used for calculations. Scale bar, 20 μm. a.u., arbitrary units. (J) Accelerated attrition of CS-MSCs in vivo was detected by an in vivo imaging system (IVIS). CS-MSCs (1 × 10⁶, left) and GC-MSCs (1 × 10⁶, right) (passage 25) infected with luciferase lentivirus were injected into the tibialis anterior (TA) muscles of immunodeficient mice. Luciferase activities were imaged and quantified at days 0, 2, 4, and 6 after transplantation. Data are presented as the ratios of the luciferase intensity of CS-MSCs to that of GC-MSCs (fold), mean ± SD, n = 3, **P < 0.01, ***P < 0.001. (K) Comparative analysis of the osteogenic, chondrogenic and adipogenic differentiation potential of CS-MSCs and GC-MSCs. Von Kossa, Alcian blue, and oil red O staining were used to characterize osteoblasts, chondrocytes, and adipocytes, respectively. Scale bar, 50 μm. (L) The intensity of von Kossa staining was calculated by ImageJ and compared in the left panel. Data are presented as the mean ± SEM, n = 3, **P < 0.01. The cross-sectional area of chondrocyte spheres was measured and is shown in the middle panel. Data are presented as the mean ± SD, n = 14, ***P < 0.001. The relative intensity of oil red O was measured and is shown in the right panel. Data are presented as the mean ± SEM, n = 3, ***P < 0.001
Figure 4
Figure 4
Gene-corrected CS-MSCs display recovered DNA repair ability and counteract UV-induced apoptosis and senescence. (A) CPD immunostaining in CS-MSCs and GC-MSCs in the absence or presence of 10 J/m2 UV exposure. Nuclei were stained with Hoechst 33342. Scale bar, 50 μm. More than 300 nuclei for each group were used for calculation. The data are shown as the mean ± SEM, ns, not significant, ***P < 0.001. a.u., arbitrary units. (B) Apoptosis analysis of CS-MSCs and GC-MSCs at 48 h after 10 J/m2 UV irradiation. Quantitative data are presented as the mean ± SEM, n = 3, **P < 0.01, ***P < 0.001. (C) Western blots showing PARP cleavage in CS-MSCs and GC-MSCs in the absence or presence of 10 J/m2 UV exposure. GAPDH was used as a loading control. Quantitative data are presented as the mean ± SD, n = 3, ns, not significant, *P < 0.05. (D) Growth curves showing the cumulative population doublings of CS-MSCs and GC-MSCs in the absence (control) or presence (UV) of 1 J/m2 UV exposure at each passage starting from passage 4. (E) Clonal expansion assay showing the cell proliferation ability of CS-MSCs and GC-MSCs in the absence (control) or presence (UV) of 1 J/m2 UV exposure at passage 10. The cells were stained with crystal violet after two weeks of culture, and the relative intensity of the crystal violet staining was quantified. Data are presented as the mean ± SEM, n = 3, *P < 0.05, ***P < 0.001. (F) SA-β-Gal staining of CS-MSCs and GC-MSCs in the absence (control) or presence (UV) of 1 J/m2 UV exposure at passage 10. The percentages of SA-β-Gal-positive cells are shown in the right panel. Data are presented as the mean ± SEM, n = 3, **P < 0.01, ns, not significant
Figure 5
Figure 5
Gene-corrected CS-NSCs show increased NER ability and decreased susceptibility to UV-induced apoptosis. (A) Immunostaining of the NSC markers Nestin, PAX6, and SOX2 in the CS-NSCs and GC-NSCs. The nuclei were stained with Hoechst 33342. Scale bar, 50 μm. ERCC6mut represents CS-NSCs, ERCC6GC represents GC-NSCs. (B) Western blot analysis showing increased protein levels of ERCC6 in GC-NSCs. β-Actin was used as the loading control. (C) CPD immunostaining in CS-NSCs and GC-NSCs in the absence or presence of 5 J/m2 UV exposure. Nuclei were stained with Hoechst 33342. Scale bar, 50 μm. Over 300 nuclei were used for calculations. The data are shown as the mean ± SEM, ***P < 0.001. a.u., arbitrary units. (D) Apoptosis analysis of CS-NSCs and GC-NSCs at 48 h after 5 J/m2 UV irradiation. Quantitative data are presented as the mean ± SEM, n = 3, *P < 0.05, ***P < 0.001. (E) Western blots showing PARP cleavage in CS-NSCs and GC-NSCs in the absence or presence of 5 J/m2 UV exposure. GAPDH was used as a loading control. Quantitative data are presented as the mean ± SD, n = 3, *P < 0.05, ns, not significant
Figure 6
Figure 6
The global gene expression profiles of CS-iPSCs and gene-corrected CS-iPSCs and their adult stem cell derivatives. (A) PCA of CS cells and GC cells in the absence or presence of UV (Ctrl or UV), as well as under replicative senescence (RS) stress. Each point represents a sample. Data points were computed based on Log2(FPKM + 1). (B) Volcano plots showing the differentially expressed genes between CS-iPSCs and GC-iPSCs, between CS-MSCs and GC-MSCs, and between CS-NSCs and GC-NSCs in the absence of UV (the upper panel) or in the presence of UV (the lower panel, UV), or under RS stress (the lower panel, RS). Red represents upregulated genes, and blue represents downregulated genes. (C) Gene Ontology Biological Process (GO-BP) enrichment analysis of significantly upregulated/downregulated genes in GC-MSCs compared to CS-MSCs upon UV treatment. Red represents upregulated genes, and blue represents downregulated genes. (D) Gene Ontology Biological Process (GO-BP) enrichment analysis of significantly upregulated/downregulated genes in GC-MSCs compared to CS-MSCs under RS stress. Red represents upregulated genes, and blue represents downregulated genes
Figure 7
Figure 7
Safety analysis of gene-corrected CS-MSCs obtained under a cGMP-compliant condition. (A) FACS analysis indicated the expression of the cell surface markers CD73, CD90 and CD105 in CS-MSCs and GC-MSCs. (B) RT-qPCR analysis of the expression of pluripotency markers OCT4, NANOG, and SOX2 in CS-MSCs and GC-MSCs. GC-iPSCs and CS-fibroblasts were used as positive and negative controls, respectively. Data are presented as the mean ± SEM, n = 3. (C) Immunostaining of the pluripotency marker NANOG in CS-MSCs and GC-MSCs. GC-iPSCs were used as a positive control, Scale bar, 50 μm. (D) Whole-genome sequencing of single-nucleotide variants (SNVs) in CS-fibroblasts, CS-iPSCs, GC-iPSCs, CS-MSCs and GC-MSCs. Sites with a heterozygosity percentage ranging between 0% and 30% were considered as SNV sites, and sites with a heterozygosity of >30% were considered as single-nucleotide polymorphisms (SNPs). (E) Whole-genome sequencing of copy number variations (CNVs) in CS-fibroblasts, CS-iPSCs, GC-iPSCs, CS-MSCs and GC-MSCs. Each point represents normalized coverage depth of each 500-kb genomic region of each chromosome. (F) Sterility and pathogen testing of the conditioned medium of GC-MSCs. a Endotoxin was identified as negative when the concentration was < 0.25 EU/mL. b CMV was identified as negative when the ratio of the OD450 value of sample to the cut-off value (S/Co) was < 1.0. c HAV was identified as negative when the ratio of the cut-off value to the OD450 nm value of the sample (Co/S) was < 0.9. d HCV was identified as negative when the ratio of the OD450 value of the sample to the cut-off value (S/Co) was < 0.9. e HIV-1 was identified as negative when the concentration = 0 pg/mL. (G) Evaluation of the potential tumorigenesis risk of GC-MSCs in vivo. A subcutaneous injection of GC-MSCs was performed in immune-deficient mice. Human ESC (line H9) and U2-OS osteosarcoma cell lines were also implanted independently as positive controls. Representative images in the lower panel showing the teratoma and tumor formed from positive cells two months after transplantation, Scale bar, 0.5 cm. HE staining of a teratoma and tumor were shown in the upper panel. Scale bar, 100 μm. The in vivo tumor-formation incidence of each cell type was calculated. n = 4 for each positive cell group, n = 5 for the GC-MSC group
Figure 8
Figure 8
Gene-corrected CS-MSCs generated under a cGMP-compliant condition displayed alleviated aging defects and decreased susceptibility to UV-induced apoptosis. (A) Clonal expansion assay showing the cell proliferation ability of CS-MSCs and GC-MSCs. The cells were stained with crystal violet after a two-week culture, and the relative intensity of the crystal violet was quantified. Data are presented as the mean ± SEM, n = 4, **P < 0.01. Scale bar, 50 μm. (B) SA-β-Gal staining of CS-MSCs and GC-MSCs. The percentages of SA-β-Gal-positive cells are shown in the right panel. Data are presented as the mean ± SEM, n = 3, **P < 0.01. Scale bar, 50 μm. (C) Apoptosis analysis of CS-MSCs and GC-MSCs 48 h after 10 J/m2 UV irradiation. Quantitative data are presented as the mean ± SEM, n = 3, ***P < 0.001. (D) Western blots showing PARP cleavage of CS-MSCs and GC-MSCs in the presence of 10 J/m2 UV exposure. β-Actin was used as a loading control. (E) Fat pad transplantation with CS-MSCs and GC-MSCs. Left: representative immunofluorescent images showing neovascularization; right: the number of hCD31-positive vessels calculated based on 24 slices from inconsecutive frozen sections. Data are presented as the mean ± SD, n = 3 for each group, **P < 0.01. Scale bar, 50 μm

Similar articles

Cited by

References

    1. Amaro-Ortiz A, Yan B, D’Orazio JA. Ultraviolet radiation, aging and the skin: prevention of damage by topical cAMP manipulation. Molecules. 2014;19:6202–6219. - PMC - PubMed
    1. Anders S, Pyl PT, Huber W. HTSeq: a Python framework to work with high-throughput sequencing data. Bioinformatics. 2015;31:166–169. - PMC - PubMed
    1. Andrade LN, Nathanson JL, Yeo GW, Menck CF, Muotri AR. Evidence for premature aging due to oxidative stress in iPSCs from Cockayne syndrome. Hum Mol Genet. 2012;21:3825–3834. - PMC - PubMed
    1. Andressoo JO, Mitchell JR, de Wit J, Hoogstraten D, Volker M, Toussaint W, Speksnijder E, Beems RB, van Steeg H, Jans J, et al. An Xpd mouse model for the combined xeroderma pigmentosum/Cockayne syndrome exhibiting both cancer predisposition and segmental progeria. Cancer Cell. 2006;10:121–132. - PubMed
    1. Bae S, Park J, Kim JS. Cas-OFFinder: a fast and versatile algorithm that searches for potential off-target sites of Cas9 RNA-guided endonucleases. Bioinformatics. 2014;30:1473–1475. - PMC - PubMed

Publication types

MeSH terms