

Geographic distribution and determinants of mental health stigma in central Mozambique
- PMID: 31037541
- PMCID: PMC6821573
- DOI: 10.1007/s00127-019-01708-8
Geographic distribution and determinants of mental health stigma in central Mozambique
Abstract
Purpose: This study describes patterns of community-level stigmatizing attitudes towards mental illness (MI) in central Mozambique.
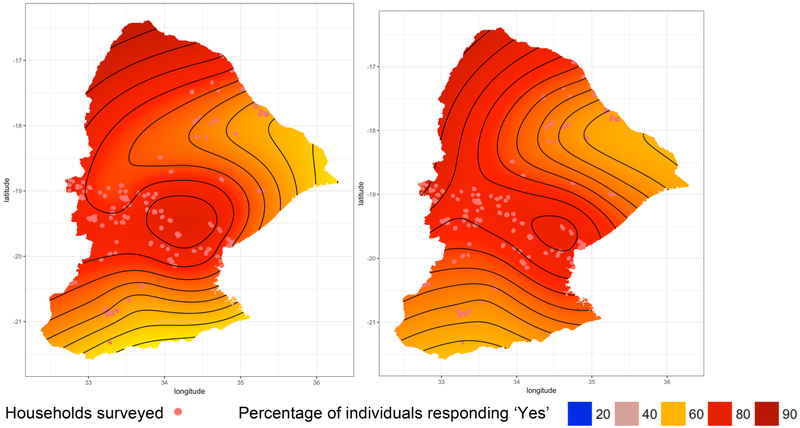
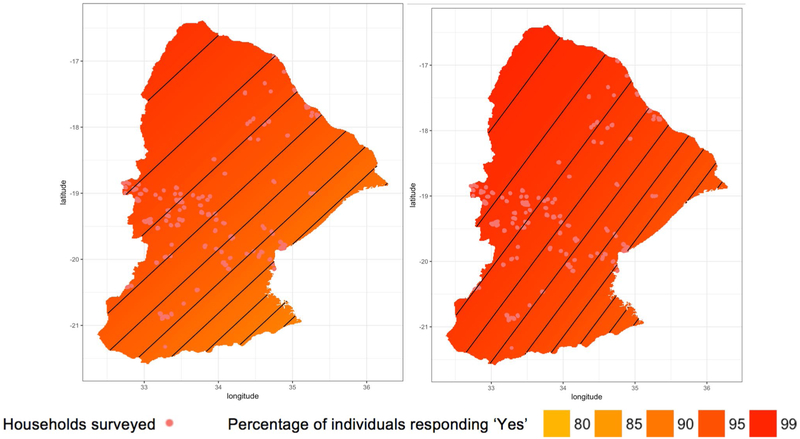
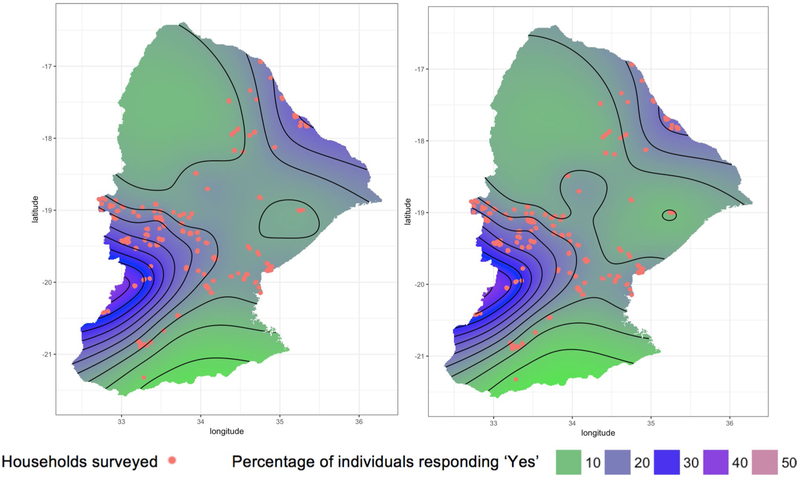
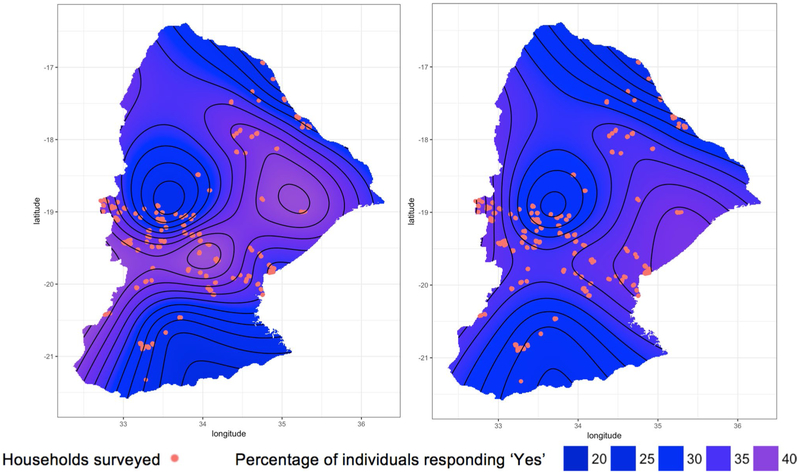
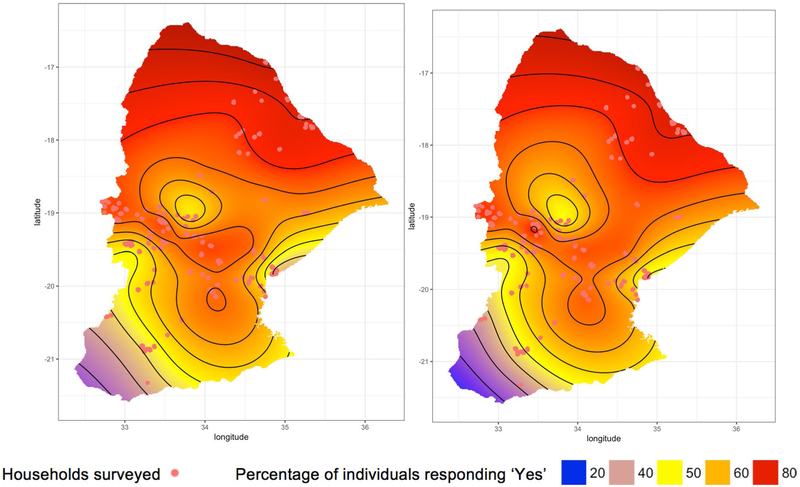
Methods: Data for this study come from a representative community household survey of 2933 respondents ≥ 18 years old in Manica and Sofala Provinces, Mozambique. Six MI stigma questions represented primary research outcomes. Bivariate and multivariable analyses examined the relationship between key explanatory factors and each stigma question. Spatial analyses analyzed the smoothed geographic distribution of responses to each question and explored the association between geographic location and MI stigma controlling for individual-level socio-demographic factors.
Results: Stigmatizing attitudes towards MI are prevalent in central Mozambique. Analyses showed that males, people who live in urban places, divorced and widowed individuals, people aged 18-24, people with lower education, people endorsing no religion, and people in lower wealth quintiles tended to have significantly higher levels of stigmatizing attitudes towards MI. Individuals reporting depressive symptoms scored significantly higher on stigmatizing questions, potentially indicating internalized stigma. Geographic location is significantly associated with people's response to five of the stigma questions even after adjusting for individual-level factors.
Conclusion: Stigmatizing attitudes towards MI are common in central Mozambique and concentrated amongst specific socio-demographic groups. However, geographic analyses suggest that structural factors within communities and across regions may bear a greater influence on MI stigma than individual-level factors alone. Further implementation science should consider focusing on identifying the most significant modifiable structural factors associated with MI stigma in LMICs to inform the development, testing, and optimization of multi-level stigma prevention interventions.
Keywords: Determinants of stigma; Geographic information systems; MI stigma; Mozambique; Spatial analysis.
Conflict of interest statement
Figures

References
-
- Bass JK, Bornemann TH, Burkey M, Chehil S, Chen L, Copeland JR, Eaton WW, Ganju V, Hayward E, Hock RS, Kidwai R, Kolappa K, Lee PT, Minas H, Or F, Raviola GJ, Saraceno B, Patel V (2012) A United Nations General Assembly Special Session for mental, neurological, and substance use disorders: the time has come. PLoS Med 9(1):e1001159 10.1371/journal.pmed.1001159 - DOI - PMC - PubMed
-
- Disease GBD, Injury I, Prevalence C (2017) Global, regional, and national incidence, prevalence, and years lived with disability for 328 diseases and injuries for 195 countries, 1990–2016: a systematic analysis for the Global Burden of Disease Study 2016. Lancet 390(10100):1211–1259. 10.1016/S0140-6736(17)32154-2 - DOI - PMC - PubMed
-
- DALYs GBD, Collaborators H (2017) Global, regional, and national disability-adjusted life-years (DALYs) for 333 diseases and injuries and healthy life expectancy (HALE) for 195 countries and territories, 1990–2016: a systematic analysis for the Global Burden of Disease Study 2016. Lancet 390(10100):1260–1344. 10.1016/S0140-6736(17)32130-X - DOI - PMC - PubMed
MeSH terms
Grants and funding
LinkOut - more resources
Full Text Sources
Medical
