. 2019 Apr 30;17(4):e3000228.
doi: 10.1371/journal.pbio.3000228. eCollection 2019 Apr.

G1/S cell cycle regulators mediate effects of circadian dysregulation on tumor growth and provide targets for timed anticancer treatment

Affiliations

G1/S cell cycle regulators mediate effects of circadian dysregulation on tumor growth and provide targets for timed anticancer treatment

Yool Lee et al. PLoS Biol. .

Abstract

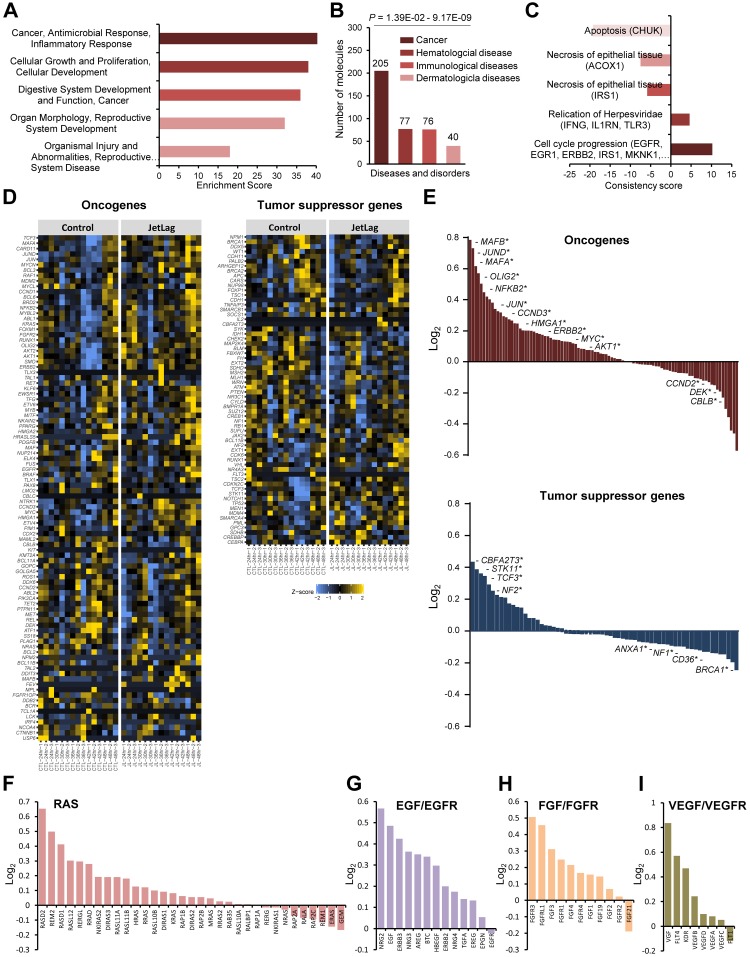
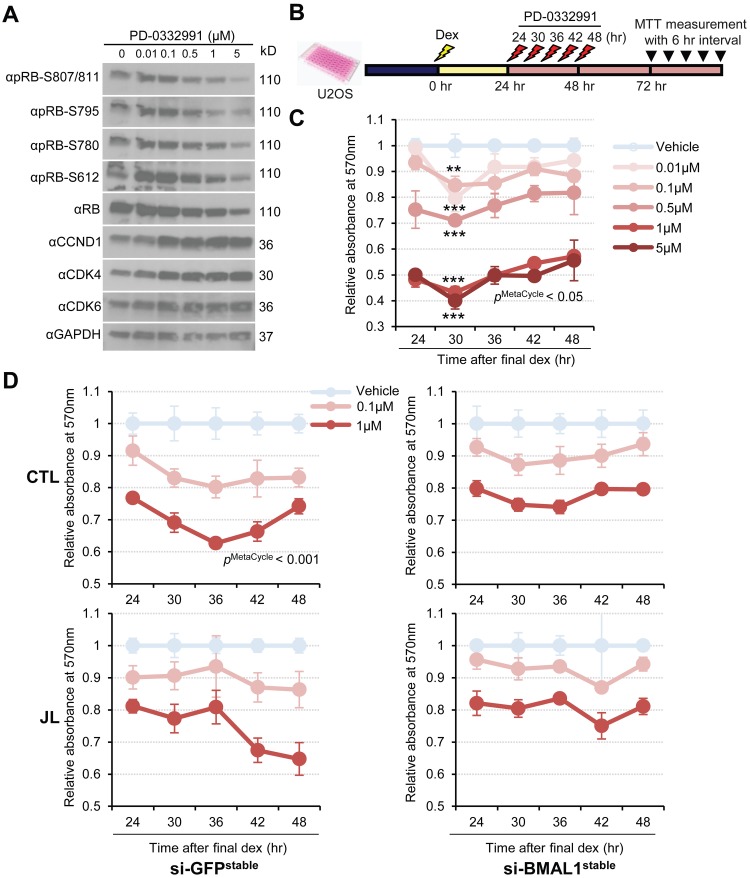
Circadian disruption has multiple pathological consequences, but the underlying mechanisms are largely unknown. To address such mechanisms, we subjected transformed cultured cells to chronic circadian desynchrony (CCD), mimicking a chronic jet-lag scheme, and assayed a range of cellular functions. The results indicated a specific circadian clock-dependent increase in cell proliferation. Transcriptome analysis revealed up-regulation of G1/S phase transition genes (myelocytomatosis oncogene cellular homolog [Myc], cyclin D1/3, chromatin licensing and DNA replication factor 1 [Cdt1]), concomitant with increased phosphorylation of the retinoblastoma (RB) protein by cyclin-dependent kinase (CDK) 4/6 and increased G1-S progression. Phospho-RB (Ser807/811) was found to oscillate in a circadian fashion and exhibit phase-shifted rhythms in circadian desynchronized cells. Consistent with circadian regulation, a CDK4/6 inhibitor approved for cancer treatment reduced growth of cultured cells and mouse tumors in a time-of-day-specific manner. Our study identifies a mechanism that underlies effects of circadian disruption on tumor growth and underscores the use of treatment timed to endogenous circadian rhythms.


Conflict of interest statement

The authors have declared that no competing interests exist.

Figures

Fig 1
Fig 1. CCD alters cellular rhythms and gene expression.
(A) Schematic diagram of the experimental schedule. U2OS cells stably expressing Per2 promoter-driven destabilized luciferase (pPer2-dLuc) were treated with media containing 100 nM dex every 24 hours for control (Control; CTL) cells or repeated 8-hour advances of the daily cycle every 2 days to simulate jet lag (Jet lag; JL) cells for 10 days, as indicated by yellow arrows. After the CTL and JL schedule, reporter cells were subjected to real-time recording of bioluminescence activity, as indicated by red arrows. Black arrowheads indicate the sampling time, every 6 hours, for analyses of circadian gene expression 24 hours after the final dex treatment. (B) Bioluminescence recordings of dex-synchronized cells subjected to a CTL or JL schedule described in (A) (left). The data are plotted with results from three cultured dishes representing each condition, CTL (black) and JL (brown), followed by a 24-hour moving average subtraction. Shading indicates the standard deviation for each point. The red arrow indicates the start of the bioluminescence measurement of CTL and JL cells following the final dex treatment. The yellow arrows indicate the dex stimulations every week (1 week, 2 weeks, 3 weeks). (C, D, E) Period (C), amplitude (D), and phase (E) analysis of circadian bioluminescence data of CTL (grey circle) and JL (brown circle) cells for the indicated weeks (1 week, 2 weeks, 3 weeks). ***p < 0.0001; two-way ANOVA and Bonferroni multiple comparisons test (C and D). **p < 0.001; two-tailed Student t test (E) (n.s., p > 0.05). Representative data from four independent experiments are shown as mean ± SD. n = 3. (F) Chronic desynchronization alters circadian cycles of gene expression. The heat map displays expression patterns of cycling genes identified by MetaCycle (q < 0.1) from the RNA-seq time course (depicted by black arrows in panel A). Color is scaled by calculating z-scores from normalized RNA-seq read counts within each row. Underlying data are provided in S1 Data. (G, H, I) RNA-seq expression traces from CTL (black) and JL (brown) samples for genes exhibiting altered expression rhythms due to CCD (G), core clock genes affected by CCD (H), and (I) genes with the highest fold-change differences between all JL samples and all CTL cells (see S1, S2 and S3 Tables). Underlying data are provided in S2 Data. Dots indicate expression levels for individual replicates, while lines connect means of the three replicates at each time point. Underlying data for this figure can be found in S3 Data. CCD, chronic circadian desynchrony; CTL, control; dex, dexamethasone; FDR, false discovery rate; n.s., not significant; JL, jet lag; Per2, Period2; RNA-Seq, RNA sequencing; U2OS, human U2 osteosarcoma.
Fig 2
Fig 2. Chronic jet lag promotes a pro-proliferative cellular environment.
(A, B, C) Biological functions and top gene networks (A), disease pathways (B), and effector networks (C) implicated by genes expressed differentially between control (CTL) and jet lag (JL) cells. Ingenuity Pathway Analysis (IPA) was used for this determination. (D) Heat map displays expression patterns of well-characterized oncogenes and tumor suppressor genes in CTL and JL cells, from RNA sequencing data. (E) Log2 fold-change values for oncogenes and tumor suppressor genes shown in (D). The asterisk indicates statistically significant differences (p < 0.05). Underlying data are provided in S4 Table. (F-I) Log2 fold-change values for gene expression of key ligands and receptors of (F) RAS, (G) EGF/EGFR, (H) FGF/FGFR, (I) VEGF/VEGFR signaling pathways. Fold-change values calculated using RNA-sequence data from CTL and JL cells (See S5, S6, S7 and S8 Tables). Underlying data for this figure can be found in S3 Data. CTL, control, EGF, epidermal growth factor; EGFR, epidermal growth factor receptor; FGF, fibroblast growth factor; FGFR, fibroblast growth factor receptor; IPA, Ingenuity Pathway Analysis; JL, jet lag; RAS, retinoic acid syndrome; VEGF, vascular endothelial growth factor; VEGFR, vascular endothelial growth factor receptor.
Fig 3
Fig 3. CCD enhances cell proliferation.
(A) Twenty-four hours after the final dex stimulation, as per the experimental schedule depicted in Fig 1A, the control (CTL: grey circle) and jet lag (JL: brown circle) cells were harvested and subjected to a cell viability assay with 0.4% trypan blue to determine cell numbers. **p < 0.001, two-tailed Student t test. Data are presented as mean ± SD; n = 9 samples from three independent experiments. (B) Knockdown of core clock regulators abrogates the effect of chronic jet lag on cell proliferation. Forty-eight hours post-transfection of control siRNA (si-CTL) or siRNAs targeting BMAL1 (si-BMAL1) or both CRY1 and CRY2 (si-CRY1/2), the CTL (grey circle) and JL (brown circle) cells were subjected to the same experimental procedures as described in (A). ***p < 0.001; two-way ANOVA and Tukey multiple comparisons test. Data are presented as mean ± SD; n = 9 samples from three independent experiments. (C) Western blot analysis of knockdown efficiency of si-BMAL1 or si-CRY1/2 used in (B). Anti-BMAL1, anti-CRY1, and anti-CRY2 antibodies were used for detecting endogenous BMAL1, CRY1, and CRY2. Anti-GAPDH (αGAPDH) was used for loading control. (D) Evaluation of cell proliferation by MTT assay in U2OS cells stably expressing siRNA against GFP (si-GFPstable) or BMAL1 (si-BMAL1stable) following the CTL: grey circle) and JL (brown circle) dex synchronization schedules. *p < 0.05; two-way ANOVA with Tukey multiple comparisons test. Data are shown with the means ± SEM; n = 6 in all groups. (E) Western blot analysis of BMAL1 knockdown efficiency in the BMAL1 (si-BMAL1stable) or GFP siRNA (si-GFPstable) transgenic cells using anti-BMAL1 antibody. Anti-GAPDH (αGAPDH) was used for loading control. (F) BrdU incorporation assay to assess cell proliferation in response to chronic desynchronization in control siRNA (si-CTL) versus BMAL1 or CRY1/2 siRNA-transfected U2OS cell cultures. Representative images show BrdU immunolocalization (red) in cell nuclei counterstained with Dapi (blue) 24 hours post control and jet-lag dex synchronization schedules, as depicted in Fig 1A. Scale bar, 200 μm. (G) Statistical analysis quantifying the fraction of BrdU-positive proliferating cells in (F). Proportion of anti-BrdU-positive cells from the total number of Dapi-stained nuclei (>200) in each of the si-CTL-, si-BMAL1–, or si-CRY1/2–transfected cultures after the CTL (grey bar) or JL (dark brown bar) schedule was averaged from six optical fields scanned with a 20× objective. *p < 0.05, ***p < 0.0001; two-way ANOVA with Tukey multiple comparisons test. Data are shown with the means ± SD; n = 6 per group. n.s., p > 0.05. (H) At the final dex-containing media change during the chronic desynchronization schedule, the CTL and JL cells were transduced with baculovirus-expressing FUCCI cell cycle sensors (Cdt1-RFP for G1/S, Geminin-GFP for G2/M) for 48 hours and fixed for microscopic analysis. Representative images were captured by fluorescence imaging microscopy using specific filter sets for FITC (grey green; Geminin-GFP), TRITC (red; Cdt-RFP), and DAPI (blue; nuclei). Scale bar, 200 μm. (I) Quantification of the fraction of FUCCI cell cycle indicator–positive cells shown in (H). Proportion of Geminin-GFP (green bar)–or Cdt1-RFP (red bar)–positive cells from the total number of Dapi-stained nuclei (>200) in the CTL or JL cells were averaged from six optical fields scanned with a 20× objective. *p < 0.05, ***p < 0.0001; two-way ANOVA with Tukey multiple comparisons test. Data are shown with the means ± SEM; n = 6 per group. (J) Comparison of CDT1 and GMNN mRNA expression profiles from RNA sequencing data with CTL (grey circle) and JL (brown circle) cells collected every 6 hours, as indicated, for 24 hours following the chronic desynchronization schedule depicted in Fig 1A. *p < 0.05, **p < 0.005, **p < 0.001; two-way ANOVA with Tukey multiple comparisons test. Data are shown with the means ± SEM; n = 3 in all time points. (K) Log2 fold-change values for cell cycle–specific genes, colored by associated phases (G1/S, S, G2, M). Fold-change values were calculated using RNA-Seq data of CTL and JL cells presented in S3A Fig. See S9 Table. Underlying data for this figure can be found in S3 Data. BMAL1, brain and muscle Arnt-like protein-1; BrdU, bromodeoxyuridine; CCD, chronic circadian desynchrony; Cdt1-RFP, chromatin licensing and DNA replication factor 1 tagged with red fluorescent protein; CRY, Cryptochrome; CTL, control; dex, dexamethasone; FITC, fluorescein isothiocyanate; FUCCI, fluorescence ubiquitination-based cell-cycle indicator; GAPDH, glyceraldehyde 3-phosphate dehydrogenase; GFP, green fluorescent protein; GMNN, Geminin; JL, jet lag; MTT, thiazolyl blue tetrazolium bromide; n.s., not significant; RNA-Seq, RNA sequencing; si-BMAL1, siRNA targeting BMAL1; si-CRY1/2, siRNA targeting both CRY1 and CRY2; si-CTL, control siRNA; siRNA, small interfering RNA; TRITC, tetramethylrhodamine; U2OS, human U2 osteosarcoma.
Fig 4
Fig 4. CCD alters rhythmic RB phosphorylation in a cyclin D1–dependent manner.
(A) Western blot analysis of phosphorylated RB at multiple sites (pRB-S807/811, pRB-S795, pRB-S780, pRB-S612), total RB, CCNB1, cyclin D1, and CDK4 with the specific antibodies as indicated in the control (CTL) and jet lag (JL) cells collected every 6 hours (24 hours, 30 hours, 36 hours, 42 hours, 48 hours) for 24 hours after the final dex stimulation, as depicted with black arrowheads in Fig 1A. GAPDH (αGAPDH) is loading control. Representative images were taken from n = 3 independent experiments. (B) Statistical analysis of the WB data in (A) showing time-dependent variation of protein abundance as indicated in CTL (grey circle) and JL (brown circle) cells. GAPDH was used to normalize protein levels. *p < 0.05, ***p < 0.001; two-way ANOVA and Sidak multiple comparisons test. pMetaCycle < 0.05 denotes results of MetaCycle analysis, identifying a 24-hour rhythm in the expression of pRB (S807/S811) (p = 0.0481) and CCND1 protein (p = 0.006) in CTL cells (grey circle). Data normalized are represented as mean ± SEM from n = 3 independent experiments. (C) Schematic representation of the elements of the human cyclin D1 promoter (upper). Elements of human cyclin D1 promoter are represented by different colors. The transcriptional start site is identified by a black line and arrow. The data show log2 fold-change values for gene expression of signaling-dependent transcriptional activators or repressors that directly target enhancer elements in the cyclin D1 promoter, as indicated by the corresponding color codes (See S15 Table). (D) Carcinogen (MCA)-induced tumor bearing mice were exposed to a chronic jet-lag schedule (see Materials and methods), following which tumor and liver tissues were harvested from Jet-lag or Control mice at the indicated time points (ZT3, ZT9, ZT15) and subjected to western blot analysis using the indicated antibodies. Representative images from n = 3 independent experiments are shown. (E) Immunoblot analysis using liver extracts prepared from mouse liver tissues collected at 4-hour intervals as indicated for 24 hours in constant darkness. Specific antibodies were used for detecting endogenous pRB-S807/811, cyclin D1, CDK4, and CCNB1 proteins, as indicated. Anti-GAPDH (αGAPDH) was used for loading control. Similar results were obtained in two independent experiments. (F) HEK293T cells were transiently transfected with a cyclin D1-Luc reporter construct (pcyclin D1(−1748)-Luc) alone or co-transfected with plasmids expressing CLOCK, BMAL1, and CRY1, as indicated. After 24 hours, the cells were lysed and cyclin D1 promoter-driven luciferase activity was measured and normalized with pRL-TK activity. Representative results from three independent experiments performed are shown with the means ± SEM; n = 3. ***p < 0.0001, one-way ANOVA and Tukey multiple comparisons test. Underlying data for this figure can be found in S3 Data. AP-1, activator protein 1; BMAL1, brain and muscle Arnt-like protein-1; CCD, chronic circadian desynchrony; CCNB1, cyclin B1; CCND1, cyclin D1; CDK, cyclin dependent kinase; CLOCK, circadian locomotor output cycles protein kaput; CREB/ATF, cAMP response element-binding protein/activating transcription factor; CRY1, Cryptochrome1; CSL, CBF1, Suppressor of Hairless, Lag-1; CT, circadian time; dex, dexamethasone; E-box, enhancer box; Ets, E26 transformation-specific transcription factor; E2F, E2 transcription factor; GAPDH, glyceraldehyde 3-phosphate dehydrogenase; Jmj, jumonji and AT-rich interaction domain containing 2 (Jarid2); LEF/TCF, lymphoid enhancer-binding factor/T-cell factor; Luc, luciferase; MAR, matrix-associated region; MCA, methylcholanthrene; NFKB, nuclear factor kappa-light-chain-enhancer of activated B cells; Oct-1, POU domain, class 2, transcription factor 1; pRB, phosphorylated RB; pRL-TK, renilla luciferase reporter of the HSV-thymidine kinase promoter; RB, retinoblastoma; SP1/EgR, specificity protein 1 (SP1)/early growth response (EgR) transcription factor; STAT3/5B, signal transducer and activator of transcription 3/5B; WB, western blot; YY-1, yin yang 1 transcription factor; Z-box, Z-DNA forming sequence; ZT, zeitgeber time.
Fig 5
Fig 5. CCD alters time-dependent anticancer activity of PD-0332991, a potent CDK4/6-specific inhibitor, in U2OS cells.
(A) Western blot analysis of the dose dependency of PD-0332991 action on RB phosphorylation in U2OS cells. After a 48-hour incubation with increasing doses of PD-0332991, cell extracts were harvested for immunoblot analysis of protein abundances of phosphorylated RBs at multiple sites (pRB-S807/811, pRB-S795, pRB-S780, pRB-S612), total RB, cyclin D1, CDK4, and CDK6 using specific antibodies. Anti-GAPDH (αGAPDH) was used for loading control. (B) Schematic of the experimental schedule to determine time dependence of the antiproliferative effect of PD-0332991 on U2OS cells. After 24 hours of dex (100 nM, yellow bolt) synchronization, the cells were treated with vehicle or PD-033291 (0.01–5 μM, red bolt) at 6-hour intervals over the course of 24 hours and subjected to an MTT cell proliferation assay at the indicated time points 48 hours later. (C) Graph of experimental procedures in (B) to show time-dependent antiproliferative effects of PD-0332991 at various doses. **p < 0.001, ***p < 0.0001; two-way ANOVA and Tukey multiple comparisons test. pMetaCycle < 0.05 denotes results of MetaCycle analysis, identifying a 24-hour rhythm in drug sensitivity of cells treated with 0.1 μM PD-0332991 (p = 0.0146). Data were normalized to represent the average ± SD; n = 3 in all time points. The result is representative of three independent experiments. (D) Twenty-four hours after the final dex stimulation depicted in Fig 1A, Control (CTL) and Jet lag (JL) U2OS cells stably expressing siRNA against GFP (si-GFPstable) or BMAL1 (si-BMAL1stable) were subject to a time course of vehicle or PD-0332991 (0.1 μM, 1 μM) treatment, and subsequent MTT analysis was performed as described in (B). Data were normalized to represent the average ± SD; n = 3 in all time points. pMetaCycle < 0.001 denotes results of MetaCycle analysis, identifying a 24-hour rhythm in drug sensitivity of cells treated with 1 μM PD-0332991 (p = 0.00019). The result is representative of two independent experiments. Underlying data for this figure can be found in S3 Data. BMAL1, brain and muscle arnt-like protein-1; CCD, chronic circadian desynchrony; CDK, cyclin dependent kinase; dex, dexamethasone; GAPDH, glyceraldehyde 3-phosphate dehydrogenase; GFP, green fluorescent protein; MTT, thiazolyl blue tetrazolium bromide; RB, retinoblastoma; siRNA, small interference RNA U2OS, human U2 osteosarcoma.
Fig 6
Fig 6. Chronic jet lag alters growth rate of carcinogen (MCA)-induced tumors and time-dependent anticancer activity of PD-0332991 in mice.
(A) The experimental schedule for chronic jet lag and palbociclib (PD-0332991) drug treatment. Thirty to sixty days after subcutaneous injection of MCA in mice, the mice were separated into Control and Jet-lag groups for a chronic jet-lag schedule, as depicted. Red arrows indicate sampling of the tumor and liver tissues from both groups of mice killed at the time points (ZT3, ZT9, ZT15) as indicated for further western blot analysis (See Fig 4D). Black arrowheads denote times of tumor measurement. Orange and green arrows indicate oral drug administration of mice at ZT3 and ZT15. Treatment started on day 11 after chronic jet lag (CJL). (B) Representative activity records of running wheel activity in Control and Jet-lag mice. (C) Plots depicting tumor growth in Control (grey circle, n = 14) and Jet-lag (brown circle, n = 14) mice during CJL. **p < 0.01, ***p < 0.001, two-way ANOVA and Bonferroni multiple comparisons test. Data normalized were derived from n = 3 independent experiments. Error bar shown with mean ± SEM. (D) Quantification of relative tumor growth rate calculated from linear regression by fitting a linear equation to observed data in the Control (n = 14; grey circle) and Jet lag (n = 14; brown circle) mice of (C). ***p < 0.0001, two-tailed Student t test. Data normalized were shown with mean ± SEM; n = 14 in both groups. (E and F) Time-dependent effects of palbociclib on MCA-induced tumor growth in Control (E) or Jet-lag (F) mice. Tumor growth changed as a function of palbociclib administration time: untreated (black circle), treated at ZT3 (orange square), and treated at ZT15 (green triangle). n indicates the number of mice analyzed. Data normalized were shown with mean ± SEM; n = 5–6 per group. The result is representative of two independent experiments. (G and F) Quantification of MCA-induced tumor growth rate calculated from linear regression by fitting a linear equation to observed data in Control (G) or Jet-lag mice (F) under the different drug treatment conditions: untreated (black circle), treated at ZT3 (orange squares), and treated at ZT15 (green triangles). n = 5–6 mice were analyzed in all groups. *p < 0.05, one-way ANOVA and Tukey multiple comparison test. Data were shown with mean ± SEM. Underlying data for this figure can be found in S3 Data. CJL, chronic jet lag; DD, constant darkness; LD, light-dark; MCA, methylcholanthrene; n.s., not significant; ZT, zeitgeber time.

References

    1. Takahashi JS. Transcriptional architecture of the mammalian circadian clock. Nat Rev Genet. 2017; 18: 164–179. 10.1038/nrg.2016.150 - DOI - PMC - PubMed
    1. Mattis J, Sehgal A. Circadian Rhythms, Sleep, and Disorders of Aging. Trends Endocrinol Metab. 2016; 27: 192–203. 10.1016/j.tem.2016.02.003 - DOI - PMC - PubMed
    1. Khan S, Duan P, Yao L, Hou H. Shiftwork-Mediated Disruptions of Circadian Rhythms and Sleep Homeostasis Cause Serious Health Problems. Int J Genomics. 2018; 2018: 8576890. - PMC - PubMed
    1. Filipski E, Delaunay F, King VM, Wu MW, Claustrat B, Grechez-Cassiau A, et al. Effects of chronic jet lag on tumor progression in mice. Cancer Res. 2004; 64: 7879–7885. 10.1158/0008-5472.CAN-04-0674 - DOI - PubMed
    1. Kettner NM, Voicu H, Finegold MJ, Coarfa C, Sreekumar A, Putluri N, et al. Circadian Homeostasis of Liver Metabolism Suppresses Hepatocarcinogenesis. Cancer Cell. 2016; 30: 909–924. 10.1016/j.ccell.2016.10.007 - DOI - PMC - PubMed

Publication types