. 2019 Jun 3;216(6):1311-1327.
doi: 10.1084/jem.20182304. Epub 2019 Apr 30.

Human interleukin-2 receptor β mutations associated with defects in immunity and peripheral tolerance

Affiliations

Human interleukin-2 receptor β mutations associated with defects in immunity and peripheral tolerance

Zinan Zhang et al. J Exp Med. .

Abstract

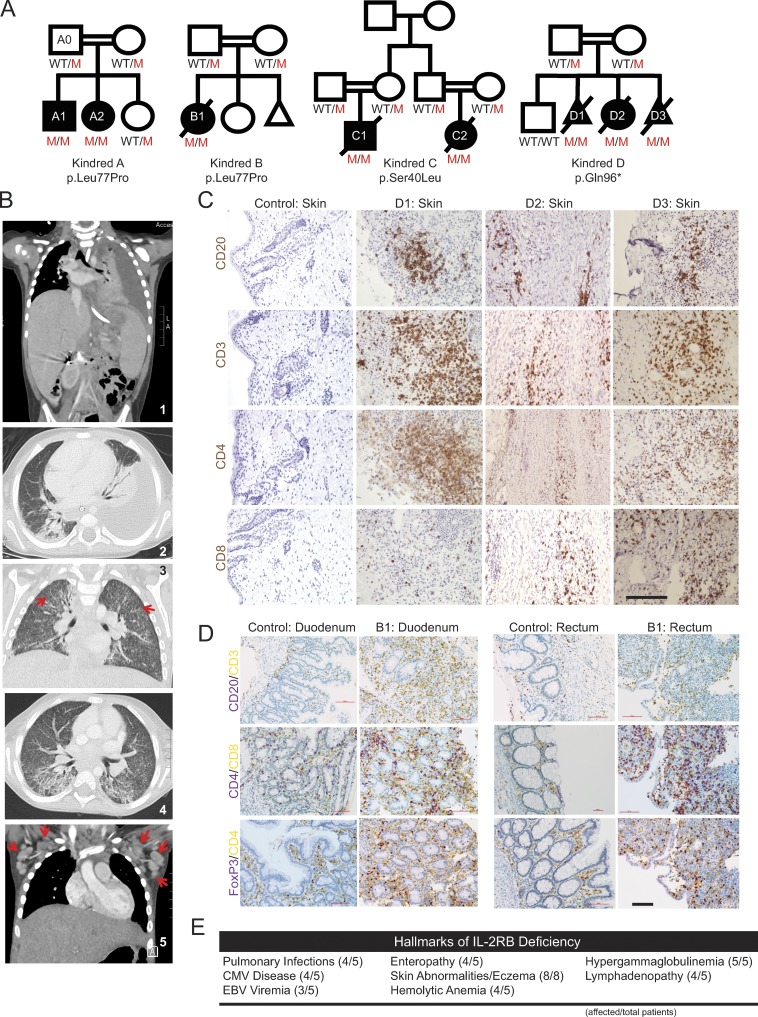
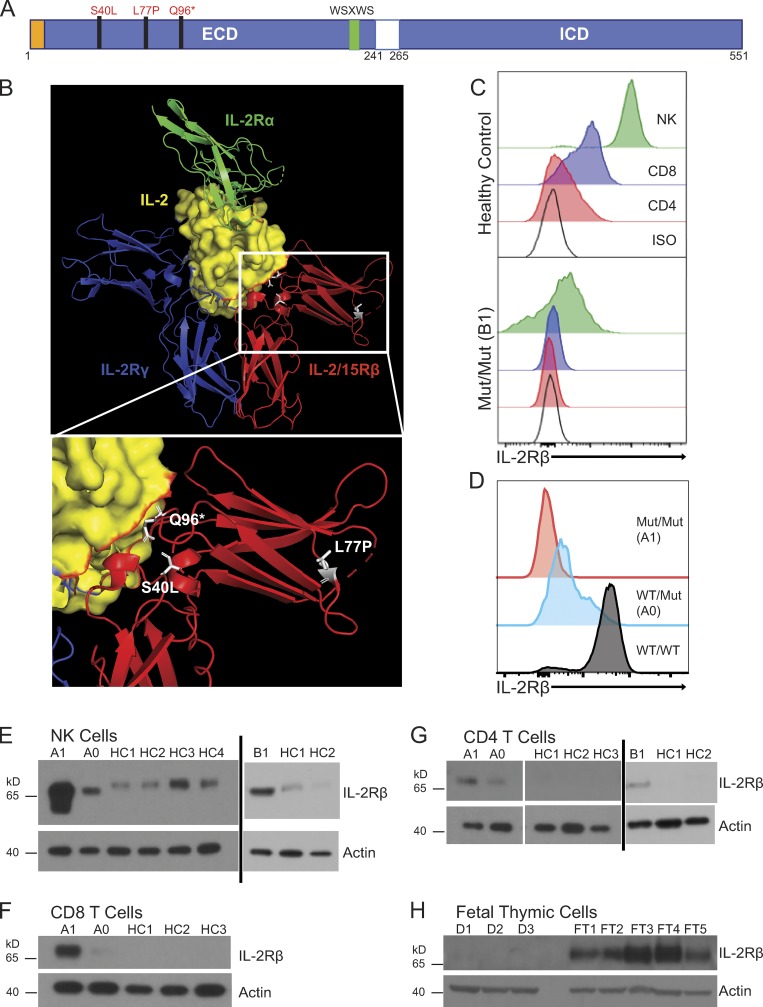
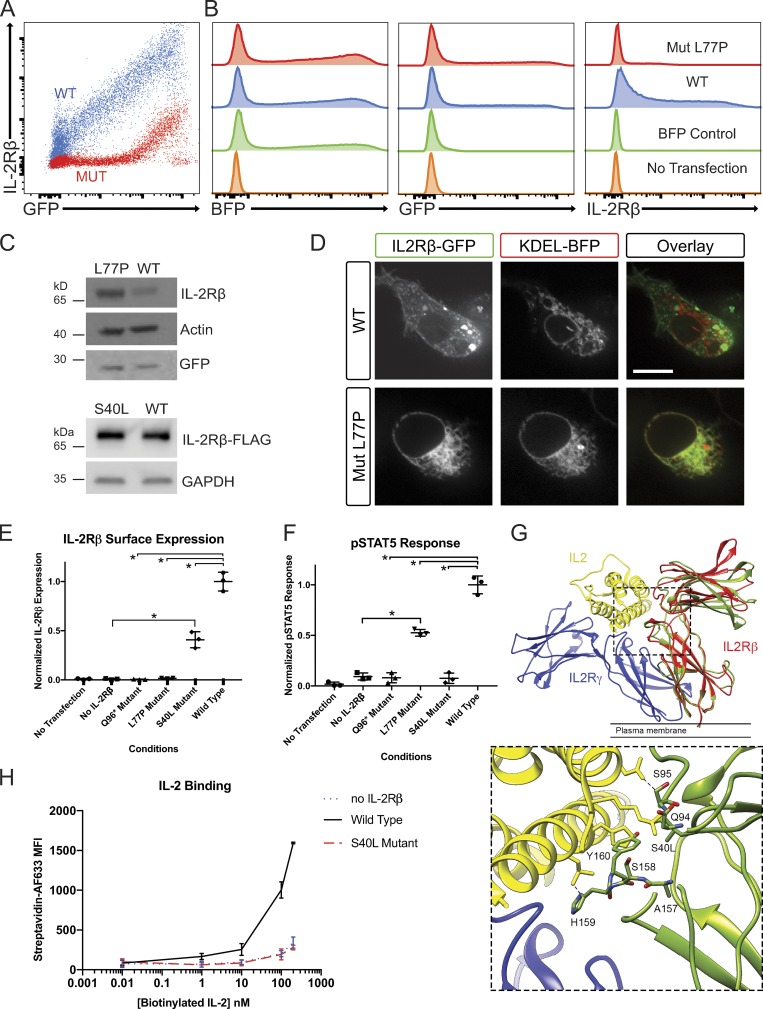
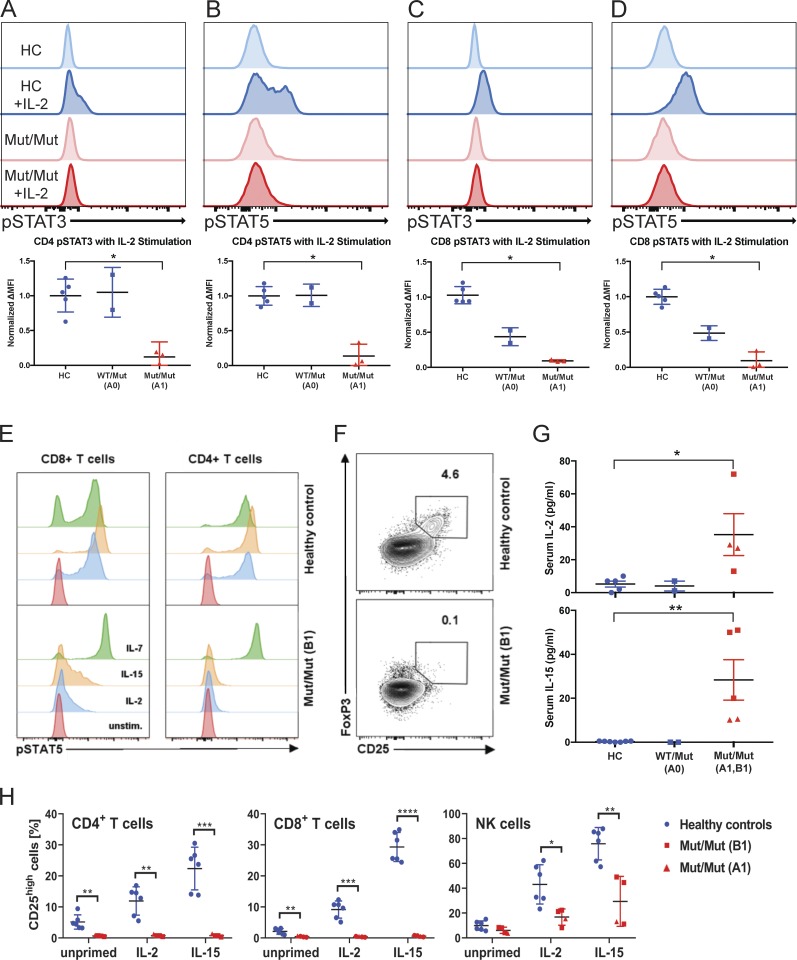
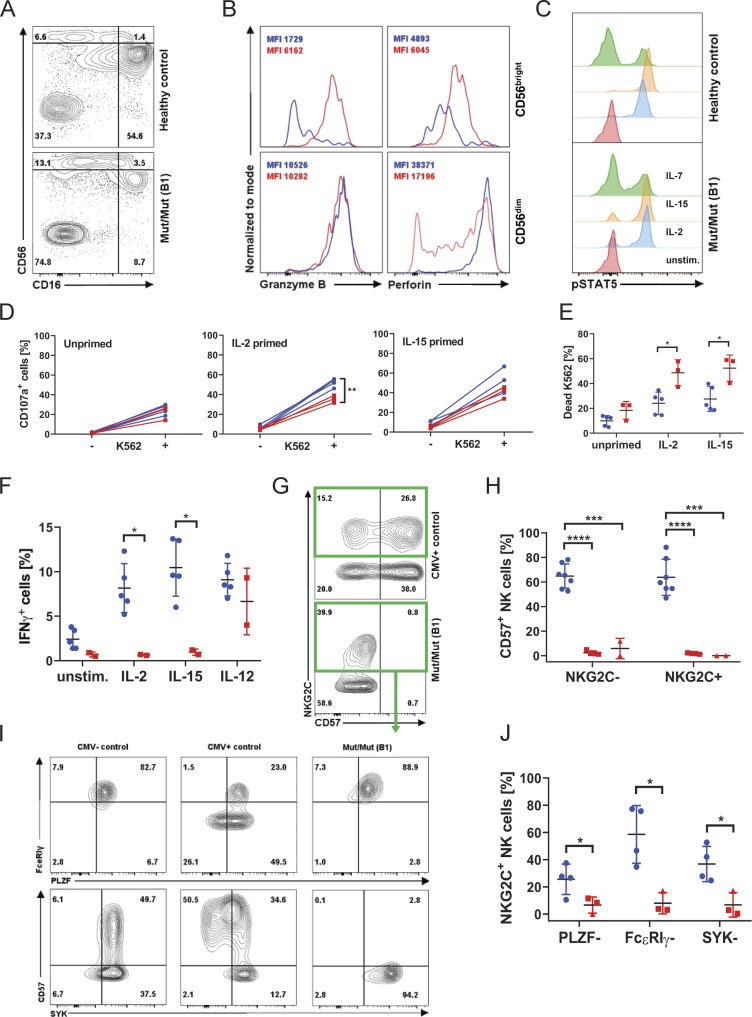
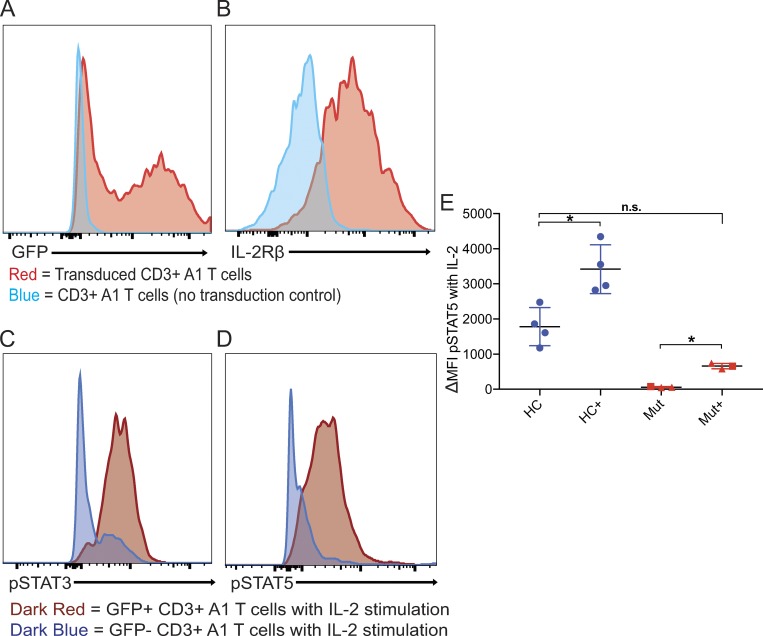
Interleukin-2, which conveys essential signals for immunity, operates through a heterotrimeric receptor. Here we identify human interleukin-2 receptor (IL-2R) β chain (IL2RB) gene defects as a cause of life-threatening immune dysregulation. We report three homozygous mutations in the IL2RB gene of eight individuals from four consanguineous families that cause disease by distinct mechanisms. Nearly all patients presented with autoantibodies, hypergammaglobulinemia, bowel inflammation, dermatological abnormalities, lymphadenopathy, and cytomegalovirus disease. Patient T lymphocytes lacked surface expression of IL-2Rβ and were unable to respond to IL-2 stimulation. By contrast, natural killer cells retained partial IL-2Rβ expression and function. IL-2Rβ loss of function was recapitulated in a recombinant system in which IL2RB mutations caused reduced surface expression and IL-2 binding. Stem cell transplant ameliorated clinical symptoms in one patient; forced expression of wild-type IL-2Rβ also increased the IL-2 responsiveness of patient T lymphocytes in vitro. Insights from these patients can inform the development of IL-2-based therapeutics for immunological diseases and cancer.


Figures

Figure 1.
Figure 1.
Genetic and clinical features of the disease cohort. (A) Four consanguineous pedigrees of eight affected individuals (A1–D3) with three different homozygous recessive IL2RB mutations. (B) Radiographical evidence for pulmonary disease in kindred A. Panels 1 and 2 show a left pleural effusion. Hepatosplenomegaly can also be seen in panel 1. Panels 3 and 4 show numerous small pulmonary nodules and tree-in-bud changes suggestive of CMV pneumonia. Red arrows highlight two small lung nodules. Panel 5 shows enlarged axillary lymph nodes (red arrows). (C) Immunohistochemistry of fetal skin from kindred D; patients D1, D2, and D3 stained in brown for the lymphocyte markers as indicated. Bar, 50 µm. (D) Immunohistochemistry of duodenal (left) and rectal (right) biopsies of patient B1 and healthy control, stained with indicated markers. Purple: CD20, CD4, and FoxP3; yellow: CD3, CD8, and CD4 for the respective panels. Bar, 100 µm. (E) Summary of clinical hallmarks of IL-2Rβ deficiency in the five pediatric patients. Skin abnormalities were observed in the individuals in kindred D in addition to the pediatric patients (eight total).
Figure 2.
Figure 2.
IL2RB coding mutations cause IL-2Rβ surface receptor deficiency. (A) Schematic of intracellular (ICD) and extracellular domains (ECD) of the IL-2Rβ protein depicting the location of the three mutations in the ECD. The signal peptide is highlighted in orange, and the canonical WSXWS motif is highlighted in green. (B) Crystal structure of IL-2:IL-2R complex with the expanded view showing the position of the three mutations in white: L77P, S40L, and Q96*; (modified from PDB 2B5I, Wang et al., 2005). Red: IL-2/15Rβ; blue: IL-2Rγ; green: IL-2Rα; and yellow: IL-2 with IL-2Rβ interface colored in red. (C) Histogram of IL-2Rβ surface expression in CD3+ CD4+ (red), CD3+ CD8+ (blue), and CD3 CD56+ NK cells (green) and isotype control–stained cells (black) from healthy control (top panel) and patient B1 (bottom panel). (D) Histogram of IL-2Rβ surface expression in NK cells (CD3 CD56+; red, homozygous affected A1; blue, heterozygote healthy A0; black, healthy control). Data representative of four independent experiments. Mut, mutation. (E) Western blot of FACS-sorted CD3 CD56+ NK cells from A1, heterozygote parent (A0), B1, and four healthy controls (HC1–HC4). (F) Western blot of FACS-sorted CD3+ CD8+ T cells from A1, heterozygote parent (A0), and three healthy controls (HC1–HC3). (G) Western blot of FACS-sorted CD3+ CD4+ T cells from A1, heterozygote parent (A0), B1, and three healthy controls (HC1–HC3). (H) Western blot of fetal thymuses from kindred D (D1–D3) and five fetal thymic controls from 25-wk-old (FT3 and FT4) and 31-wk-old (FT1, FT2, and FT5). E–H, loading control: actin. Western blots (E–H) were repeated in triplicate.
Figure 3.
Figure 3.
Investigation of IL-2Rβ deficiency mechanisms in a HEK293T transfection model. (A) FACS plot of GFP and IL-2Rβ expression by HEK293T cells transfected with pHTC-wtIL2RB (red) and pHR-TetON-BFP or transfected with pHTC-mutIL2RB (blue) and pHR-TetON-BFP. (B) Histograms of BFP, GFP, or IL-2Rβ expression given the listed four transfection conditions: WT, mutant (Mut), TetON only, and no transfection. (C) Western blot of HEK293T cells transfected with pHTC-wtIL2RB-GFP or pHTC-mutIL2RB-GFP. Loading controls: actin and GFP. (D) Confocal images of live HEK293T cells cotransfected with KDEL-BFP (ER localization marker) and WT-IL2RB-GFP or Mut-IL2RB-GFP. Bar, 10 µm. (E) Graph of normalized surface IL-2Rβ expression in HEK293T cells with exogenous IL-2R system for the three disease-causing IL2RB mutations. *, P < 0.05, Mann-Whitney U test. (F) Graph of pSTAT5 response to high-dose IL-2 in HEK293T cells with exogenous IL-2R system. *, P < 0.05, Mann-Whitney U test. (G) MD simulation of the receptor cytokine binding interface in WT IL-2Rβ and the S40L variant. The IL-2R subunit is colored in blue, IL-2Rβ in red, and IL-2 in yellow (PDB: 5M5E). The structure of S40L mutant after 100 ns of MD simulation (green) is shown superimposed on the structure of the WT IL-2Rβ after 100 ns MD simulation (red). The leucine side chain clashes with main chain atoms in the BC2 loop (residues 157–165) of the D2 domain, which contributes directly to IL-2 binding. A zoomed in panel of the IL-2 and MD simulated S40L mutant IL-2Rβ interface is provided. (H) Graph of IL-2 binding by WT IL-2Rβ, S40L mutant, and no IL-2Rβ negative control in HEK293T cells measured by flow cytometry using a biotin–streptavidin system. MFI, mean fluorescence intensity. Experiments A–F and H were repeated in triplicate with graphs showing mean ± SEM.
Figure 4.
Figure 4.
IL-2Rβ deficiency abrogates IL-2 induced STAT3 and STAT5 phosphorylation in peripheral T cells. (A) Flow cytometry–based measure of STAT3 phosphorylation in CD3+ CD4+ T cells from healthy controls (HC), heterozygote parent A0 (WT/Mut), and homozygous affected A1 (Mut/Mut). (B) STAT5 phosphorylation in CD3+ CD4+ T cells. (C) STAT3 phosphorylation in CD8 T cells. (D) STAT5 phosphorylation in CD8+ T cells (red, representative healthy control; blue, representative affected; lighter shade, unstimulated; darker shade, stimulated with 1,000 U IL-2). (E) STAT5 phosphorylation in CD4+ and CD8+ T cells (B1) in response to IL-2, IL-7, and IL-15 stimulation. Unstim., unstimulated. (F) Flow cytometry plot of CD25 and FoxP3 expression in healthy control and homozygous affected (B1). Data representative of three independent experiments. (G) Graphs of IL-2 and IL-15 levels in healthy controls, A0 (healthy heterozygous father of A1), patient A1, and patient B1 serum. (H) Graphs of percent of CD25high cells in healthy control (blue), patient B1 (red square), and patient A1 (red triangle) CD4+ T cells, CD8+ T cells, and NK cells that have been primed with IL-2 or IL-15 for 12 h or left unprimed. ****, P < 0.0001; ***, P < 0.001; **, P < 0.01; *, P < 0.05; Mann-Whitney U tests were performed in A–D, and G. Student t test was performed in H. Experiments A–H were performed in triplicate with graphs showing mean ± SD.
Figure 5.
Figure 5.
NK cells retain IL-2/IL-15 responsiveness and effector function, but an adaptive “memory-like” subset is lacking. (A) Flow cytometry plot of CD16 and CD56 expression in CD3 CD19 lymphocytes (patient B1), representative of four independent experiments. (B) Histograms of granzyme B and perforin content in CD56bright versus CD56dim NK cells. Healthy control in blue, patient B1 in red. Experiment displayed representative of three independent experiments. (C) STAT5 phosphorylation in NK cells (B1) in response to IL-2, IL-7, and IL-15 stimulation. (D) CD107a expression (degranulation) in healthy control and patient B1 NK cells co-cultured with K562 cells after 12 h of priming with IL-2 or IL-15 or left unprimed. (E) Percentage of 7-AAD–positive, i.e., dead, K562 cells as a measure of cytotoxicity when co-cultured with healthy control (blue circles) PBMCs or patient B1 (red squares) PBMCs. (F) IFNγ production in response to the indicated stimuli in control NK cells (blue circles) or patient B1 NK cells (red squares). (G) Expression of NKG2C and CD57 on NK cells of CMV+ control and patient B1. (H) Summary graph displaying the percentage of CD57+ positivity within the NKG2C+ and NKG2C NK cell subsets (mean ± SD) in patient A1 (red triangles) and B1 (red squares). Data representative of six independent experiments. (I) FACS plots of FcεRIγ, PLZF, and SYK expression in CMV and CMV+ healthy controls and well as patient B1, gated on NKG2C-expressing NK cells. (J) Summary graphs showing the percentage of NKG2C+ NK cells from patient A1 (red triangles) and B1 (red squares) down-regulating the indicated proteins. ****, P < 0.0001; ***, P < 0.001; **, P < 0.01; *, P < 0.05; Student t tests were performed. Experiments D–F were performed in duplicate and A–C and G–J were performed in triplicate with graphs showing mean ± SD.
Figure 6.
Figure 6.
Lentiviral rescue of IL-2Rβ and STAT phosphorylation in primary T cells. (A) Histogram showing GFP expression in patient A1 CD3+ T cells transduced (red) with lentiviral WT IL-2Rβ and GFP and no transduction control (blue). (B) Histogram showing IL-2Rβ expression in patient A1 CD3+ T cells transduced (red) with lentiviral WT IL2RB and GFP and no transduction control (blue). (C) Histograms showing STAT3 phosphorylation in response to IL-2 stimulation in transduced (dark red) and nontransduced (dark blue) CD3+ A1 T cells. (D) Histograms showing STAT5 phosphorylation in response to IL-2 stimulation in transduced (dark red) and nontransduced (dark blue) CD3+ A1 T cells. (E) Graph of delta mean fluorescence intensity (MFI) of pSTAT5 between IL-2 stimulated and unstimulated in healthy controls (HC) and L77P patients A1 and B1 transduced and no transduction control. *, P < 0.05, Mann-Whitney U test; n.s., not significant. Experiments A–E were performed in triplicate with the graph showing mean ± SEM.

Comment in

  • IL2RB maintains immune harmony.
    Campbell TM, Bryceson YT. Campbell TM, et al. J Exp Med. 2019 Jun 3;216(6):1231-1233. doi: 10.1084/jem.20190546. Epub 2019 May 8. J Exp Med. 2019. PMID: 31068380 Free PMC article.

References

    1. Abraham M.J., Murtola T., Schulz R., Páll S., Smith J.C., Hess B., and Lindahl E.. 2015. GROMACS: High performance molecular simulations through multi-level parallelism from laptops to supercomputers. SoftwareX. 1-2:19–25. 10.1016/j.softx.2015.06.001 - DOI
    1. Ahmadzadeh M., and Rosenberg S.A.. 2006. IL-2 administration increases CD4+ CD25(hi) Foxp3+ regulatory T cells in cancer patients. Blood. 107:2409–2414. 10.1182/blood-2005-06-2399 - DOI - PMC - PubMed
    1. Bielekova B., Catalfamo M., Reichert-Scrivner S., Packer A., Cerna M., Waldmann T.A., McFarland H., Henkart P.A., and Martin R.. 2006. Regulatory CD56(bright) natural killer cells mediate immunomodulatory effects of IL-2Ralpha-targeted therapy (daclizumab) in multiple sclerosis. Proc. Natl. Acad. Sci. USA. 103:5941–5946. 10.1073/pnas.0601335103 - DOI - PMC - PubMed
    1. Boyman O., and Sprent J.. 2012. The role of interleukin-2 during homeostasis and activation of the immune system. Nat. Rev. Immunol. 12:180–190. 10.1038/nri3156 - DOI - PubMed
    1. Boyman O., Kovar M., Rubinstein M.P., Surh C.D., and Sprent J.. 2006. Selective stimulation of T cell subsets with antibody-cytokine immune complexes. Science. 311:1924–1927. 10.1126/science.1122927 - DOI - PubMed

Publication types

MeSH terms

Substances