. 2019 Apr 30;10(1):1981.
doi: 10.1038/s41467-019-09852-0.

Liver-target nanotechnology facilitates berberine to ameliorate cardio-metabolic diseases

Affiliations

Liver-target nanotechnology facilitates berberine to ameliorate cardio-metabolic diseases

Hui-Hui Guo et al. Nat Commun. .

Abstract

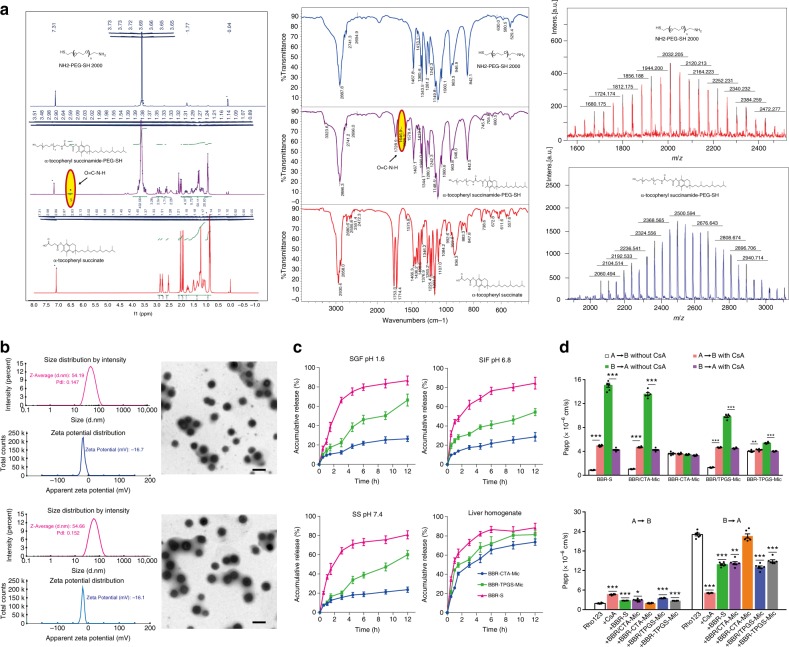
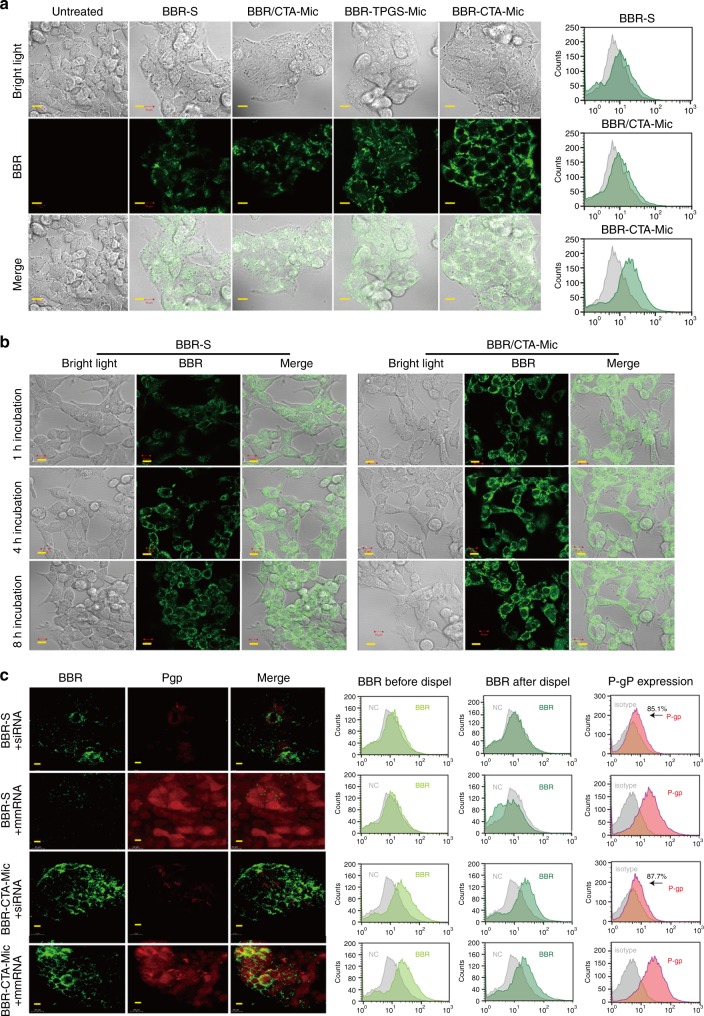
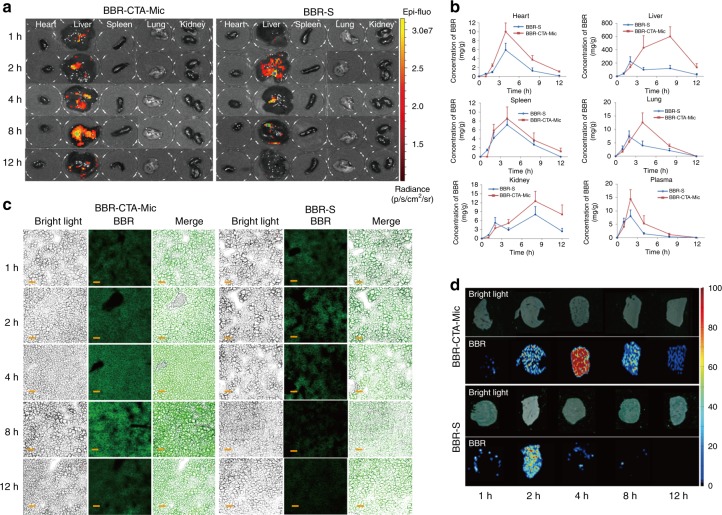
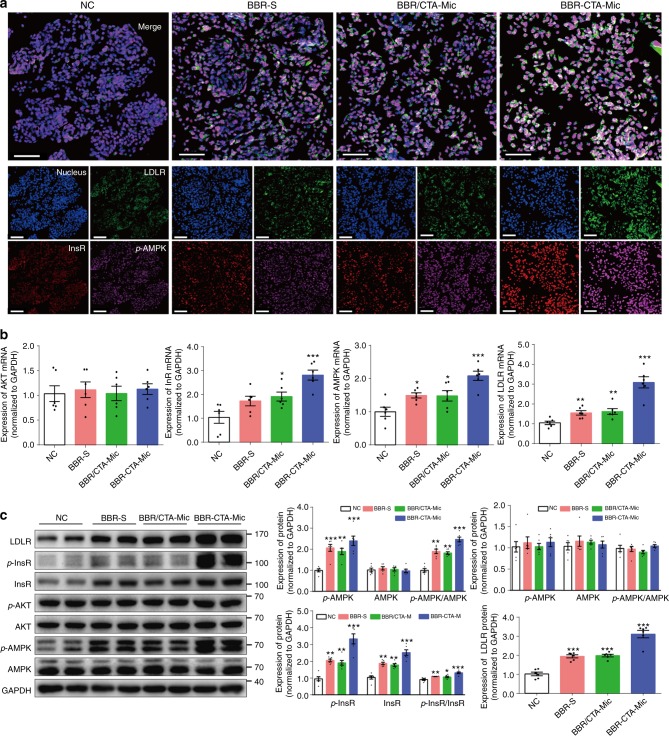
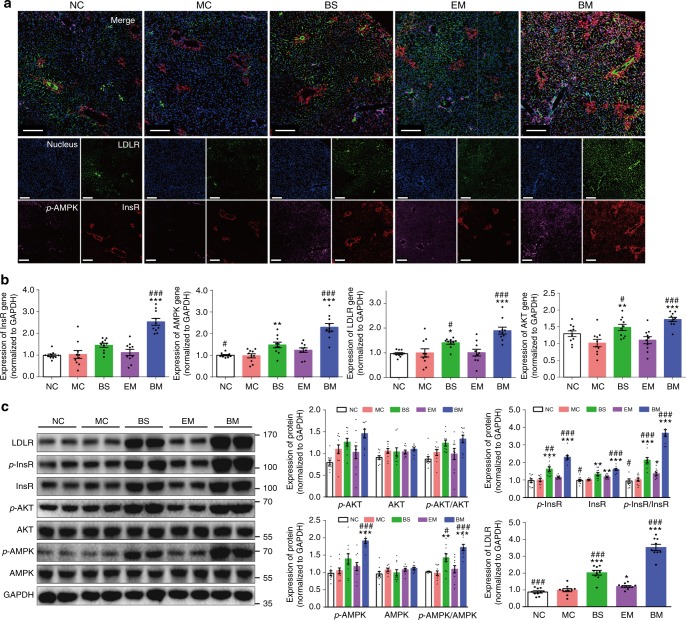
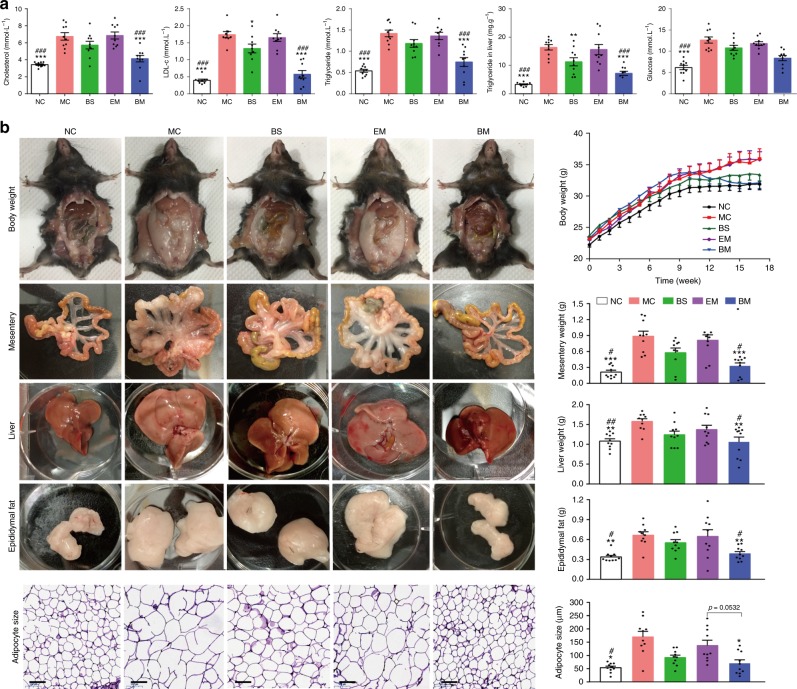
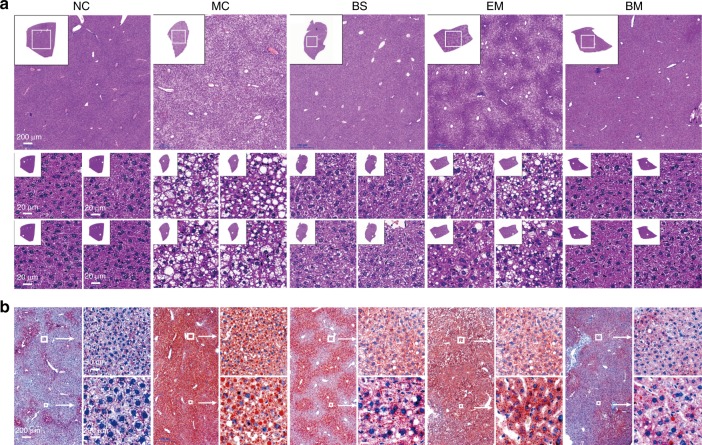
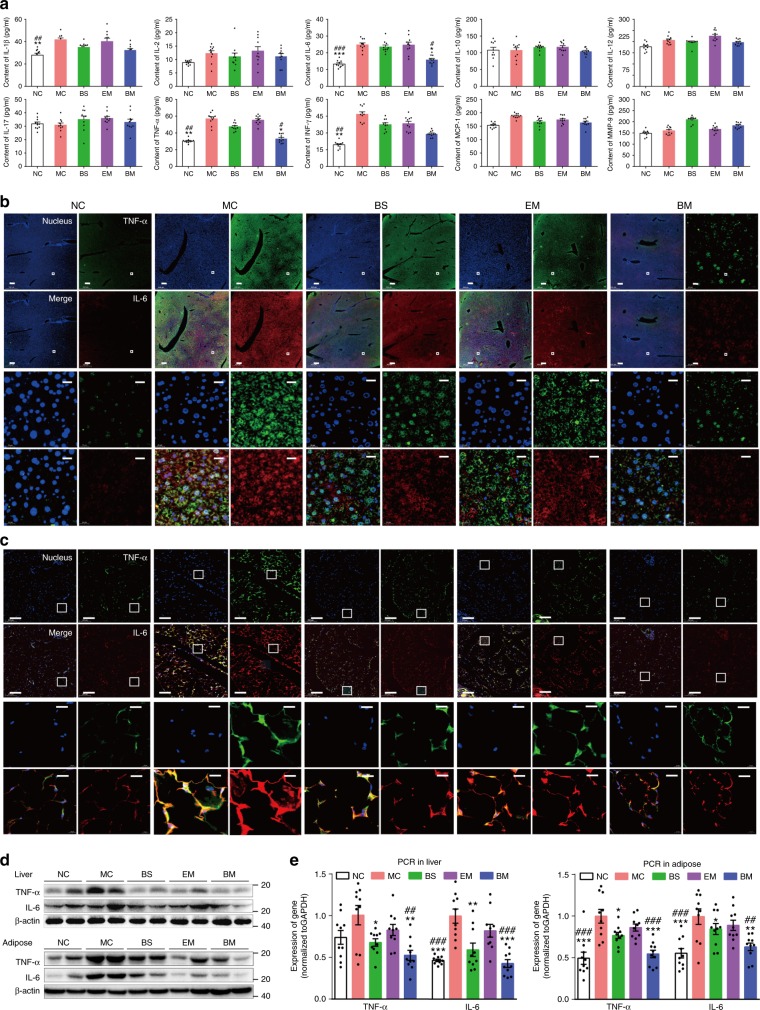
Cardiovascular and metabolic disease (CMD) remains a main cause of premature death worldwide. Berberine (BBR), a lipid-lowering botanic compound with diversified potency against metabolic disorders, is a promising candidate for ameliorating CMD. The liver is the target of BBR so that liver-site accumulation could be important for fulfilling its therapeutic effect. In this study a rational designed micelle (CTA-Mic) consisting of α-tocopheryl hydrophobic core and on-site detachable polyethylene glycol-thiol shell is developed for effective liver deposition of BBR. The bio-distribution analysis proves that the accumulation of BBR in liver is increased by 248.8% assisted by micelles. Up-regulation of a range of energy-related genes is detectable in the HepG2 cells and in vivo. In the high fat diet-fed mice, BBR-CTA-Mic intervention remarkably improves metabolic profiles and reduces the formation of aortic arch plaque. Our results provide proof-of-concept for a liver-targeting strategy to ameliorate CMD using natural medicines facilitated by Nano-technology.


Conflict of interest statement

The authors declare no competing interests.

Figures

Fig. 1
Fig. 1
Characterization of TPGTSA and BBR-CTA-Mic. a The physical properties of TPGTSA. Left: Nuclear magnetic resonance hydrogen spectrum (1H-NMR); middle: Flourier transformation infrared spectroscopy (FTIR); right: matrix-assisted laser desorption/ionization time of mass spectrometry (MALDI-TOF-MS). b Particle size, Zeta potential and morphology of empty CTA-Mics (up) and BBR-CTA-Mics (down). c Drug release study. The release of BBR from BBR-CTA-Mic and BBR-TPGS-Mic was carried out by dialysis method. BBR-S was used as control. 0.4 mL of BBR-S or BBR containing Mics was sealed in dialysis bags and submerged in 50 mL of fasting state simulated gastric fluid (SGF, pH 1.6), fasting state simulated intestinal fluid (SIF, 5 mM of bile salts, pH 6.8), simulated serum (SS, 20% FBS albumin, pH 7.4) and simulated liver environment (20% mice liver homogenate), respectively. Data are presented as mean ± SEM (n = 5). d Trans-epithelial transport study of BBR formulations in Caco-2 cell lines. Up: bidirectional apparent trans-epithelial permeability (Papp) of BBR contained formulations and the effect of CsA on the transport of different samples; down: the effect of different BBR containing formulations on Rho123 transportation. Data are presented as mean ± SEM (n = 6), *p< 0.05, **p< 0.01, ***p< 0.001, vs untreated control, p-values were calculated by unpaired two-sided Student’s t-test. Scale bars, 100 nm (b)
Fig. 2
Fig. 2
Intracellular-uptake analysis. a. The cells were treated with various BBR formulations at an equivalent BBR concentration of 1 μg mL−1 for 3 h, respectively, at 37 °C in 5% CO2. Left: representative fluorescent images of BBR in HepG2 cells visualized using CLSM (Carl Zeiss, Germany); right: representative flow cytometry diagram of BBR in HepG2 cells. b The cells were treated with BBR-S or BBR-CTA-Mic for 1, 4, or 8 h, respectively. Representative fluorescent images of BBR in HepG2 cells visualized using CLSM. c HepG2 cells were pre-incubated with BBR-S or BBR-CTA-Mic accompanied with P-gp siRNA or mismatch siRNA (mm RNA) (50 nM) for 8 h. Cells were washed with PBS twice and incubated with fresh medium for another 4 h. Left: representative fluorescent images of BBR and P-gp in HepG2 cells visualized using C2t Nikon fluorescent microscope (Morrell, USA); middle: representative flow cytometry diagram of BBR deposition in HepG2 cells before and after dispel experiment. Right: representative flow cytometry diagram of P-gp expression in HepG2 cells before and after RNAi. The experiments were conducted in five times. Scale bars, 10 μm (ac)
Fig. 3
Fig. 3
Bio-distribution Evaluation. C57BL/6J mice were administered with BBR-S or BBR-CTA-Mic (50 mg kg−1 of BBR) via gavage injection. a At each predetermined time point, a group of five mice for each formulation were euthanized and blood (0.5 mL) were obtained from posterior orbital venous plexus to a heparinized tube and major organs (heart, liver, spleen, lung, and kidney) were harvested. Major organs were imaged using the IVIS imaging system at excitation/emissio n = 465/540 nm. (Heart, liver, spleen, lung, and kidney, from left to right). b Quantitative analysis of the distribution of BBR in C57BL/6J mice at different time points achieved via LC/MS/MS. (n = 5, mean ± SEM). Liver-focused evaluation was applied to further assay the hepatic cell accumulation of BBR in BBR-S or BBR-CTA-Mic group. The cryostat sections of liver sample were prepared by cutting the liver tissue into 4 μm. c Liver cell accumulation of BBR was visualized using CLSM LSM710 (Carl Zeiss, Germany) Ex = 365 nm; Em = 480 nm. d Liver accumulation of BBR was tested using ambient mass spectrometry imaging method. The experiments were performed on an air-flow-assisted desorption electrospray ionization (AFADESI)-MSI platform equipped with a Q-Orbitrap mass spectrometer. Scale bars, 50 μm (c)
Fig. 4
Fig. 4
In vitro pharmacological effect. The HepG2 cells were treated with various BBR formulations at an equivalent BBR concentration of 1 μg mL−1 for 8 h at 37 °C in 5% CO2. a The induction of p-AMPK (pink), InsR (red) and LDLR (green) protein expression by different BBR formulations was probed simultaneously with anti-InsR, LDLR and p-AMPK antibodies and visualized with C2t Nikon fluorescent microscope (Morrell, USA). b The mRNA expression of AMPK, InsR, AKT, and LDLR genes was evaluated by RT-PCR. The results were normalized to GAPDH. c The protein expression of AMPK, p-AMPK, InsR, p-InsR, AKT, p-AKT, and LDLR was tested using western blot analysis. The results were normalized to GAPDH as density ratio. Data are presented as mean ± SEM (n = 6), *p< 0.05, **p< 0.01, ***p< 0.001, vs NC group, p-values were calculated by unpaired two-sided Student’s t-test. Scale bars, 100 μm (a)
Fig. 5
Fig. 5
In vivo pharmacodynamics. C57BL/6J mice were feed with HFD for 8 weeks, followed with randomly allocated into four groups: model control group (MC), BBR-S group (BS, 50 mg kg−1 of BBR), empty micelle group (EM, same as BBR micelles) or BBR-CTA-Mic group (BM, 50 mg kg−1 of BBR), accompanied with HFD for another 8 weeks by gavage. Untreated mice fed with standard rodent diet (NC) were used as control. a Representative photographs of p-AMPK (pink), InsR (red) and LDLR (green) protein expression in liver tissue of different group mice were visualized using C2t Nikon fluorescent microscope (Morrell, USA) by probing with anti-InsR, LDLR and p-AMPK antibodies simultaneously. b The mRNA expression of AMPK, InsR, AKT, and LDLR genes was evaluated by RT-PCR. The results were normalized to GAPDH. c The protein expression of AMPK, p-AMPK, InsR, p-InsR, AKT, p-AKT, and LDLR was tested using western blot analysis. The results were normalized to GAPDH as density ratio. Data are presented as mean ± SEM (n = 10), *p< 0.05, **p< 0.01, ***p< 0.001, vs mice in MC group; #p < 0.05, ##p < 0.01, ###p< 0.001, vs mice in EM group, p-values were calculated by unpaired two-sided Student’s t-test. Scale bars, 200 μm (a)
Fig. 6
Fig. 6
In vivo hyperlipidemia, body weight and adiposity analyses. HFD-fed C57BL/6J mice were treated with various BBR formulations by gavage. Untreated mice fed with HFD (MC group) and standard chow food (NC group) were used as control. a Biochemical analyses. Plasma TG, cholesterol, LDL-c, glucose, and hepatic TG were measured with enzymatic methods using an automatic biochemical analyzer. b Representative pictures and weight changes of whole body, mesentery and epididymal fat, liver tissue and size change of adipocyte. Data are presented as mean ± SEM (n = 10), *p< 0.05, **p< 0.01, ***p< 0.001, vs mice in MC group; #p< 0.05, ##p< 0.01, ###p< 0.001, vs mice in EM group, p-values were calculated by unpaired two-sided Student’s t-test. Scale bars, 100 μm (b)
Fig. 7
Fig. 7
Fatty liver and hepatic injury evaluation. HFD-fed C57BL/6J mice were treated with various BBR formulations by gavage (n = 10 for each group). Untreated mice fed with HFD or standard chow food (NC group) were used as control. a Representative photographs of HE-stained liver sections. Insets contain images of whole liver tissue section. The regions of interest (ROI) are boxed in white, and their magnified images are shown at the right. b Representative photographs of oil Red O stained liver sections. The regions of interest (ROI) are boxed in white, and their magnified images are shown at the right
Fig. 8
Fig. 8
Inflammation condition analysis. HFD-fed C57BL/6J mice treated with various BBR formulations by gavage. a Pro-inflammation cytokine levels in plasma. Following the termination of the experiment, blood samples were collected and used for the determination of plasma TNF-α, IL-1β, IL-2, IL-6, IL-10, IL-12, IL-17, MCP-1, MMP-9, and IFNγ levels by enzyme linked immunosorbent assay (ELISA) according to instruction of the manufacturer with a illuminometer at 490 nm. The tissue of epididymal fat and liver were harvested. b Representative photograph of immunofluorescent stained liver tissues for IL-6 (red) and TNF-α (green) visualized using C2t Nikon fluorescent microscope (Morrell, USA). The regions of interest (ROI) are boxed in white, and their magnified images are shown at the bottom. c Representative photographs of immunofluorescent stained adipose tissues for IL-6 (red) and TNF-a (green) visualized using C2t Nikon fluorescent microscope (Morrell, USA). The regions of interest (ROI) are boxed in white, and their magnified images are shown at the bottom. d The protein expression of IL-6 and TNF-α in liver tissue (up) and adipose (down) were evaluated by western blot. e The expression of IL-6 and TNF-α mRNA in liver tissue (left side) and adipose tissue (right side) were evaluated by RT-PCR. Data are presented as mean ± SEM (n = 10). *p < 0.05, **p < 0.01, ***p < 0.001, vs mice in MC group; #p < 0.05, ##p < 0.01, ###p < 0.001, vs mice in EM group, p values were calculated by unpaired two-sided Student’s t-test. Scale bars, 200 μm (b, c bottom left) and 20 μm (b, c, up right)

References

    1. Aron-Wisnewsky J, Clement K. The gut microbiome, diet, and links to cardiometabolic and chronic disorders. Nat. Rev. Nephrol. 2016;12:169–181. doi: 10.1038/nrneph.2015.191. - DOI - PubMed
    1. Burnett JR, Hooper AJ. Running interference to lower cholesterol. Lancet. 2014;383:10–12. doi: 10.1016/S0140-6736(13)61910-8. - DOI - PubMed
    1. Affuso F, Mercurio V, Fazio V, Fazio S. Cardiovascular and metabolic effects of Berberine. World J. Cardiol. 2010;2:71–77. doi: 10.4330/wjc.v2.i4.71. - DOI - PMC - PubMed
    1. Catapano AL, et al. 2016 ESC/EAS Guidelines for the Management of Dyslipidaemias: The Task Force for the Management of Dyslipidaemias of the European Society of Cardiology (ESC) and European Atherosclerosis Society (EAS) Developed with the special contribution of the European Assocciation for Cardiovascular Prevention & Rehabilitation (EACPR) Atherosclerosis. 2016;253:281–344. doi: 10.1016/j.atherosclerosis.2016.08.018. - DOI - PubMed
    1. Kong W, et al. Berberine is a novel cholesterol-lowering drug working through a unique mechanism distinct from statins. Nat. Med. 2004;10:1344–1351. doi: 10.1038/nm1135. - DOI - PubMed

Publication types

MeSH terms