. 2019 Apr 30;10(1):1999.
doi: 10.1038/s41467-019-09913-4.

Lipopolysaccharide inhalation recruits monocytes and dendritic cell subsets to the alveolar airspace

Affiliations

Lipopolysaccharide inhalation recruits monocytes and dendritic cell subsets to the alveolar airspace

Laura Jardine et al. Nat Commun. .

Abstract

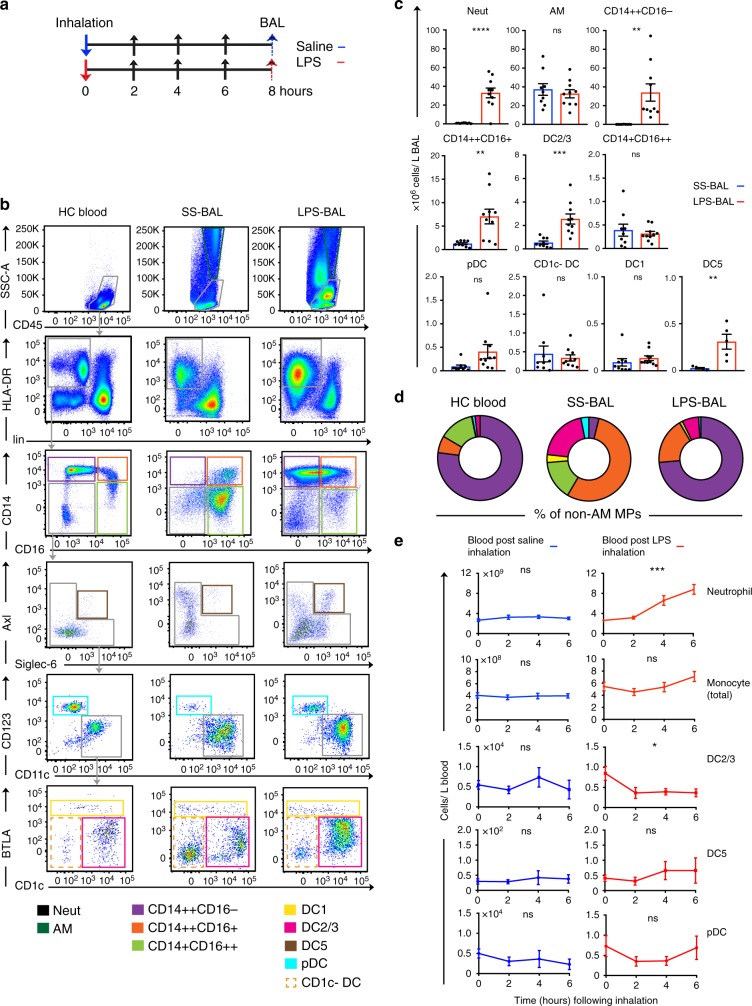
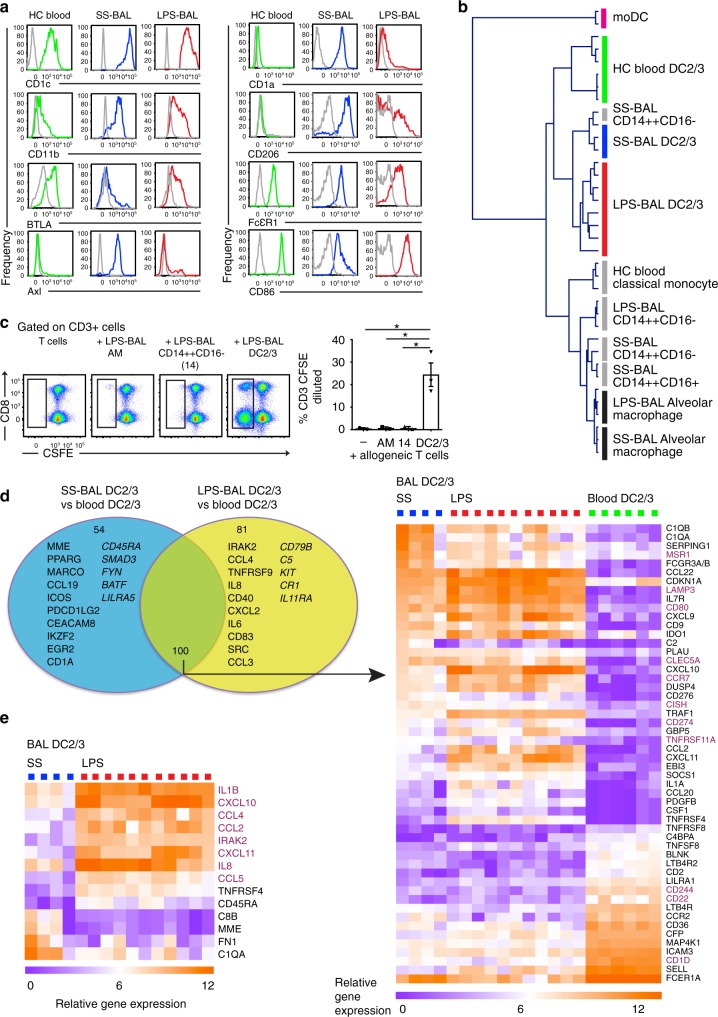
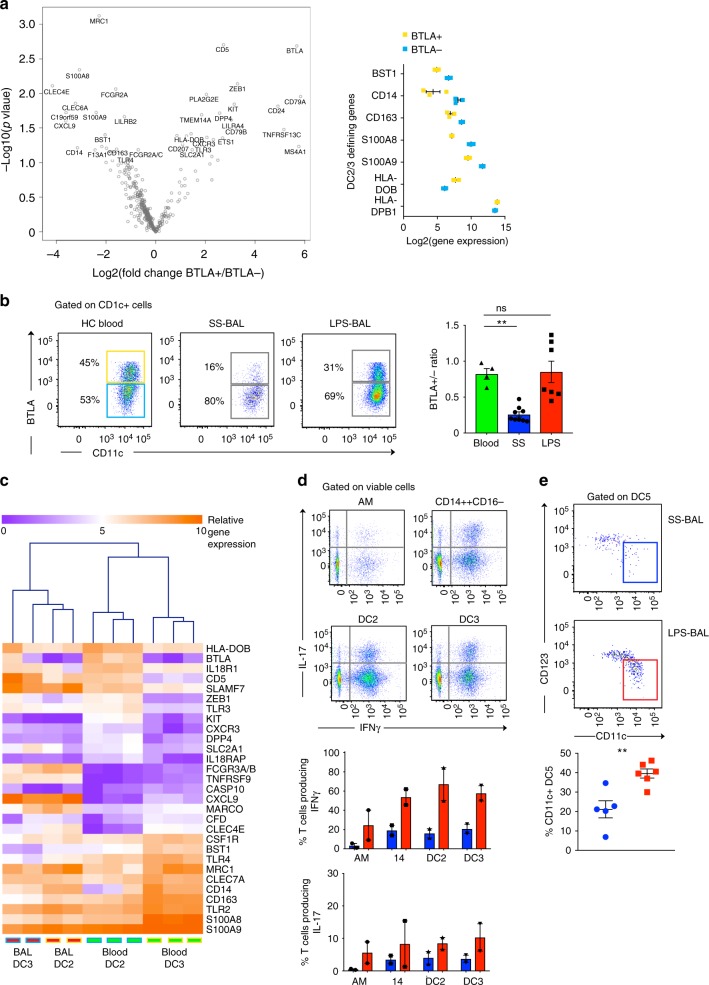
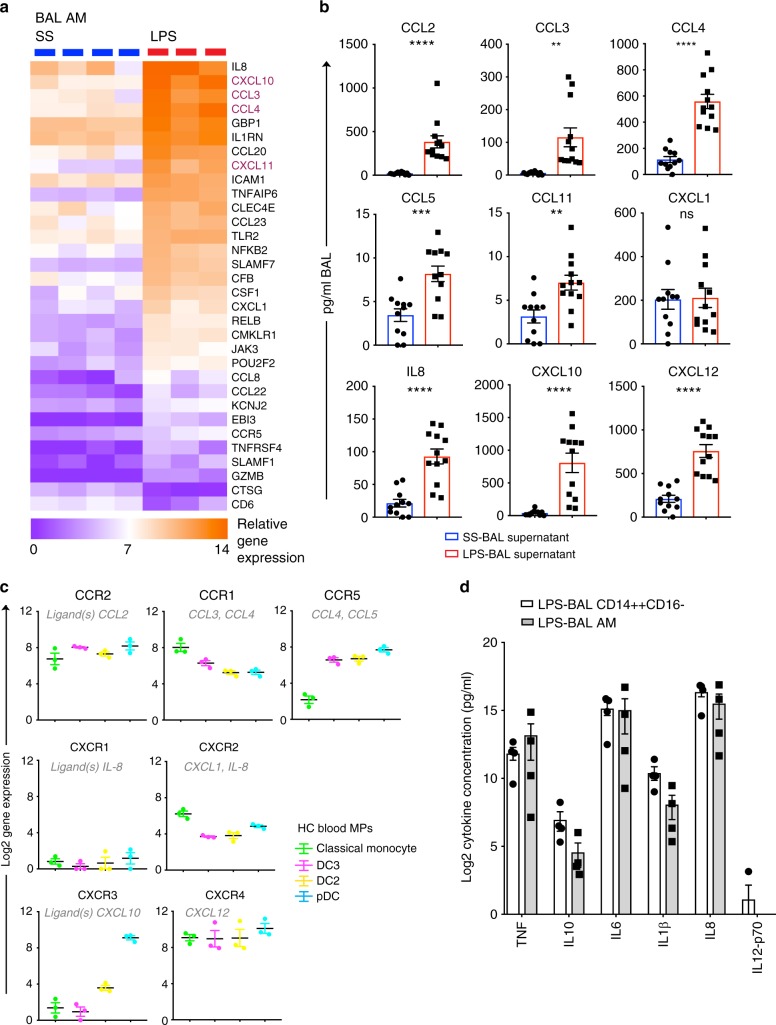
Mononuclear phagocytes (MPs) including monocytes, macrophages and dendritic cells (DCs) are critical innate immune effectors and initiators of the adaptive immune response. MPs are present in the alveolar airspace at steady state, however little is known about DC recruitment in acute pulmonary inflammation. Here we use lipopolysaccharide inhalation to induce acute inflammation in healthy volunteers and examine the impact on bronchoalveolar lavage fluid and blood MP repertoire. Classical monocytes and two DC subsets (DC2/3 and DC5) are expanded in bronchoalveolar lavage fluid 8 h after lipopolysaccharide inhalation. Surface phenotyping, gene expression profiling and parallel analysis of blood indicate recruited DCs are blood-derived. Recruited monocytes and DCs rapidly adopt typical airspace-resident MP gene expression profiles. Following lipopolysaccharide inhalation, alveolar macrophages strongly up-regulate cytokines for MP recruitment. Our study defines the characteristics of human DCs and monocytes recruited into bronchoalveolar space immediately following localised acute inflammatory stimulus in vivo.


Conflict of interest statement

The authors declare no competing interests.

Figures

Fig. 1
Fig. 1
Neutrophils and mononuclear phagocytes are expanded in the alveolar airspace following LPS inhalation. a Schematic overview of study design. Solid arrows denote LPS inhalation (red) or saline inhalation control (blue). Black arrows denote blood sampling. Dashed arrows denote BAL. b Flow cytometry of leukocyte preparations from SS-BAL, LPS-BAL, and HC blood. The CD45 versus SSC plot was used to define CD45+SSChi AM, CD45loSSCmid neutrophils and CD45+SSClo mononuclear cells (see also Supplementary Fig. 1). Monocyte/macrophages and DCs were negative for lineage markers CD3, CD19, CD20, and CD56 and expressed HLA-DR. Monocyte/macrophages were divided into CD14++CD16, CD14++CD16+, and CD14-CD16++ populations analogous to blood classical, intermediate and non-classical monocytes. DCs within the CD14-CD16 gate were divided into subsets: Axl+Siglec6+ DC5s, CD11cloCD123+ pDCs, CD1c+BTLAlo-mid DC2/3s, and BTLAhi DC1s. Plots are representative of n = 9 SS BAL and n = 10 LPS BAL. c Concentrations of neutrophil, monocyte/macrophage and DC subsets in SS-BAL and LPS BAL. Bars represent mean and lines SEM. p-values from unpaired t-tests of SS versus LPS are shown: “ns” p > 0.05, *p < 0.05, **p < 0.01, ***p < 0.001, ****p < 0.0001. d Monocyte/macrophage and DC frequency in HC blood, SS-BAL and LPS-BAL as a proportion of SSClo MHC class II-expressing cells (not-including CD1c- DCs). e Concentration of selected leukocyte populations in peripheral blood at 2-h intervals following inhalation of saline (blue line) or LPS (red line). Data points show mean ± SEM for 3–5 participants. p-values from one-way ANOVA are shown. p-value representation is described in c
Fig. 2
Fig. 2
CD14++CD16 monocyte-macrophage cells in LPS-BAL are recruited blood monocytes with transcriptional adaptations. a Expression of monocyte-subset discriminating genes in CD14++CD16 cells from SS-BAL (blue square) and LPS-BAL (red square) compared with HC blood classical (filled green square), intermediate (divided green square) and non-classical (open green square) monocytes. Gene expression was quantified by NanoString array. The left-hand column contains genes with higher expression in classical than intermediate or non-classical monocytes. The right-hand column contains genes with higher expression in intermediate and non-classical than classical monocytes. Bars represent mean ± SEM. b Principal component analysis of immune gene expression (579-gene NanosString array) by BAL monocyte/macrophages and blood monocyte subsets. c Analysis of differentially expressed genes (DEGs) in BAL CD14++CD16− cells and HC blood monocytes. Comparisons were made by unpaired t-test with p < 0.05 and >3-fold difference in mean expression. Venn diagram shows DEGs in CD14++CD16 MPs from SS-BAL, LPS-BAL and HC blood. Circles represent DEGs between SS BAL and blood (cyan; 101 genes, 22%) and between LPS-BAL and blood (yellow; 124 genes, 27%). The overlapping circles represents DEGs shared between comparisons (49 genes, 11%). The top 10 upregulated genes (standard type) and top 5 downregulated genes (italic type) in BAL relative to blood are listed. Heatmap shows DEGs common to both SS-BAL and LPS-BAL CD14++CD16- cells relative to HC blood classical monocytes. “Relative gene expression” refers to log2 transformed normalized gene expression count data. Genes with >10-fold difference in mean expression are shown. Genes discussed in text are colored burgundy. d Heatmap showing DEGs between SS-BAL and LPS-BAL CD14++CD16 cells. Comparisons were made by unpaired t-test with p < 0.05. Genes with >5-fold difference in expression are shown. Genes discussed in the text are colored burgundy
Fig. 3
Fig. 3
CD1c+ DCs in LPS-BAL are likely to be tissue-recruited blood CD1c+ DCs. a Expression of surface antigens by flow cytometry on DC2/3 from HC blood (green), SS-BAL (blue) and LPS-BAL (red) relative to isotype control (gray). Antigens predicted to discriminate between blood and tissue CD1c+ DCs were tested. Representative plots from more than three experiments are shown. b Dendrogram showing hierarchical clustering of monocyte/macrophage and DC gene expression by indicated subsets isolated from HC blood and SS/LPS BAL. In vitro monocyte-derived DCs were also included. Clustering used Pearson correlation metric. Monocyte/macrophage and DC identifying genes were taken from McGovern et al.. The 25 genes available on the NanoString Immunology v2 panel were used. c Proliferation of allogeneic peripheral blood T cells measured by CSFE dilution during 7-day co-culture with or without MP subsets isolated from LPS BAL. Flow cytometry plots are gated on CD3+ T cells from a representative experiment. Summary graph shows 2–3 replicates per subset. Bars show mean ± SEM. Means were compared by one-way ANOVA with Dunnett’s multiple comparison test of DC2/3 against other subsets. *p < 0.05. d Analysis of differentially expressed genes (DEGs) by DC2/3 from SS/LPS-BAL and HC blood. Comparisons were made by unpaired t-test with p < 0.05 and >3-fold difference in mean expression. Venn diagram shows DEGs in DC2/3 from SS-BAL, LPS-BAL, and HC blood. Circles represent DEGs between SS BAL and blood (cyan; 154 genes, 33%) and between LPS-BAL and blood (yellow; 124 genes, 39%). The overlapping circles represents DEGs shared between comparisons (100 genes, 21%). The top 10 upregulated genes (standard type) and top 5 downregulated genes (italic type) in BAL relative to blood are listed. Heatmap shows DEGs common to DC2/3 in both SS-BAL and LPS-BAL relative to HC blood. Genes with >10-fold difference in mean expression are shown. Genes discussed in the text are colored burgundy. e Heatmap showing DEGs between DC2/3 from SS-BAL and LPS-BAL. Genes with >10-fold difference in mean expression are shown. Genes discussed in the text are colored burgundy
Fig. 4
Fig. 4
The pool of recruited LPS-BAL CD1c+ DCs contains DC2 and DC3, which are functionally altered on entry to the inflamed airspace. a Volcano plot shows DEGs between BTLA+ and BTLA CD1c+ DCs from HC blood. DEGs were calculated by unpaired t-test with p-value adjustment using Benjamini-Yekutieli method. Genes with p < 0.05 are displayed as text. Accompanying scatterplots verifiy that that blood BTLA+ and BTLA CD1c+ DCs exhibit the expected gene expression profile of DC2 and DC3 respectively. Plots show expression from n = 3 samples with bars showing mean ± SEM. b Comparison of BTLA+:BTLA ratio in CD1c+ DCs from HC blood, SS-BAL and LPS-BAL by flow cytometry. The gating strategy represented in Fig. 1b was used to define CD1c+ cells. Flow cytometry plots show percentage of BTLA+ and BTLA CD1c+ cells in representative examples of blood, SS-BAL and LPS-BAL. Accompanying bar graph summarizes flow cytometry data from n = 4–9 replicates. Statistical comparison by one-way ANOVA with Dunnett’s multiple comparisons tests. ns p > 0.05, **p < 0.01. c Heatmap showing expression of the 29 genes with differential expression between blood DC2 and DC3 (p < 0.05 and fold difference >2) in DC2 and DC3 sorted from LPS-BAL and HC blood. Samples were clustered using Euclidian distance metric. d Flow cytometry read-out of a T cell cytokine production assay following 10-day co-culture of allogeneic peripheral blood CD4+ T cells with macrophages and DCs isolated from LPS-BAL. Accompanying bar graphs summarize flow cytometry data showing mean ± SEM IFN-γ and IL-17 production following co-culture of SS-BAL (blue bars) or LPS-BAL (red bars) macrophages and DCs (each n = 2). Two-way ANOVA of IFN-γ production gives ***p < 0.001 for SS-BAL vs. LPS-BAL and ns p = 0.07 for MP type. Two-way ANOVA of IL-17 production gives ns p = 0.06 for SS-BAL vs. LPS-BAL and ns p = 0.67 for MP type. e Flow cytometry plots show representative examples of CD123 and CD11c expression by Axl+Siglec6+ DC5 in SS-BAL and LPS-BAL. The gating strategy represented in Fig. 1b was used to define DC5. Gates demarcate CD11c-expressing cells. Accompanying scatterplot summarizes flow cytometry data, showing proportions of DC5 expressing CD11c in SS-BAL (blue circles) and LPS-BAL (red squares). **p < 0.01 by unpaired t-test
Fig. 5
Fig. 5
Alveolar macrophages recruit monocytes and DCs and secrete pro-inflammatory cytokines upon acute LPS challenge in vivo. a Heatmap of immune genes showing differential expression between AM isolated from saline BAL and LPS BAL. Genes with>5 fold difference in expression and p < 0.05 are shown. Genes discussed in the text are colored burgundy. b Quantification of chemokines in SS-BAL (blue bars) and LPS-BAL (red bars) supernatant by multiplexed ELISA (Luminex). Bars show mean ± SEM. By unpaired t-test, ns, not significant, **p < 0.01, ***p < 0.001, ****p < 0.0001. c Chemokine receptor gene expression on HC blood classical monocytes (green), DC2 (yellow), DC3 (pink) and pDC (cyan) quantified by Nanostring. Bars show mean ± SEM of n = 3 for each subset. Log2 gene expression is shown. Ligands for each receptor are listed in gray italic type. d Inflammatory cytokine production by CD14++CD16 cells and AM retrieved from LPS BAL (each n = 4) and stimulated ex-vivo with LPS 100 ng ml−1 for 10 h. Cytokines were measured by cytometric bead array. Bars show mean ± SEM. CD14++CD16 cells were compared with AM by t-tests with Holm-Sidak multiple comparison correction and alpha < 0.05. No comparisons were significant

References

    1. Scott CL, Henri S, Guilliams M. Mononuclear phagocytes of the intestine, the skin, and the lung. Immunol. Rev. 2014;262:9–24. doi: 10.1111/imr.12220. - DOI - PubMed
    1. Ginhoux F, Guilliams M. Tissue-resident macrophage ontogeny and homeostasis. Immunity. 2016;44:439–449. doi: 10.1016/j.immuni.2016.02.024. - DOI - PubMed
    1. Tamoutounour S, et al. Origins and functional specialization of macrophages and of conventional and monocyte-derived dendritic cells in mouse skin. Immunity. 2013;39:925–938. doi: 10.1016/j.immuni.2013.10.004. - DOI - PubMed
    1. Varol C, et al. Monocytes give rise to mucosal, but not splenic, conventional dendritic cells. J. Exp. Med. 2007;204:171–180. doi: 10.1084/jem.20061011. - DOI - PMC - PubMed
    1. Zigmond E, et al. Ly6C hi monocytes in the inflamed colon give rise to proinflammatory effector cells and migratory antigen-presenting cells. Immunity. 2012;37:1076–1090. doi: 10.1016/j.immuni.2012.08.026. - DOI - PubMed

Publication types

MeSH terms