

Review
doi: 10.1038/s41592-019-0395-x.
Epub 2019 Apr 29.
The cryo-EM method microcrystal electron diffraction (MicroED)
Affiliations
- PMID: 31040436
- PMCID: PMC6568260
- DOI: 10.1038/s41592-019-0395-x
Item in Clipboard
Review
The cryo-EM method microcrystal electron diffraction (MicroED)
Nat Methods.
2019 May.
Erratum in
-
Publisher Correction: The cryo-EM method microcrystal electron diffraction (MicroED).Nat Methods. 2021 May;18(5):574. doi: 10.1038/s41592-021-01114-6. Nat Methods. 2021. PMID: 33776060 No abstract available.
Abstract
In 2013 we established a cryo-electron microscopy (cryo-EM) technique called microcrystal electron diffraction (MicroED). Since that time, data collection and analysis schemes have been fine-tuned, and structures for more than 40 different proteins, oligopeptides and organic molecules have been determined. Here we review the MicroED technique and place it in context with other structure-determination methods. We showcase example structures solved by MicroED and provide practical advice to prospective users.
Figures
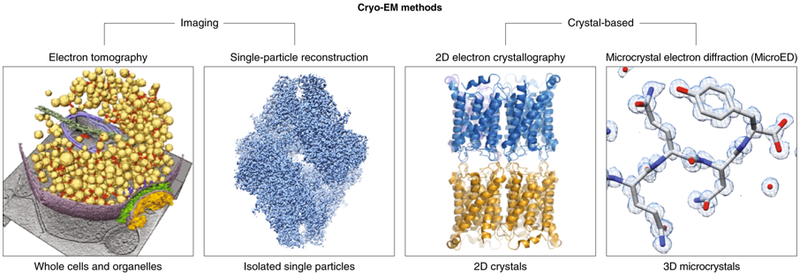
The diverse imaging-based or diffraction-based techniques within cryo-electron microscopy can provide structural information from a wide range of samples. Images shown for the different techniques are the synaptosome (electron tomography), 2.2 Å reconstruction of beta-galactosidase (single particle reconstruction), 1.9 Å structure of aquaporin-0 (2D-electron crystallography), and 1.0 Å structure of the NNQQNY Sup35 prion fragment (MicroED).
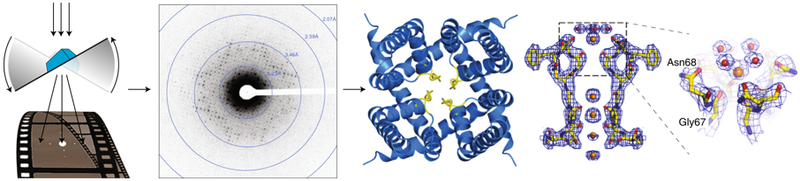
MicroED data are collected as movies while the stage of the cryo-EM is continuously rotated. This produces a series of high-resolution diffraction patterns that can be processed to produce high-resolution structures directly from microcrystals. Here the structure of the non-selective ion channel NaK is illustrated.
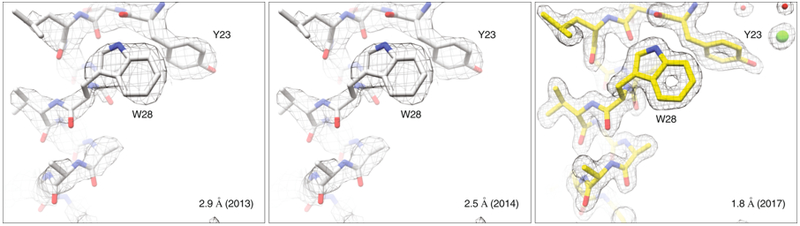
Continual development of MicroED has led to steady improvements in the quality of structures obtained. This can be seen by the increases in resolution that are possible from similar lysosome microcrystals. Density maps (2Fo-Fc) in gray are contoured at 1.5σ for all structures shown.
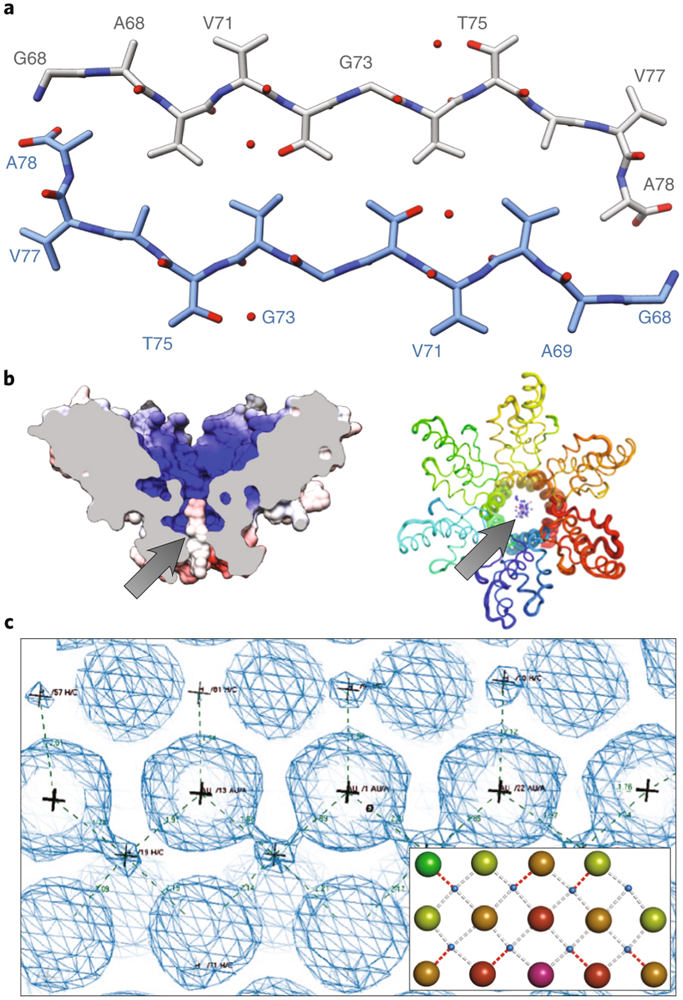
(A) The NACore fragment from α-synuclein was determined to 1.4 Å resolution. (B) Gag-bevirimat MicroED structures (side and top views shown with a surface and ribbon representation, respectively), where the location of the bevirimat (arrows) and its interactions with the Gag complex could be determined. (C) 2Fo-Fc density map (contoured at 2.0σ) from MicroED data of Au146(p-MBA)57 where rows of ligand stabilized gold atoms can be clearly seen. The modeled atoms are shown in the inset.
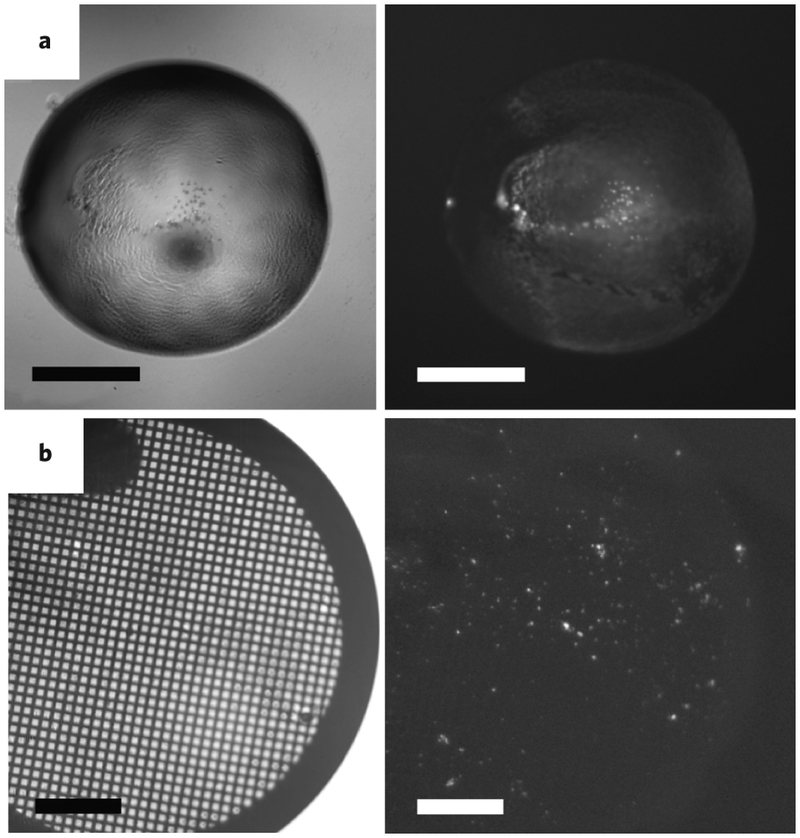
(A) Frequently, identification of microcrystals in drops that appear to have cloudy precipitates is difficult by visible light (left panel); however, when the drops are imaged using UV fluorescence, the presence of microcrystals is clearly seen by sharp glowing spots (right panel). (B) UV fluorescence can also be used to visualize the presence of microcrystals deposited on the EM grid during sample preparation for EM. Scale bars represent 500 μm.
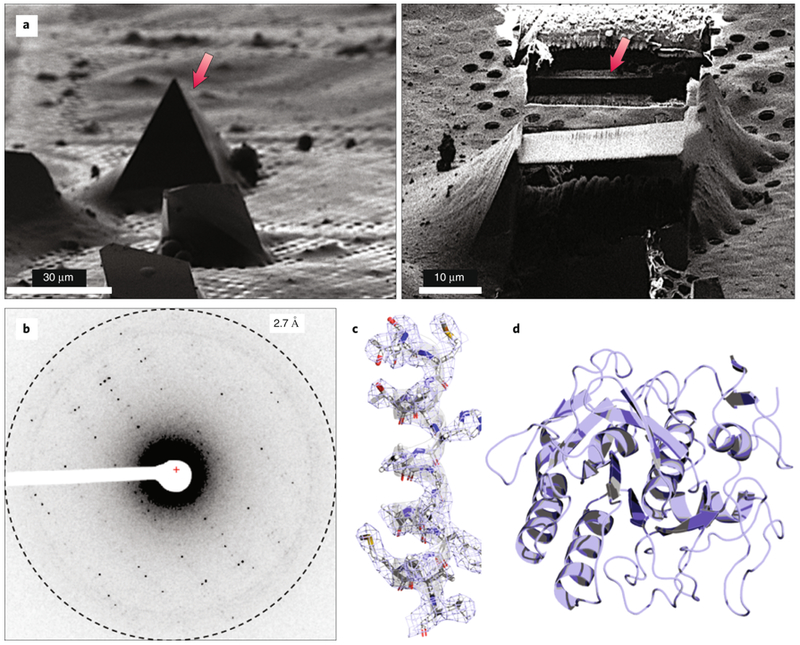
(A) Sample preparation for MicroED using a cryo-FIB to mill down thick crystals to a few hundred nanometers (left and right). (B) Following cryo-FIB milling, the grid would be loaded into the TEM and diffraction data would be collected from the thin lamella. (C-D) Final structure of proteinase K.
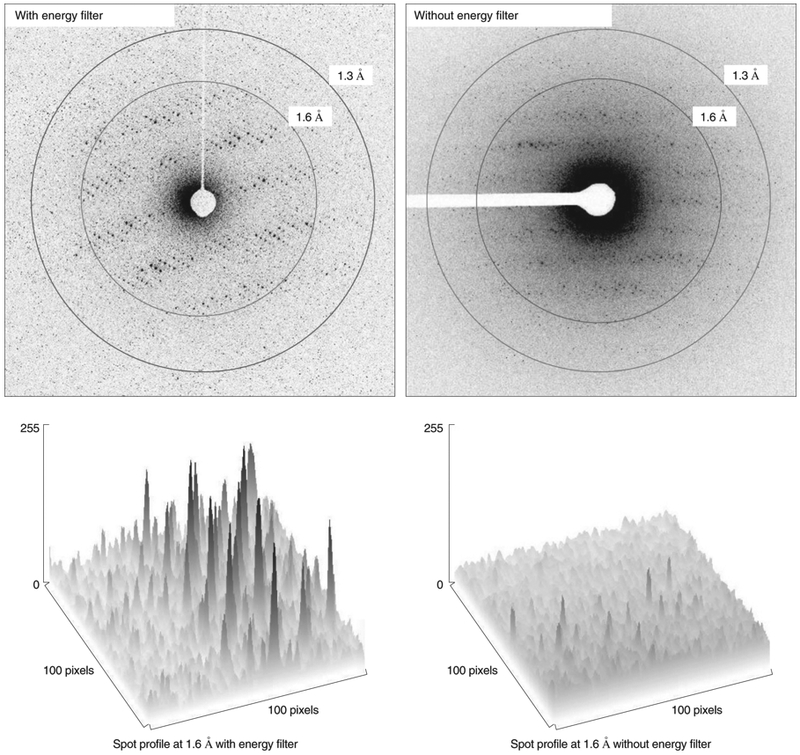
The zero-loss data collected on a cryo-TEM equipped with an in-column energy filter shows much less diffuse scattering at lower resolutions.
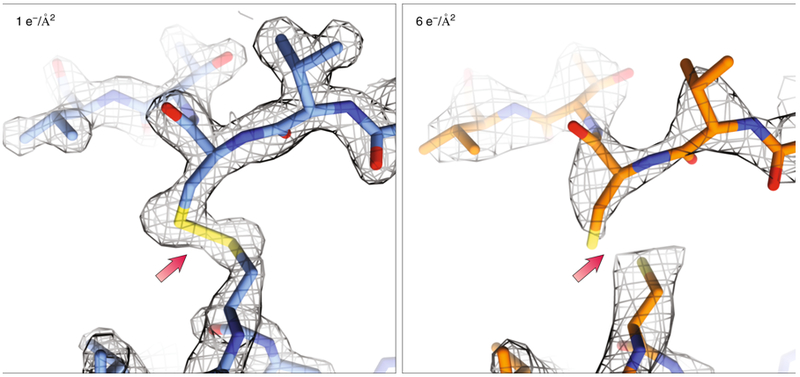
When less than 1 e−/Å2 (left) was used for structure determination of Proteinase K (1.7Å, PDB ID: 6CL7), local radiation damage was minimal. When higher doses (right) were used (2.8Å, PDB ID: 6CLA) the damaging effects of the beam can already be seen with the breakage of disulfide bonds and the lower attainable resolution. Density maps (2Fo-Fc) in gray are contoured at 1.5σ.
References
-
- Beck M & Baumeister W Cryo-Electron Tomography: Can it Reveal the Molecular Sociology of Cells in Atomic Detail? Trends Cell Biol 26, 825–837 (2016). - PubMed
-
- Glaeser RM Review: electron crystallography: present excitement, a nod to the past, anticipating the future. J Struct Biol 128, 3–14 (1999). - PubMed
Publication types
MeSH terms
Substances
Grants and funding
LinkOut - more resources
Full Text Sources
Other Literature Sources
