. 2019 Apr 23:15:1176934319843515.
doi: 10.1177/1176934319843515. eCollection 2019.

A Commentary on Diversity Measures UniFrac in Very Small Sample Size

Affiliations

A Commentary on Diversity Measures UniFrac in Very Small Sample Size

Judith Agueda Roldán Ahumada et al. Evol Bioinform Online. .

Abstract

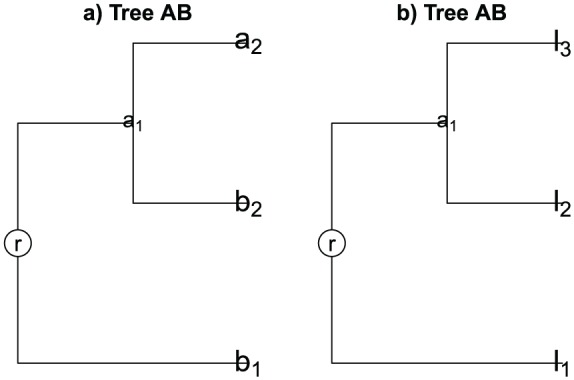
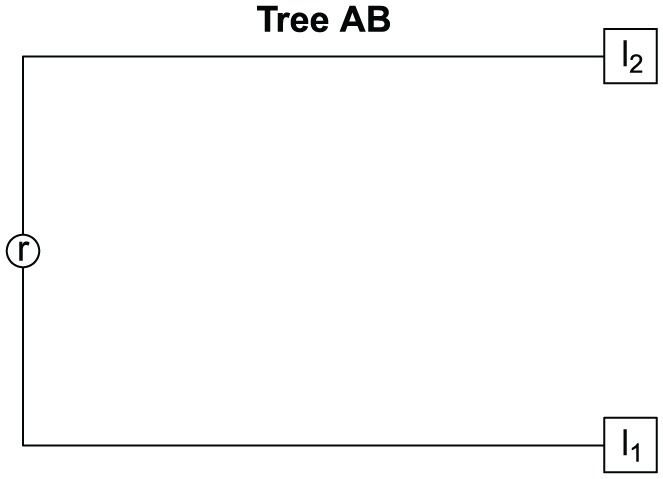
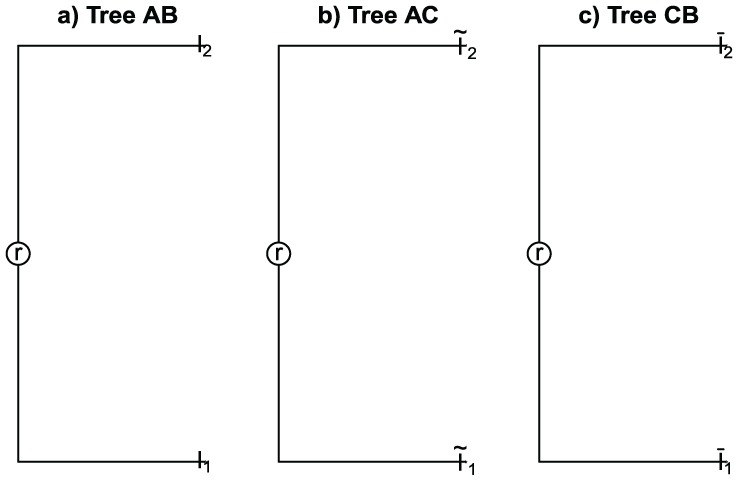
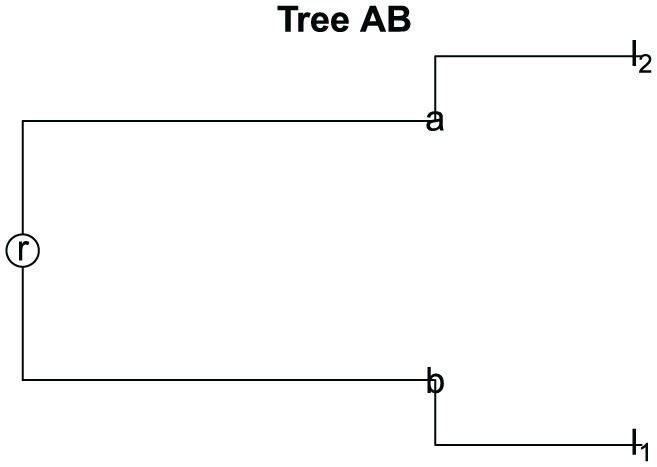
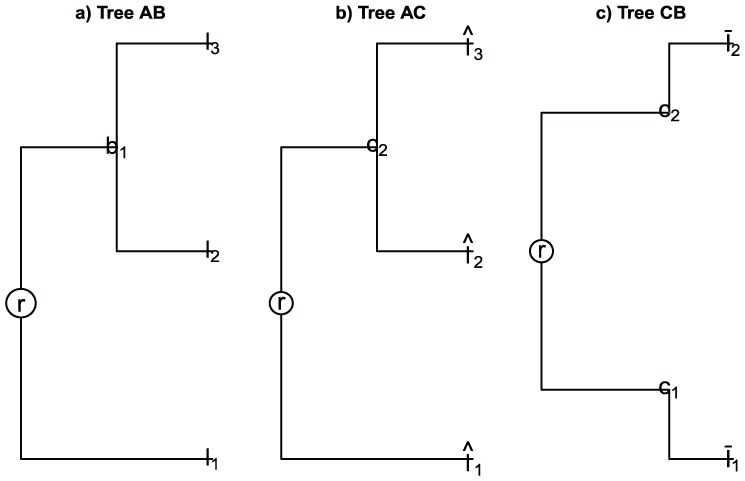
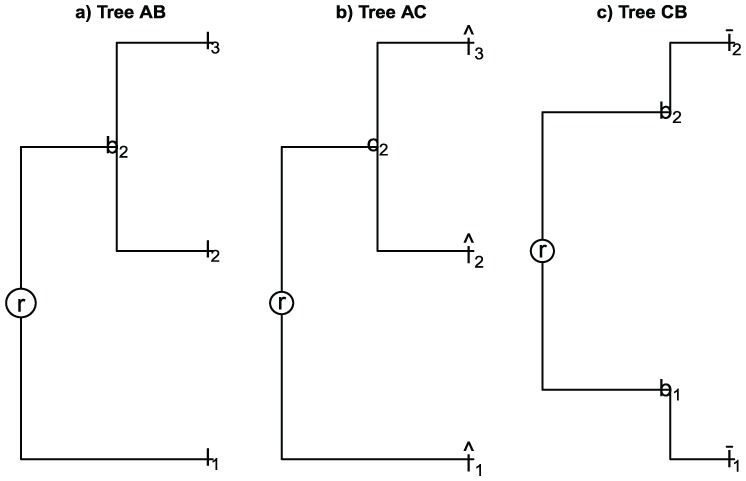
In phylogenetic, the diversity measures as UniFrac, weighted UniFrac, and normalized weighted UniFrac are used to estimate the closeness between two samples of genetic material sequences. These measures are widely used in microbiology to compare microbial communities. Furthermore, when the sample size is large enough, very good results have been obtained experimentally. However, some authors do not suggest using them when the sample size is very small. Recently, it has been mentioned that the weighted UniFrac measure can be seen as the Kantorovich-Rubinstein metric between the corresponding empirical distributions of samples of genetic material. Also, it is well known that the Kantorovich-Rubinstein metric complies the metric definition. However, one of the main reasons to establish it is that the sample size is large enough. The goal of this article is to prove that the diversity measures UniFrac are not metrics when the sample size is very small, which justifies why it must not be used in that case, but yes the Kantorovich-Rubinstein metric.

Keywords: phylogenetic; phylogenetic tree; pseudometric; semimetric.


Conflict of interest statement

Declaration of conflicting interests:The author(s) declared no potential conflicts of interest with respect to the research, authorship, and/or publication of this article.

Figures

Figure 1.
Figure 1.
(a) Tree for samples A and B. (b) Tree for samples A and B with the label leaves for li with i=1,2,3 (b1=l1,b2=l2,a2=l3).
Figure 2.
Figure 2.
Tree for samples A and B.
Figure 3.
Figure 3.
(a) Tree for samples A and B. (b) Tree for samples A and C. (c) Tree for samples C and B.
Figure 4.
Figure 4.
Tree for samples A and B.
Figure 5.
Figure 5.
(a) Tree for samples A and B. (b) Tree for samples A and C. (c) Tree for samples C and B.
Figure 6.
Figure 6.
(a) Tree by samples A and B. (b) Tree by samples A and C. (c) Tree by samples C and B.

References

    1. Lozupone CA, Knight R. UniFrac: a new phylogenetic method for comparing microbial communities. Appl Environ Microbiol. 2005;71:8228–8235. - PMC - PubMed
    1. Lozupone CA, Hamady M, Kelley ST, Knight R. Quantitative and qualitative β diversity measures lead to different insights into factors that structure microbial communities. Appl Environ Microbiol. 2007;73:1576–1585. - PMC - PubMed
    1. Frank DN, Amand ALS, Feldman RA, Boedeker EC, Harpaz N, Pace NR. Molecular-phylogenetic characterization of microbial community imbalances in human inflammatory bowel diseases. Proc Natl Acad Sci U S A. 2007;104:13780–13785. - PMC - PubMed
    1. Costello EK, Lauber CL, Hamady M, Fierer N, Gordon JI, Knight R. Bacterial community variation in human body habitats across space and time. Science. 2009;326:1694–1697. - PMC - PubMed
    1. Charlson ES, Bittinger K, Haas AR, et al. Topographical continuity of bacterial populations in the healthy human respiratory tract. Am J Respir Crit Care Med. 2011;184:957–963. - PMC - PubMed

LinkOut - more resources