. 2019 Apr 16:10:829.
doi: 10.3389/fimmu.2019.00829. eCollection 2019.

Antigen Extraction and B Cell Activation Enable Identification of Rare Membrane Antigen Specific Human B Cells

Affiliations

Antigen Extraction and B Cell Activation Enable Identification of Rare Membrane Antigen Specific Human B Cells

Maria Zimmermann et al. Front Immunol. .

Abstract

Determining antigen specificity is vital for understanding B cell biology and for producing human monoclonal antibodies. We describe here a powerful method for identifying B cells that recognize membrane antigens expressed on cells. The technique depends on two characteristics of the interaction between a B cell and an antigen-expressing cell: antigen-receptor-mediated extraction of antigen from the membrane of the target cell, and B cell activation. We developed the method using influenza hemagglutinin as a model viral membrane antigen, and tested it using acetylcholine receptor (AChR) as a model membrane autoantigen. The technique involves co-culturing B cells with adherent, bioorthogonally labeled cells expressing GFP-tagged antigen, and sorting GFP-capturing, newly activated B cells. Hemagglutinin-specific B cells isolated this way from vaccinated human donors expressed elevated CD20, CD27, CD71, and CD11c, and reduced CD21, and their secreted antibodies blocked hemagglutination and neutralized viral infection. Antibodies cloned from AChR-capturing B cells derived from patients with myasthenia gravis bound specifically to the receptor on cell membrane. The approach is sensitive enough to detect antigen-specific B cells at steady state, and can be adapted for any membrane antigen.

Keywords: autoimmunity; human monoclonal antibodies; membrane protein antigens; myasthenia gravis; trogocytosis.


Figures
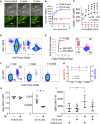
Figure 1
Figure 1
Identification of Hemagglutinin-Specific Transgenic Mouse B Cells by Capture of Membrane-Expressed HA-GFP. (A) Live Cell Imaging of membrane antigen capture. Hemagglutinin-specific FluBI B cells (white arrows) labeled with Lysotracker Deep Red (LTR, magenta) are added to cells (white asterisks) expressing a fusion protein comprising the transmembrane and antigenic extracellular domains of hemagglutinin, with a cytoplasmic GFP moiety (HA-GFP, green). Extracellular location of the HA epitope, and the intracellular location of GFP were confirmed by examining sensitivity to extracellular protease (Supplementary Figure 1). Images show the initial contact between a B cell and an antigenic target cell, then the same location at 6 and 9 min later. The upper three micrographs show both fluorescent channels merged with a transmitted light channel to show the morphology of the cells (single confocal planes). The lower panels show only the GFP channel (maximum intensity projections) to show capture of antigen (scale bar =10 um). (B) Extraction of membrane-expressed HA-GFP by antigen-specific or antigen-irrelevant B cells. HA-specific FluBI B cells were labeled with Cell Trace Violet (CTV), mixed with unlabeled, antigen-irrelevant, C57 mouse B cells at a ratio of 1:10, and added to an adherent layer of TE671 cells stably transfected with membrane-expressed HA-GFP. At the indicated time points, the B cells were retrieved, immunolabeled with anti-B220 antibody, and interrogated by flow cytometry. The FluBI cells were separated from the C57 B cells by CTV label, and GFP levels were compared between the two cell types. Points and bars show mean and standard deviation of the geometric mean GFP fluorescence. (C) Time-course of CD69 upregulation. HA-specific FluBI mouse B cells were exposed to HA-expressing TE HA, or HA-non-expressing TE cells (TE 0) for the indicated times, and then retrieved, immunolabeled for B220 and CD69 and measured by flow cytometry. Vertical axis shows the geometric mean immunofluorescence intensity and SEM of the anti-CD69 signal on B cells exposed to TE HA (black lines and squares), or TE 0 (red lines and circles). Asterisks show significant difference between TE 0 and TE HA conditions at each time point (two-way ANOVA, followed by Sidak's multiple comparison test, (ns = not significant, **p < 0.01, ***p < 0.001, ****p < 0.0001). (D) Comparison of techniques for labeling antigen-specific B cells. CTV-labeled, polyclonal C57 mouse B cells were spiked with 1% unlabeled HA-specific FluBI B cells, and the mixture subjected either to labeling with Alexa-633-labeled soluble hemagglutinin (left), or to co-culture with adherent TE HA-GFP cells (right). Dot plots show flow cytometric measurements of CTV on the horizontal axis (CTV-negative, HA-specific FluBI cells appear to the left of the C57 cells), and the antigen labels on the vertical axes. The frequency of B cells recognizing this hemagglutinin is more than 90% in FluBI mice, but < 1 per 100,000 among polyclonal B cells from naïve, wild-type C57 mice (18), implying that the majority of the wild-type C57 B cells that bind antigen in this context can be considered false positives, whose binding is BCR-independent. (E) Receiver Operating Characteristic (ROC) Curves comparing the two methods shown in (D). For three experiments like (D), true- and false positive rates were calculated for each method at various thresholds. The red curve shows the resulting ROC curve for the soluble hemagglutinin label and the blue curve for the membrane-expressed hemagglutinin-GFP fusion protein. Areas under the curves were calculated for each method for three experiments, and compared by two-tailed, paired t-test. The schematic on the right shows the four populations, true positives (TP, red), false positives (FP, magenta), false negatives (FN, black), and true negatives (TN, blue) at a given threshold (example threshold shown here by a broken black line). (F) Discriminating antigen-specific cells using membrane capture at different target cell frequencies. 106 unlabeled C57 mouse B cells were spiked with 1, 0.1, or 0.01% of CTV-labeled HA-specific FluBI B cells [note that the CTV labels the spike in this paradigm, opposite to the paradigm shown in (D)], and the mixture co-cultured with adherent TE HA-GFP cells. A threshold was set at approximately 0.1% false positives, the FluBI and C57 cells were distinguished using the CTV label. Then, we calculated the sensitivity [true positives/(true positives + false negatives)] and specificity [true negatives/(true negatives + false positives)]. (G) Performance of antigen-capture labeling at different target cell frequencies. Data from three experiments like (E) are plotted on two vertical axes, at the target cell frequencies shown on the horizontal axis. Specificity is plotted with open blue circles on a blue line on the right axis (0.97–1.0), and sensitivity is plotted with red crosses on a red line on the left axis (0.0–1.0). (H) Effect of extracellular fluorphore quenching on apparent antigen signal. After co-culture with TE HA-GFP cells, FluBI B cells (left column scatter graph) or wild-type C57 B cells (right column scatter graph) were measured by flow cytometry in the presence or absence of 0.1% trypan blue. The vertical axis shows the ratio of GFP+ cells to GFP negative cells. Asterisk shows significant difference between trypan blue treatment conditions (*p < 0.05, unpaired, two-tailed t-test). Pooled data from two independent experiments. (I) Effect of permeabilization on antigen immunodetection. After co-culture with TE HA-GFP cells, FluBI B cells (1st and 3rd columns) or wild-type C57 B cells (2nd and 4th columns) were fixed, and either permeabilized with saponin or not, before immunolabeling with a rabbit anti-HA antibody and an A647-conjugated anti-rabbit secondary antibody. The vertical axis shows the flow cytometric geometric mean fluorescence intensity of the secondary antibody. Asterisk shows significant difference between permeabilization conditions within the FluBI condition (*p < 0.05, unpaired, two-tailed t-test). Pooled data from three independent experiments.
Figure 2
Figure 2
Schematic depiction of process for isolation antigen-specific B cells using adhesion to antigen-expressing cells, fluorescent antigen capture, upregulation of B cell activation markers, and fluorescence-activated cell sorting.
Figure 3
Figure 3
Isolation of Human Hemagglutinin-Specific B Cells by Capture of Membrane-Expressed HA-GFP. (A) Gating of HA-GFP-capturing B cells. Polyclonal human B cells were cultured for 3 h on an adherent layer of TE HA-GFP cells, then retrieved and labeled with an anti-CD19 antibody and the CD19-positive, GFP-high cells were sorted by FACS. (B) Enumeration of HA-specific antibody-secreting cells by ELIspot. 400 GFP-capturing B cells sorted as shown in (A), or the same number of GFP-negative cells, or 100,000 unsorted polyclonal B cells from the same donor were incubated in ELIspot wells coated with hemagglutinin for 3 days, then the spots of antibody were visualized with anti-human IgG secondary antibody. (C) Enrichment of antigen-specific B cells by membrane antigen capture. Three experiments like the one described in (B) were completed, using B cells from donors 2 weeks after immunization, and for each the frequencies of HA-specific IgG-producing cells among the GFP-capturing population and the unsorted population were calculated and compared by two-tailed paired t-test. The mean frequency was enriched by ~100-fold from 0.04 to 3% (*p < 0.05). (D) EBV-immortalized clones derived from HA-GFP-capturing B cells. GFP-capturing or non-capturing B cells were sorted as in (C), immortalized with Epstein Barr Virus (EBV), and cultured for 4 weeks. The supernatants were screened by flow cytometry for anti-HA IgM and IgG. Vertical axis shows the log ratio of immunofluorescence on HA-expressing cells divided by the same value for non-expressing control cells: i.e., a value of 0 implies no specific binding. Supernatants plotted with red triangles in the 4th column (HA-specific IgG-containing supernatants clones derived from GFP-capturing B cells) were screened for hemagglutination inhibition and virus neutralization. (E) Neutralization of influenza virus by supernatants from EBV clones. Supernatants from the clones shown with red triangles in (D) were incubated with live influenza A/California/2009 virus at the indicated dilutions and then the virus was added to MDCK cells. After 16 h, the cells were fixed and productive infection detected by immuno-colorimetry. Vertical axis shows optical density at 450 nm, and values <0.15 imply viral inhibition. Here, clone A10 exhibits minimal neutralization, and clone A4 shows neutralization down to a dilution factor of 212 (1:4,096, or 50 ng/ml).
Figure 4
Figure 4
Single Cell Cloning and Immunoglobulin Sequencing of Hemagglutinin-Extracting Human B Cells. (A) Gating of HA-GFP-capturing B cells. Human B cells were cultured for 3 h on an adherent layer of TE HA-GFP cells, then retrieved and labeled. CD45-positive, GFP-high cells were sorted by FACS and dispensed into wells of 384-well plates at 1.6 cells per well. (B) Specificities of IgG in supernatants from high-throughput B cell cultures. GFP-high and GFP-negative B cells were sorted and distributed into wells as in (A), and expanded for 18 days with irradiated PBMC and cytokines. The supernatants were then screened by ELISA for total IgM, total IgG, and binding to hemagglutinin (HA), tetanus toxoid (Tetanus), or Bovine Serum Albumin (BSA). Vertical axes show the optical density at 450 nm. Red symbols correspond to supernatants binding to HA, of which there are 34 derived from GFP-high cells and one from a GFP-negative cell. IgG from the single GFP-negative cell-derived clone also bound to other antigens and was deemed non-specific. Raw numbers, and ELISA optical densities of IgG-producing, and HA-specific IgG-producing clones are shown in Supplementary Figure 6. (C) Distribution of mutations in the immunoglobulin genes of hemagglutinin-capturing B cells. RNA from the cultures described in (B) was reverse-transcribed and segments corresponding to variable regions of heavy, lambda, and kappa chains were amplified by PCR. We examined antigen binding of the recovered recombinant antibodies to confirm the correct pairing of heavy and light chains, and compared sequences of the cloned gene segments with the closest germline sequences from publicly available databases. Germline conservation is indicated by the percentage of nucleotide identity to the nearest-match V gene segment for each of the germline-encoded structural components: FR1, framework 1; CDR1, complementarity-determining region 1; FR2, framework 2; CDR2, complementarity-determining region 2; FR3, framework 3. Amino acid sequences and inferred V, D, and J gene segments are shown in Supplementary Table 1. (D) Comparison of somatic hypermutation in heavy chain immunoglobulin sequences isolated from HA-enriched (HA-GFP-capturing) and HA-binding (in first-round screen) hits vs. hemagglutinin-non-binding control sequences. Hemagglutinin-specific VH sequences (n = 32) represent antibodies that were verified to bind HA after cloning and re-expression. HA-non-binding VH sequences (n = 33) represent heavy chains that were cloned from wells containing HA-binding antibodies, but did not contribute to a hemagglutinin-binding heavy-light chain pair in the validation screen. p-values from Mann-Whitney test. Germline identity was assessed with IgBLAST using the IMGT germline database.
Figure 5
Figure 5
Identification of Antigen-Specific Population with Antigen-Associated and Antigen-Independent Labels. (A) BCR-dependent and non-specific antigen uptake. B cells were co-cultured for 3 h with TE HA-GFP cells, of which the extracellular domains of membrane proteins had been additionally labeled with Alexa 647 (A647) by click chemistry. B cells were then retrieved and immunolabeled for CD19, measured by flow cytometry, and gated on single B cells. The plot shows GFP intensity plotted against A647 intensity, both for the B cell population (blue pseudocolor, lower half of the figure), and, for comparison, the antigen-expressing TE cells (magenta, upper right corner). Most B cells capture neither HA-GFP, nor other proteins (bottom left corner of plot). Two populations of B cells acquire HA-GFP: those that acquire high GFP and intermediate A647 (“MACB”–membrane antigen-capturing B cells, broken red oval); and those that also acquire large quantities of A647 (labeled “FP”–false positive, broken yellow oval). Gating is shown in Supplementary Figure 3. (B) Increase in numbers of HA-GFP capturing cells after immunization. B cells from nine donors were collected before and 1 week after influenza immunization, and then all 18 samples were assayed as above. Numbers of cells falling in the MACB gate (1st and 2nd scatter columns, left vertical axis), and the FP gate (3rd and 4th scatter columns, right vertical axis) shown in (A) were compared before and after immunization for each donor by two-way ANOVA followed by Sidak's test. Vertical axes show numbers of cells in the gates per 100,000 B cells measured. Bars show means and standard deviations *p < 0.05. (C) Histograms of CD69 expression by the cells in the three populations. CD69 expression on cells in populations MACB, FP, and the global B cell pool was measured by flow cytometry. The horizontal bar on the right of the plot marked “CD69-high” shows the gate used to determine the percentages shown in (D), and also in analyses hereafter of the “CD69-high” sub-population of antigen-extracting cells. (D) CD69 expression, and response to immunization by the cells in the three populations. Samples from nine donors taken before and after immunization were measured and gated as in (C), and the levels of CD69 compared between populations and between time points by two-way ANOVA, followed by Dunnett's test to compare the two populations with the whole B cell pool, and Sidak's test to compare pre- vs. post-immunization within each population (****p < 0.0001).
Figure 6
Figure 6
Phenotypes of Hemagglutinin-Specific B Cells from Peripheral Blood. For the nine donors shown in Figure 5D, expression of markers was compared between MACB cells (solid red circles) and the whole B cell population (open blue circles), before (left on each plot) and after (right on each plot) immunization, by two-way repeated measures ANOVA. Paired samples from each donor are linked by black lines. Four donors were assessed with an antibody panel including CD11c and CD71, and 5 donors assessed with a panel including CD38 instead. For all parameters shown except IgD and CD138 there was a significant interaction between population and time-point, so the antigen-extracting population was compared to the whole population at the two time-points independently with Sidak's test (*p < 0.05, **p < 0.01, ***p < 0.001, ****p < 0.0001).
Figure 7
Figure 7
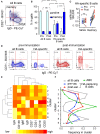
Antigen Experience Profiles of Hemagglutinin-Specific B Cells Detected in Human Blood. (A) Representative dot plot of IgD vs. CD27 expression. Human peripheral blood B cells were co-cultured and analyzed by flow cytometry as described in Figure 5. The plot shows IgD immunofluorescence on the horizontal axis and CD27 immunofluorescence on the vertical axis, for the whole B cell population. Percentages of events in the “memory” and “naïve” quadrants shown were used to generate (B), and absolute numbers of cells in these quadrants were used to generate (C). (B) Proportions of events in the naïve (light blue bars) and memory (dark blue bars) quadrants in samples taken before and after immunization. Left half of bar chart shows proportions of naïve and memory cells in the whole B cell pool; right half shows proportions among the hemagglutinin-specific fraction. In each sub-chart, the two bars on the left correspond to samples taken before immunization, and the two bars on the right to samples taken after. Following two-way, repeated measures ANOVA, the differences between frequencies of memory cells before and after immunization were subjected to Sidak's test; and the differences between frequencies of memory cells in hemagglutinin-specific vs. the total B cell population to Dunnett's test (****p < 0.0001). (C) Absolute numbers of naïve and memory cells in the hemagglutinin-specific population. Numbers of cells corresponding to the “memory” phenotype [upper left quadrant in (A)], and “naïve” phenotype [lower right quadrant in (A)] in the hemagglutinin-specific population per 100,000 total B cells are plotted on a log scale. Pre-immunization values are plotted with blue circles, and post-immunization with red squares, and paired samples from each donor are linked by black lines. Following significant two-way ANOVA, the values were compared between the two time points within the two populations by Sidak's test (***p < 0.001). (D) Contour plots of IgD vs. CD71 expression. Plots show either the whole B cell pool (1st and 3rd plots), or the CD69-high, hemagglutinin-capturing cells (2nd and 4th plots), taken from one donor, either before vaccination (blue contour plots on left), or 1 week after (red contour plots on right) vaccination. Cells from nine donors falling in the top left quadrants (IgD-negative, CD71-high) of plots corresponding to the 4th plot here were used as the “Activated B Cells” in (E,F). (E) Heat map showing the characteristics of 9 phenotypic clusters. Flow cytometry results for the 8 markers shown, for cells taken before and after vaccination from 9 donors were subjected to automated clustering using the k-means algorithm in R/Bioconductor. Dendrogram to the left of the plot shows the hierarchical relationships between the clusters, and the dendrogram above the plot the relationships between the markers. Red color encodes the highest level of expression, and yellow-to-white the lowest. (F) Fractions of different cell populations falling in the clusters shown in (E). Gray circles (connected by gray line) show the distribution of all B cells among the clusters. Blue circles show the fractions of hemagglutinin-capturing, CD69 high (HA-specific) B cells from donors before vaccination, and red squares the corresponding population one week after vaccination. Green triangles show the fractions of vaccination-induced “Activated B Cells,” as defined by the IgD-negative, CD71-high quadrant in the 4th plot of (D). Cluster numbers on the vertical axis correspond to cluster numbers shown in (E). Fractions shown on the horizontal axis were calculated by dividing the total number of cells (pooled from all 9 donors) in a given cell population, in a given cluster, by the total number of cells in that population.
Figure 8
Figure 8
Optimized Sorting Using Membrane-Antigen-Capture Enables Near-Complete Purification of Antigen-Specific Cells. (A) A647-labeled alpha-bungarotoxin (BTX) binds to AChR-GFP transfected TE671 proportionally to GFP intensity. TE cells were transiently transfected with the alpha, beta, delta and epsilon subunits of human AChR with a GFP moiety between third and fourth transmembrane helices of the alpha subunit. After 24 h, cells were labeled with A647-alpha-bungarotoxin and analyzed by flow cytometry. (B) AChR-binding IgG from patient serum. Serum from a patient diagnosed with myasthenia gravis was diluted to 1:200 and incubated with TE671 cells transiently transfected with AChR-GFP, then with PE anti-human IgG. (C) Application of antigen-capture sorting to the isolation of AChR-specific B cells from a human donor. Magnetically isolated peripheral blood B cells from a patient diagnosed with myasthenia gravis were cultured for 3 h with TE cells expressing AChR. The AChR alpha subunit has a GFP moiety fused in-frame in the large cytoplasmic loop between the third and fourth transmembrane helices, and the antigen-donor cells are additionally labeled with A647-conjugated bungarotoxin (BTX). After co-culture, B cells were retrieved by washing, labeled with fluorescent antibodies, and CD69-high, IgD-low, GFP- and A647- double positive cells (gating strategy in Supplementary Figure 3) were sorted. (D) Confirmation of AChR-specificity of B cell clone from patient. Single B cells sorted as in C were cultured for 13 days with CD40L-expressing feeder cells and IL-21 as described in Methods. Culture supernatants were then assayed for specific antibodies by incubating with AChR-GFP-transfected (GFP-expressing) or non-transfected (GFP-negative) cells, washing, and detecting with fluorescent secondary antibodies against human IgM, IgA, or IgG. The contour plot on the left shows results from a clone considered negative (similar IgG binding to transfected and untransfected cells), and the plot on the right a positive (higher binding to transfected than untransfected cells) anti-AChR IgG-producing clone.

References

    1. Crotty S, Aubert RD, Glidewell J, Ahmed R. Tracking human antigen-specific memory B cells: a sensitive and generalized ELISPOT system. J Immunol Methods. (2004) 286:111–22. 10.1016/j.jim.2003.12.015 - DOI - PubMed
    1. Scheid JF, Mouquet H, Feldhahn N, Walker BD, Pereyra F, Cutrell E, et al. . A method for identification of HIV gp140 binding memory B cells in human blood. J Immunol Methods. (2009) 343:65–7. 10.1016/j.jim.2008.11.012 - DOI - PMC - PubMed
    1. Taylor JJ, Martinez RJ, Titcombe PJ, Barsness LO, Thomas SR, Zhang N, et al. . Deletion and anergy of polyclonal B cells specific for ubiquitous membrane-bound self-antigen. J Exp Med. (2012) 209:2065–77. 10.1084/jem.20112272 - DOI - PMC - PubMed
    1. Andrews SF, Joyce MG, Chambers MJ, Gillespie RA, Kanekiyo M, Leung K, et al. . Preferential induction of cross-group influenza A hemagglutinin stem-specific memory B cells after H7N9 immunization in humans. Sci Immunol. (2017) 2:13. 10.1126/sciimmunol.aan2676 - DOI - PubMed
    1. Klein F, Gaebler C, Mouquet H, Sather DN, Lehmann C, Scheid JF, et al. . Broad neutralization by a combination of antibodies recognizing the CD4 binding site and a new conformational epitope on the HIV-1 envelope protein. J Exp Med. (2012) 209:1469–79. 10.1084/jem.20120423 - DOI - PMC - PubMed

Publication types

MeSH terms