. 2019 Jun;128(2):97-117.
doi: 10.1007/s00412-019-00703-x. Epub 2019 Apr 30.

Molecular and genetic organization of bands and interbands in the dot chromosome of Drosophila melanogaster

Affiliations

Molecular and genetic organization of bands and interbands in the dot chromosome of Drosophila melanogaster

Darya S Sidorenko et al. Chromosoma. 2019 Jun.

Abstract

The fourth chromosome smallest in the genome of Drosophila melanogaster differs from other chromosomes in many ways. It has high repeat density in conditions of a large number of active genes. Gray bands represent a significant part of this polytene chromosome. Specific proteins including HP1a, POF, and dSETDB1 establish the epigenetic state of this unique chromatin domain. In order to compare maps of localization of genes, bands, and chromatin types of the fourth chromosome, we performed FISH analysis of 38 probes chosen according to the model of four chromatin types. It allowed clarifying the dot chromosome cytological map consisting of 16 loose gray bands, 11 dense black bands, and 26 interbands. We described the relation between chromatin states and bands. Open aquamarine chromatin mostly corresponds to interbands and it contains 5'UTRs of housekeeping genes. Their coding parts are embedded in gray bands substantially composed of lazurite chromatin of intermediate compaction. Polygenic black bands contain most of dense ruby chromatin, and also some malachite and lazurite. Having an accurate map of the fourth chromosome bands and its correspondence to physical map, we found that DNase I hypersensitivity sites, ORC2 protein, and P-elements are mainly located in open aquamarine chromatin, while element 1360, characteristic of the fourth chromosome, occupies band chromatin types. POF and HP1a proteins providing special organization of this chromosome are mostly located in aquamarine and lazurite chromatin. In general, band organization of the fourth chromosome shares the features of the whole Drosophila genome.

Keywords: Bands; Chromatin types; Dot chromosome; Drosophila; Interbands; Polytene chromosomes.


Conflict of interest statement

The authors declare that they have no conflict of interest.

Figures
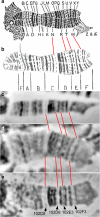
Fig. 1
Fig. 1
Thin gray bands in some regions of the fourth chromosome. a Illustration drawn by C. Bridges (Morgan et al. 1934). The drawing is practically the same as in the work by Bridges (1935b). b Drawing of C. Bridges (1935a). ce Light microscopy of the fourth polytene chromosome. Arrowheads and red lines indicate faint gray bands 102C8, 102D8, 102E3, and 102F3
Fig. 2
Fig. 2
Chromatin and morphological composition of the fourth chromosome. a The percentage of the four chromatin types in the dot chromosome. Here and further, colors on the diagram correspond to chromatin types and white section corresponds to gaps, where the four-chromatin-state model failed to return a specific value. b The percentage of bands and interbands in the dot chromosome. Here and further, colors on the diagram correspond to morphological structures and white section corresponds to gaps, which were not included in bands or interbands. c Chromatin composition of the fourth chromosome interbands. d Chromatin composition of the fourth chromosome gray bands. e Chromatin composition of the fourth chromosome black bands
Fig. 3
Fig. 3
FISH on the polytene fourth chromosome. From left to right: the phase-contrast microphotograph of the fourth chromosome, combined FISH signals, and their superposition. The red signals correspond to probes labeled with TAMRA fluorochrome, the green ones correspond to probes labeled with fluorescein. The arrowheads indicate the following: aZip102B probe in the 102B1-2/B3-4 interband, PIP4K probe in the 102F3 band; bHcf probe in the 102B3-4/B5-6 interband, CG1909 probe in the 102C4-5 band; cNfI probe in the 102B1-2 band, Lin29 (Dati) probe in the 102B5-6 band.
Fig. 4
Fig. 4
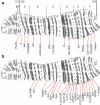
The scheme of probe localization in the polytene fourth chromosome, plotted on the map by C. Bridges (Bridges 1935a). a The probes from the bands predicted by the four-chromatin-state model (Zhimulev et al. 2014). b The probes from the interbands predicted by the four-chromatin-state model (Zhimulev et al. 2014).
Fig. 5
Fig. 5
Molecular, genetic, and cytological organization of the fourth chromosome 102В3-4–102В5-6 site: a the scale (kb); b the genomic coordinates (bp); c the genes (denoted by a curly bracket); d the four-chromatin-state model; the colors correspond to the type names (Zhimulev et al. ; Boldyreva et al. 2017); e the scheme of band and interband localization relative to the genomic coordinates. The band names are denoted. The black ruby-containing bands are shown in black rectangles, the gray bands are shown in dark gray rectangles, and the interbands are shown in light gray rectangles. f FISH probes; g CHRIZ and WDS open chromatin protein localization in different cell types (modENCODE data); h HP1a protein localization in S2 cells (modENCODE data); i POF protein localization in S2 cells (modENCODE data); j ORC2 protein localization in different cell types (Eaton et al. 2011); k DNaseI hypersensitive sites (DHS) localization (Kharchenko et al. 2011)
Fig. 6
Fig. 6
Genetic organization of the fourth chromosome domains and gene expression. a Enrichment of various parts of genes in the structures of the fourth chromosome. The Y-axis indicates the percentage (%) of each category. b The number of larval tissues (on the Y-axis) in which genes of the fourth chromosome are expressed (Chintapalli et al. 2007). c The number of adult fly tissues (on the Y-axis) in which genes of the fourth chromosome are expressed (Chintapalli et al. 2007).
Fig. 7
Fig. 7
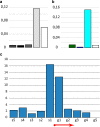
ORC2 protein distribution (modENCODE data): a in the cytological structures of the fourth chromosome, with the first column corresponding to all the bands of the fourth chromosome, and further — as shown in Fig. 2b; b in the four chromatin types of the fourth chromosome. The ordinate shows the density in pcs/kb. с ORC2 protein distribution (modENCODE data) in S2 cells relative to genes beginning in the interbands of the fourth chromosome. The interbands are divided into fragments of 200 bp from the beginning of the gene towards the intergenic spacer (s1–s5) and towards the structural part of the gene (g1–g5); the genes are aligned with respect to the beginning. The graph shows five fragments in each direction. The ordinate shows the total number of sites in these fragments, normalized by the number of the gene transcripts. The red arrow shows the start and direction of the genes.
Fig. 8
Fig. 8
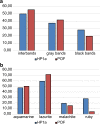
Distribution of HP1a and POF proteins (modENCODE data) in the fourth chromosome in S2 cells. The diagram on the Y-axis shows the proportions (%) of the total length of morphological structures (a) and chromatin domains (b) occupied by HP1a and POF.
Fig. 9
Fig. 9
Distribution of POF protein in the fourth chromosome in the salivary gland cells of Drosophila larvae (Lundberg et al. ; Johansson and Larsson 2014) a relative to the bands and interbands and b relative to the chromatin domains of four types (Zhimulev et al. ; Materials and methods). The value of the median of the ChIP profile peaks for each type of domains is shown on the Y-axis.
Fig. 10
Fig. 10
POF and CHRIZ localization on the polytene fourth chromosome of D. melanogaster. a Phase contrast image of the fourth chromosome. b CHRIZ staining. Antibodies are the same as in Gortchakov et al. (2005). c Merged phase contrast and CHRIZ staining. d POF staining. Antibodies are the same as in Larsson et al. (2001). e Merged phase contrast and POF staining. f Merged CHRIZ and POF staining. g Merged phase contrast, CHRIZ, and POF staining. The arrow indicates the 102B5-6/B7 interband where no POF and CHRIZ binding was observed.
Fig. 11
Fig. 11
The distribution of H3K27me3 in the Drosophila larvae salivary gland cells (Sher et al. 2012). a in the four chromatin types of the fourth chromosome, and b in the bands and interbands of the fourth chromosome. The median value of the distribution profile peaks is shown on the Y-axis
Fig. 12
Fig. 12
SUUR localization in polytene chromosomes. The picture is kindly provided by T. D. Kolesnikova. a Phase contrast of the 2R chromosome. b SUUR localization in 2R chromosome. c Merged image of phase contrast and SUUR localization in the 2R chromosome as control of proper SUUR localization in the dot chromosome. d Phase contrast of the fourth chromosome. e SUUR localization in the fourth chromosome f merged image of phase contrast and SUUR localization in the fourth chromosome
Fig. 13
Fig. 13
Mobile element distribution in the fourth chromosome. Р–element distribution: a in the cytological structures of the fourth chromosome, with the first column corresponding to all the bands of the fourth chromosome, and further—as shown in Fig. 2b; b in the four chromatin types of the fourth chromosome. The ordinate shows the density in pcs/kb. сР-element distribution relative to genes beginning in the interbands of the fourth chromosome. The interbands are divided into fragments of 200 bp from the beginning of the gene towards the intergenic spacer (s1–s5) and towards the structural part of the gene (g1–g5); the genes are aligned with respect to the beginning. The graph shows five fragments in each direction. The ordinate shows the total number of sites in these fragments, normalized by the number of the gene transcripts. The red arrow shows the start and direction of the genes. The distribution of the 1360 element: d in the bands and interbands; e in the four chromatin types of the fourth chromosome.
Fig. 14
Fig. 14
Distribution of the DNaseI hypersensitivity sites (DHS): a in the cytological structures of the fourth chromosome, with the first column corresponding to all the bands of the fourth chromosome, and further—as shown in Fig. 2b; b in the four chromatin types of the fourth chromosome. The ordinate shows the density in pcs/kb. с DHS distribution (modENCODE data) in S2 cells relative to genes beginning in the interbands of the fourth chromosome. The interbands are divided into fragments of 200 bp from the beginning of the gene towards the intergenic spacer (s1–s5) and towards the structural part of the gene (g1–g5); the genes are aligned with respect to the beginning. The graph shows five fragments in each direction. The ordinate shows the total number of sites in these fragments, normalized by the number of the gene transcripts. The red arrow shows the start and direction of the genes.

Similar articles

Cited by

References

    1. Andreyeva EN, Kolesnikova TD, Belyaeva ES, Glaser RL, Zhimulev IF. Local DNA underreplication correlates with accumulation of phosphorylated H2Av in the Drosophila melanogaster polytene chromosomes. Chromosom Res. 2008;16:851–862. doi: 10.1007/s10577-008-1244-4. - DOI - PubMed
    1. Andreyeva EN, Kolesnikova TD, Demakova OV, Mendez-Lago M, Pokholkova GV, Belyaeva ES, Rossi F, Dimitri P, Villasante A, Zhimulev IF. High-resolution analysis of Drosophila heterochromatin organization using SuUR Su(var)3-9 double mutants. Proc Natl Acad Sci U S A. 2007;104:12819–12824. doi: 10.1073/pnas.0704690104. - DOI - PMC - PubMed
    1. Ashburner M, Golic KG, Hawley RS. Drosophila: a laboratory handbook. 2. Cold Spring Harbor: Cold Spring Harbor Laboratory Press; 2005.
    1. Boldyreva LV, Goncharov FP, Demakova OV, Zykova TY, Levitsky VG, Kolesnikov NN, Pindyurin AV, Semeshin VF, Zhimulev IF. Protein and genetic composition of four chromatin types in Drosophila melanogaster cell lines. Curr Genomics. 2017;18:214–226. doi: 10.2174/1389202917666160512164913. - DOI - PMC - PubMed
    1. Bridges CB. Salivary chromosome maps with a key to the banding of the chromosomes of Drosophila melanogaster. J Hered. 1935;26:60–64. doi: 10.1093/oxfordjournals.jhered.a104022. - DOI

Publication types

Substances

LinkOut - more resources