. 2019 May 1;129(5):2071-2087.
doi: 10.1172/JCI125364. Epub 2019 Apr 15.

Heterologous prime-boost vaccination protects against EBV antigen-expressing lymphomas

Affiliations

Heterologous prime-boost vaccination protects against EBV antigen-expressing lymphomas

Julia Rühl et al. J Clin Invest. .

Abstract

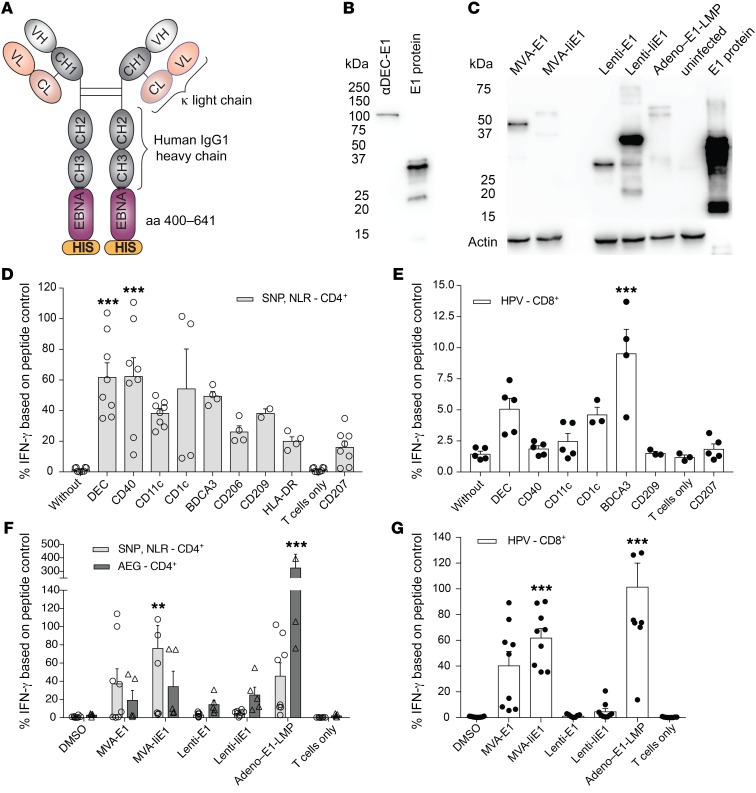
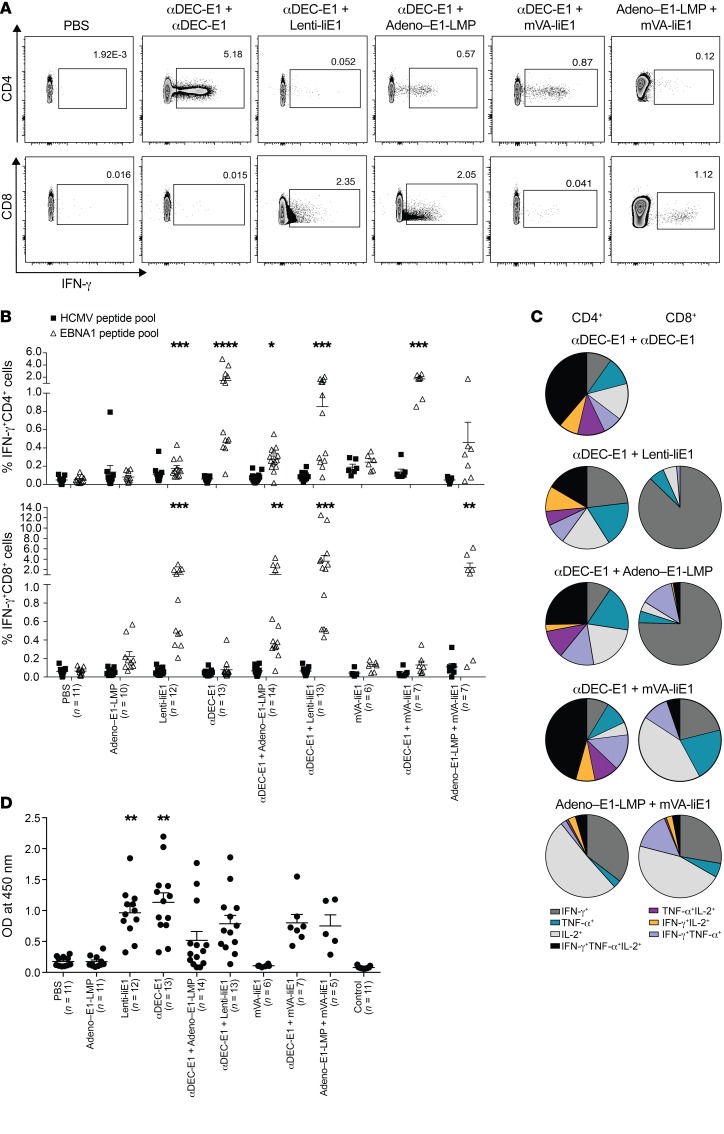
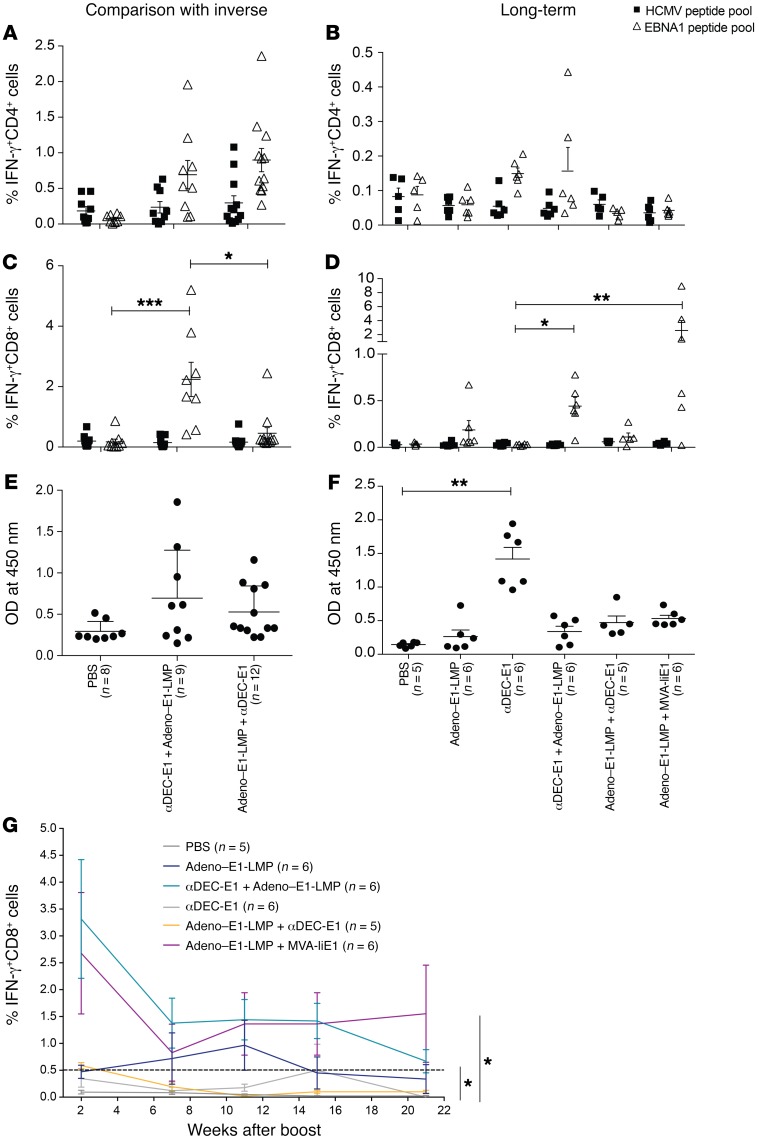
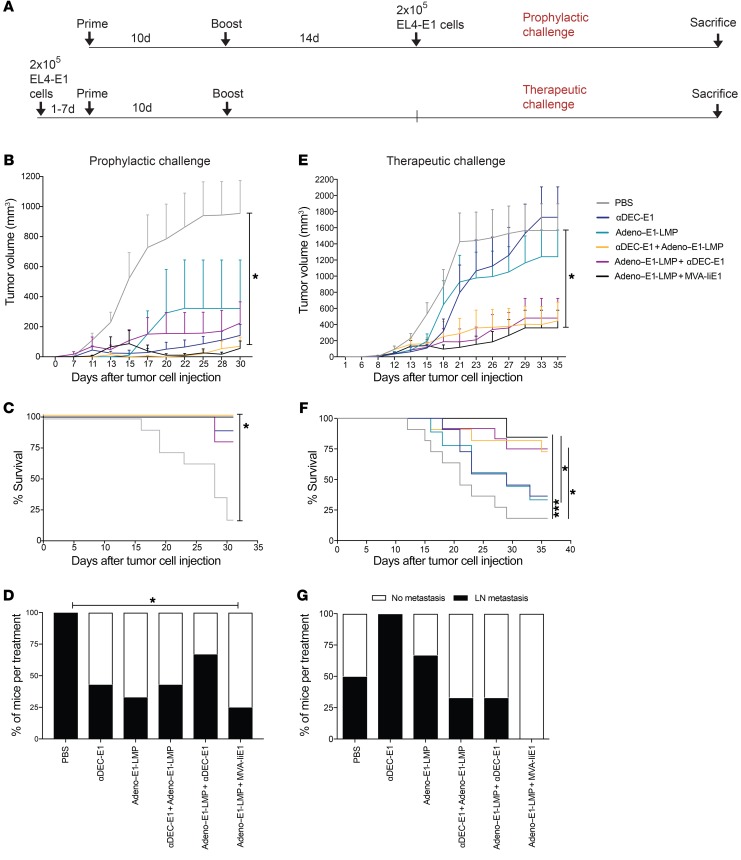
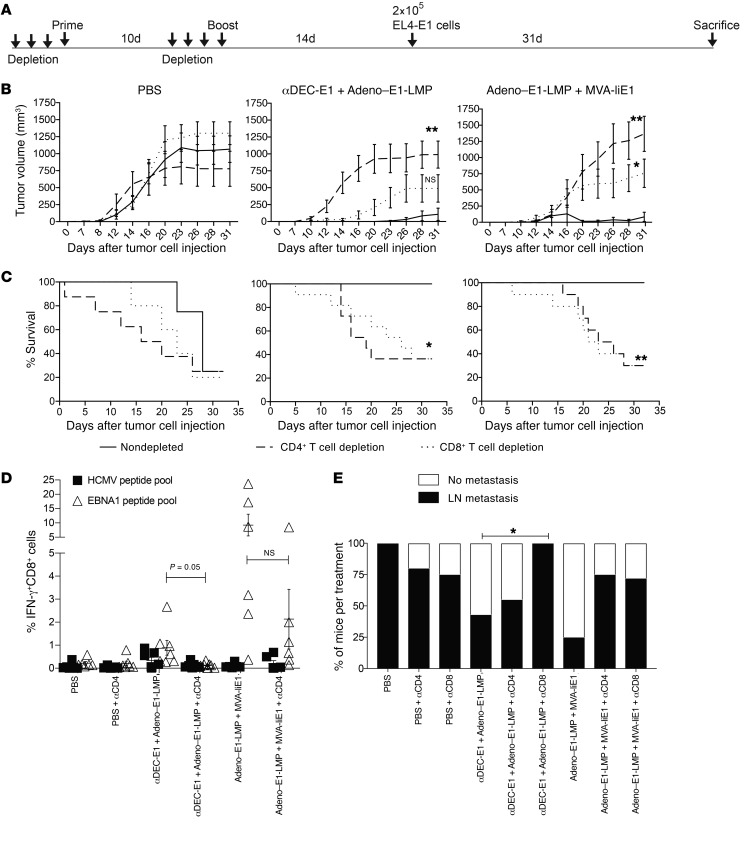
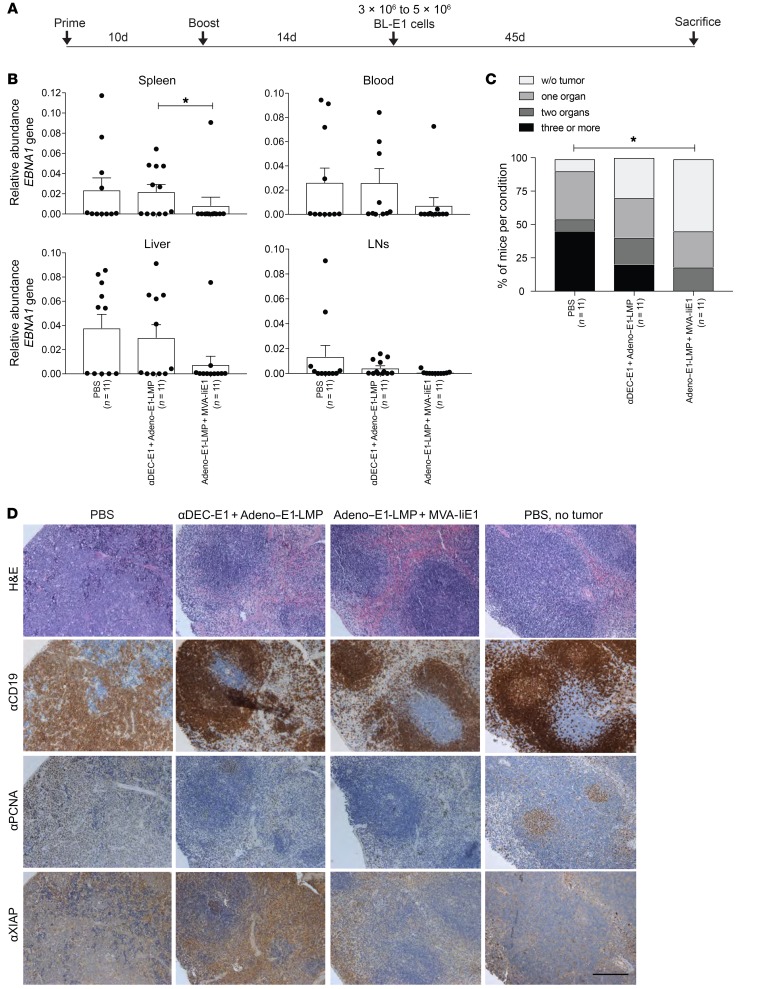
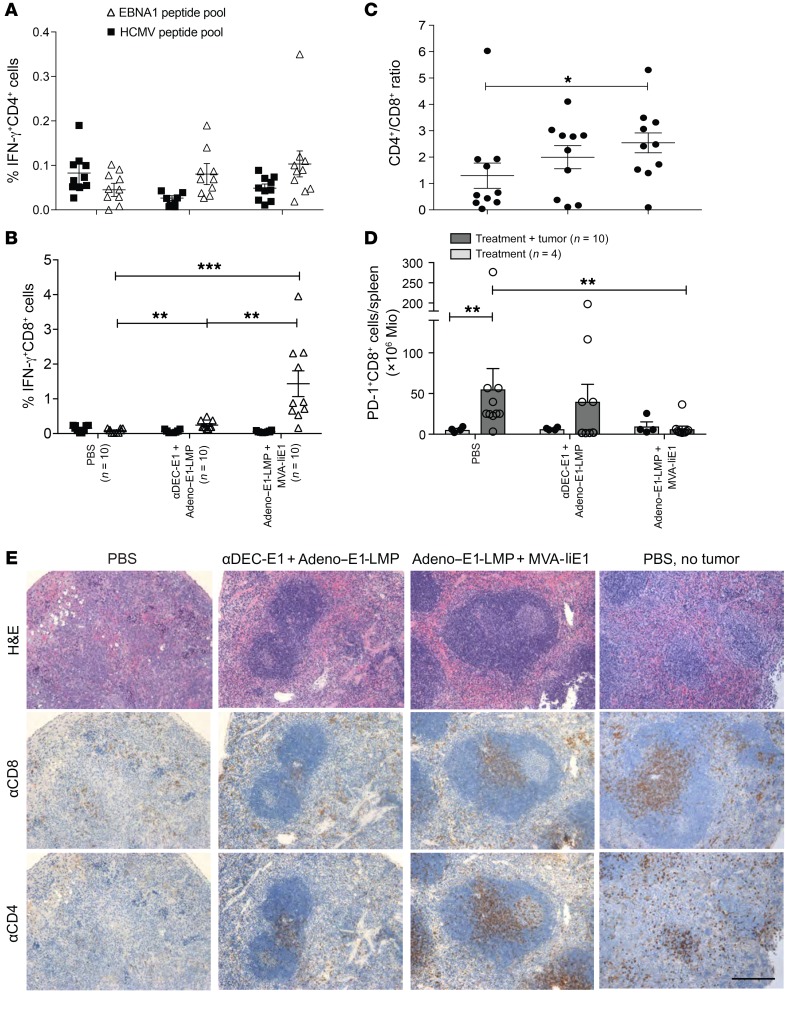
The Epstein-Barr virus (EBV) is one of the predominant tumor viruses in humans, but so far no therapeutic or prophylactic vaccination against this transforming pathogen is available. We demonstrated that heterologous prime-boost vaccination with the nuclear antigen 1 of EBV (EBNA1), either targeted to the DEC205 receptor on DCs or expressed from a recombinant modified vaccinia virus Ankara (MVA) vector, improved priming of antigen-specific CD4+ T cell help. This help supported the expansion and maintenance of EBNA1-specific CD8+ T cells that are most efficiently primed by recombinant adenoviruses that encode EBNA1. These combined CD4+ and CD8+ T cell responses protected against EBNA1-expressing T and B cell lymphomas, including lymphoproliferations that emerged spontaneously after EBNA1 expression. In particular, the heterologous EBNA1-expressing adenovirus, boosted by EBNA1-encoding MVA vaccination, demonstrated protection as a prophylactic and therapeutic treatment for the respective lymphoma challenges. Our study shows that such heterologous prime-boost vaccinations against EBV-associated malignancies as well as symptomatic primary EBV infection should be further explored for clinical development.

Keywords: Immunology; Lymphomas.


Conflict of interest statement

Conflict of interest: AD is an employee of Miltenyi Biotec GmbH. RK is a consultant and member of the scientific advisory board of Atara Biotherapeutics and has received a license fee payment and research funding from Atara Biotherapeutics.

Figures

Figure 1
Figure 1. Human CD4+ and CD8+ T cell recognition of EBNA1 carrying or encoding vaccine formulations.
(A) Structure of humanized EBNA1-Ab fusion proteins. (B) Western blot analysis of human αDEC205-EBNA1 Ab under reducing conditions using rat αEBNA1 Ab (clone 1H4). Lane 1 represents heavy-chain EBNA1 (100 kDa) and lane 2 recombinant truncated EBNA1. (C) Western blot analysis of viral vectors encoding truncated EBNA1, using rat αEBNA1 Ab (clone 1H4) 48 hours after infection of HEK293T cells. MVA-E1 carries EBNA1 without the Gly/Ala repeat and runs at approximately 45 kDa (25); MVA-IiE1 has the additional invariant chain domain. Lenti-E1 carries only EBNA1 from aa 400–641 with an approximate size of 30 kDa. Infection with Adeno–E1-LMP also leads to expression of the Gly/Ala repeat–deleted EBNA1 protein, however with additional LMP polyepitopes (26), and migrates at approximately 60 kDa. Lane 6 represents uninfected HEK293T cells and lane 7 recombinant truncated EBNA1. (D and E) Autologous PBMCs were incubated with medium for 4 hours with 1 μg/ml EBNA1 fused to an Ab against the indicated receptors, or for 1 hour with the cognate peptides for the respective T cell clones. Coculture with (D) EBNA1-specific CD4+ T cell clones, with cognate epitope NLR and SNP shown in the gray bars, and (E) EBNA1-specific CD8+ T cell clones, with cognate epitope HPV shown in the white bars. T cell activity was measured by IFN-γ release into the supernatant. IFN-γ signal is shown as a percentage of the peptide control. Data are shown as the mean ± SD of at least 2 independent experiments. ***P < 0.005 versus unspecific CD207-targeting; 1-way ANOVA with Bonferroni’s pre-test . (F and G) Autologous PBMCs were infected with DMSO control, MVA-EBNA1, MVA-liEBNA1, or Adeno–EBNA1-LMP at a MOI of 10 for 48 hours and with Lenti-EBNA1 or Lenti-IiEBNA1 for 96 hours. Coculture with (F) EBNA1-specific CD4+ T cell clones, with cognate epitope NLR and SNP shown in the light gray bars and cognate epitope AEG shown in the dark gray bars, and (G) EBNA1-specific CD8+ T cell clones, with cognate epitope HPV shown in the white bars. T cell activity was determined as in D and E. Data are shown as the mean ± SD of 2 independent experiments. **P < 0.01 and ***P < 0.005; 1-way ANOVA plus Bonferroni’s pre-test.
Figure 2
Figure 2. Comprehensive priming of mouse CD4+ and CD8+ T cell responses against EBNA1 by heterologous vaccination in huDEC205-Tg mice.
huDEC205-Tg mice were immunized with different combinations of vaccines for the prime and the boost, which were scheduled 4 weeks apart. Mice were sacrificed 2 weeks after the boost. Bulk splenocytes were harvested and stimulated either with 1 μg/ml EBNA1 or control HCMV pp65 peptide pools. (A) Representative dot plots of ICS of restimulated splenocytes, gated for CD4 or CD8 expression and IFN-γ. One dot plot is shown for the PBS-treated and vaccination groups αDEC-E1 plus αDEC-E1, αDEC-E1 plus Lenti-IiE1, αDEC-E1 plus Adeno–E1-LMP, αDEC-E1 plus MVA-IiE1, and Adeno–E1-LMP plus MVA-IiE1 as representative examples for the data summarized in B. (B) Frequency of IFN-γ+CD4+ and IFN-γ+CD8+ cells from total splenocytes. Data are shown as the mean ± SEM from 4 independent experiments with at least 3 mice per group. *P < 0.05, **P < 0.01, ***P < 0.001, and ****P < 0.0001 versus PBS-treated mice; Kruskal-Wallis test with Dunn’s multiple comparison post test. (C) Cytokine profile of total splenic CD4+ or CD8+ T cells in mice vaccinated with αDEC-E1 plus αDEC-E1, αDEC-E1 plus Lenti-IiE1, αDEC-E1 plus Adeno–E1-LMP, αDEC-E1 plus MVA-IiE1, or Adeno–E1-LMP plus MVA-IiE1. Pie charts show the mean of percentage of each cytokine-secreting subset. (D) Serum obtained from mice from prime-boost experiments was analyzed for α–EBNA1 IgG by ELISA. Each data point represents 1 individually analyzed mouse. A negative control that contained no serum was included. **P < 0.01, versus PBS-treated mice; Kruskal-Wallis test with Dunn’s multiple comparisons post test. Error bars indicate the SEM.
Figure 3
Figure 3. Persistent and potent EBNA1-specific CD8+ T cell responses upon comprehensive CD4+ and CD8+ T cell priming by heterologous vaccination.
HuDEC205-Tg mice were immunized with different combinations of vaccines for the prime and the boost, which were scheduled 4 weeks apart. Mice were sacrificed 2 weeks (AC) or 21 weeks (EG) after the boost. Bulk splenocytes were harvested and stimulated either with 1 μg/ml EBNA1 or control HCMV pp65 peptide pools. IFN-γ production by CD4+ (A and E) or CD8+ (B and F) T cells was monitored by ICS. α–EBNA1 IgG titers were determined by ELISA (C and G). Each data point represents 1 individual mouse. Data are shown as the mean ± SEM from 3 independent experiments (inverse regimen) or 1 long-term experiment. *P < 0.05, **P < 0.01, and ***P < 0.001; Kruskal-Wallis with Dunn’s multiple comparisons post test. (D) Mice from 1 long-term experiment were observed up to week 21 after the boost. Blood was withdrawn at weeks 7, 11, 15, and 21 after the boost. PBMCs were restimulated with 1 μg/ml EBNA1 peptide pool after vaccination. IFN-γ production was monitored by ICS in CD8+ cells. Data are shown as the mean ± SEM. *P < 0.05 versus PBS-treated mice; 2-way ANOVA with Tukey’s multiple comparisons test.
Figure 4
Figure 4. Protection from EBNA1-expressing EL4 lymphoma challenge by heterologous prime-boost vaccination in huDEC205-Tg mice.
(A) hHuDEC205-Tg mice were immunized with different combinations of vaccines for the prime and the boost, which were scheduled 10 days apart. Mice were s.c. challenged with 2 × 10⁵ EBNA1-expressing EL4 cells (EL4-E1) either 14 days after the boost in a prophylactic setting (B, C, and D) or 1 to 7 days before the prime vaccination in a therapeutic setting (E, F, and G). Mice were monitored every second day, weight was measured, and tumor size was analyzed by caliper. Mice were sacrificed when the tumor reached 15 mm or more in diameter. (B and E) The tumor volume was calculated using the formula A2 × B × 0.52, where A is the shortest diameter perpendicular to the longest diameter, and B is the longest diameter. The mean tumor volume plus the SD of 3 independent experiments with at least 3 mice per group is shown. *P < 0.05 versus PBS-treated mice; 2-way ANOVA with Tukey’s multiple comparisons test. (C and F) The percentage survival from 3 independent experiments with at least 3 mice per group is shown. *P < 0.05 and ***P < 0.001; Mantel-Cox test. (D and G) At sacrifice, bulk single-cell suspensions of LN cells were harvested and analyzed by EBNA1 qPCR from representative prophylactic (D) and therapeutic (G) EL4-E1 tumor challenges. Abundance of the EBNA1 gene was normalized to the UBC gene as the tumor load. A tumor-load cutoff of 0.005 or greater was set. The percentage of mice per condition with and without tumor burden in the LNs is depicted. Statistical analysis was done by 2-way ANOVA with Tukey’s multiple comparisons test using the quantitation cycle (cq) value of the qPCR.
Figure 5
Figure 5. Dependence on CD4+ and CD8+ T cell populations for protection from EL4-E1 challenge after heterologous vaccination.
(A) huDEC205-Tg mice were immunized with different combinations of vaccines for the prime and boost scheduled 10 days apart. Before the prime and before the boost, mice were depleted with injections of αCD4 or αCD8 Ab on 3 consecutive days. Mice were challenged with 2 × 10⁵ EL4-E1 cells s.c. 14 days after the boost. Mice were monitored every second day, weight was measured, and tumor size was analyzed by caliper. (B) Tumor growth was determined every second to third day. Tumor volume was calculated by the formula: A2 × B × 0.52. The mean tumor volume plus the SD of the experiment with 6 mice per group is shown. *P < 0.05 and **P < 0.01; 2-way ANOVA and Tukey’s multiple comparisons test. (C) Mice were sacrificed when the tumor reached 15 mm or more in diameter. The percentage survival from 1 experiment with 6 mice per group is shown. *P < 0.05 and **P < 0.005; Mantel-Cox test. (D) At the point of sacrifice, bulk splenocytes were harvested and stimulated either with 1 μg/ml EBNA1 or control HCMV pp65 peptide pool. IFN-y production was monitored by ICS in CD8+ gated cells. The mean ± SEM from 1 experiment with 6 mice per group is shown. P = 0.05; Kruskal-Wallis with Dunn’s multiple comparisons post test. (E) At sacrifice, bulk single-cell suspensions of cells from LNs were harvested and analyzed by EBNA1 qPCR. Abundance of EBNA1 gene was normalized to the UBC gene. Data are shown as the mean ± SD from experiments with 6 mice per group. *P < 0.05; statistical analysis was done by 2-way ANOVA and Tukey’s multiple comparisons test using the cq value of the qPCR.
Figure 6
Figure 6. Protection from EBNA1-induced B cell lymphoma challenge by heterologous vaccination.
(A) huDEC205-Tg mice were immunized with different combinations of vaccines for the prime and the boost, scheduled 10 days apart. Mice were challenged with 3 × 10⁶ to 5 × 10⁶ EBNA1+ B cell tumor cells (BL-E1) i.v. 14 days after the boost in a preventive setting. Mice were monitored every second day, including measurement of weight, observation of general behavior, and assessment using the mouse grimace scale. (B) At sacrifice, bulk single-cell suspensions of cells from LNs, spleen, liver, and blood were harvested and analyzed by EBNA1 qPCR. Abundance of the EBNA1 gene was normalized to the UBC gene as the tumor load. Data are shown as the mean ± SD from 2 independent experiments with at least 5 mice per group. (C) A tumor load cutoff of 0.005 or higher was set, and results of all analyzed organs from each mouse were pooled. The percentage of mice per condition without tumor burden and with tumor burden in 1 to 4 organs is depicted. *P < 0.05; Mantel-Cox test. (D) At sacrifice, splenic tissue from treated mice with EBNA1-induced B cell lymphoma were fixed in PFA and embedded in paraffin. Splenic tissues from PBS-treated mice without tumor treatment were used. Splenic tissue samples were stained with H&E, αCD19, αPCNA, and αXIAP Abs. One representative staining for each group is shown. Scale bar: 20 μm.
Figure 7
Figure 7. Characteristics of T cell responses toward EBNA1-induced B cell lymphomas with and without protective vaccination.
huDEC205-Tg mice were immunized with different combinations of vaccines for the prime and the boost, scheduled 10 days apart. Mice in the preventive group were challenged i.v. with 3 × 10⁶ to 5 × 10⁶ BL-E1 tumor cells 14 days after the boost. (A) At sacrifice, bulk splenocytes were harvested and stimulated with 1 μg/ml EBNA1 or control HCMV pp65 peptide pools. IFN-γ production was monitored by ICS in CD4+ gated cells. Data are shown as the mean ± SEM from 2 independent experiments with at least 5 mice per group. Statistical analyses was done using a 2-tailed Mann-Whitney U test. (B) After splenocyte stimulation, IFN-γ production was monitored by ICS in CD8+ gated cells. Data are shown as the mean ± SEM from 2 independent experiments with at least 5 mice per group. **P < 0.01 and ***P < 0.001; Kruskal-Wallis with Dunn’s multiple comparisons test (C) The CD4+/CD8+ T cell ratio was calculated using the percentages of each subset in the spleen. *P < 0.05; 1-way ANOVA with Tukey’s multiple comparisons test. (D) At sacrifice, bulk splenocytes were harvested and stained for PD-1 on CD8+ gated cells. Total PD-1+CD8+ cell amounts per spleen were calculated using the total splenocytes count. Data are shown as the mean ± SEM from 2 independent experiments with at least 5 mice per group. Mice with PBS treatment or vaccination and tumor injection were compared with mice that were only treated with PBS or vaccinated. **P < 0.01; Kruskal-Wallis with Dunn’s multiple comparisons test. (E) Splenic tissue was fixed in PFA and embedded in paraffin and then stained with H&E, αCD8, and αCD4. One representative image from each group is shown, along with an image of splenic cells from a PBS-treated mouse without tumor challenge. Scale bar: 20 μm.

Comment in

References

    1. Young LS, Yap LF, Murray PG. Epstein-Barr virus: more than 50 years old and still providing surprises. Nat Rev Cancer. 2016;16(12):789–802. doi: 10.1038/nrc.2016.92. - DOI - PubMed
    1. Cesarman E. Gammaherpesviruses and lymphoproliferative disorders. Annu Rev Pathol. 2014;9:349–372. doi: 10.1146/annurev-pathol-012513-104656. - DOI - PubMed
    1. Cohen JI, Fauci AS, Varmus H, Nabel GJ. Epstein-Barr virus: an important vaccine target for cancer prevention. Sci Transl Med. 2011;3(107):107fs7. - PMC - PubMed
    1. Babcock GJ, Hochberg D, Thorley-Lawson AD. The expression pattern of Epstein-Barr virus latent genes in vivo is dependent upon the differentiation stage of the infected B cell. Immunity. 2000;13(4):497–506. doi: 10.1016/S1074-7613(00)00049-2. - DOI - PubMed
    1. Babcock GJ, Decker LL, Volk M, Thorley-Lawson DA. EBV persistence in memory B cells in vivo. Immunity. 1998;9(3):395–404. doi: 10.1016/S1074-7613(00)80622-6. - DOI - PubMed

Publication types

MeSH terms