. 2019 Apr 30;27(5):1409-1421.e6.
doi: 10.1016/j.celrep.2019.04.003.

Loss of Nuclear TDP-43 Is Associated with Decondensation of LINE Retrotransposons

Affiliations

Loss of Nuclear TDP-43 Is Associated with Decondensation of LINE Retrotransposons

Elaine Y Liu et al. Cell Rep. .

Abstract

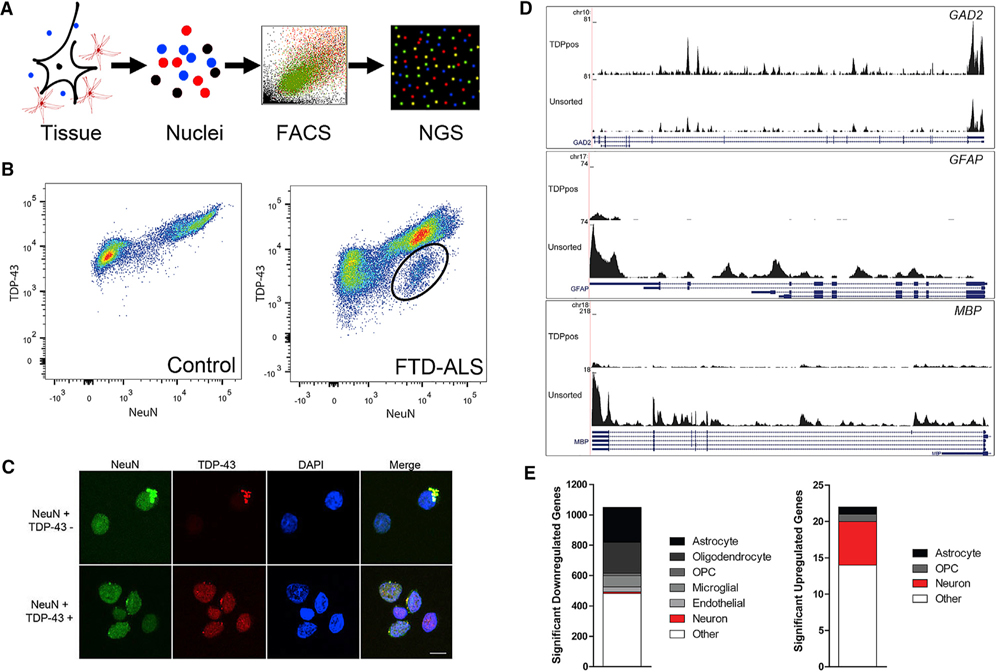
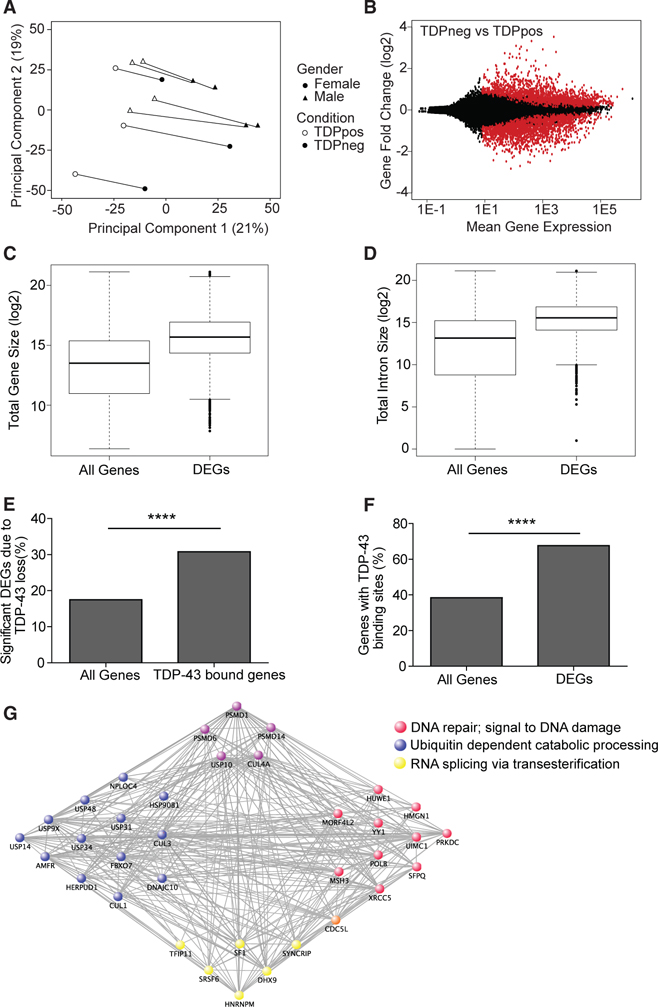
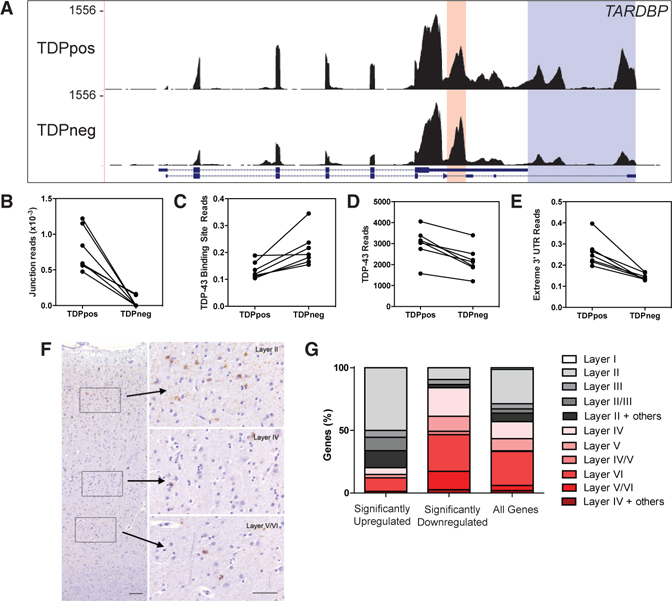
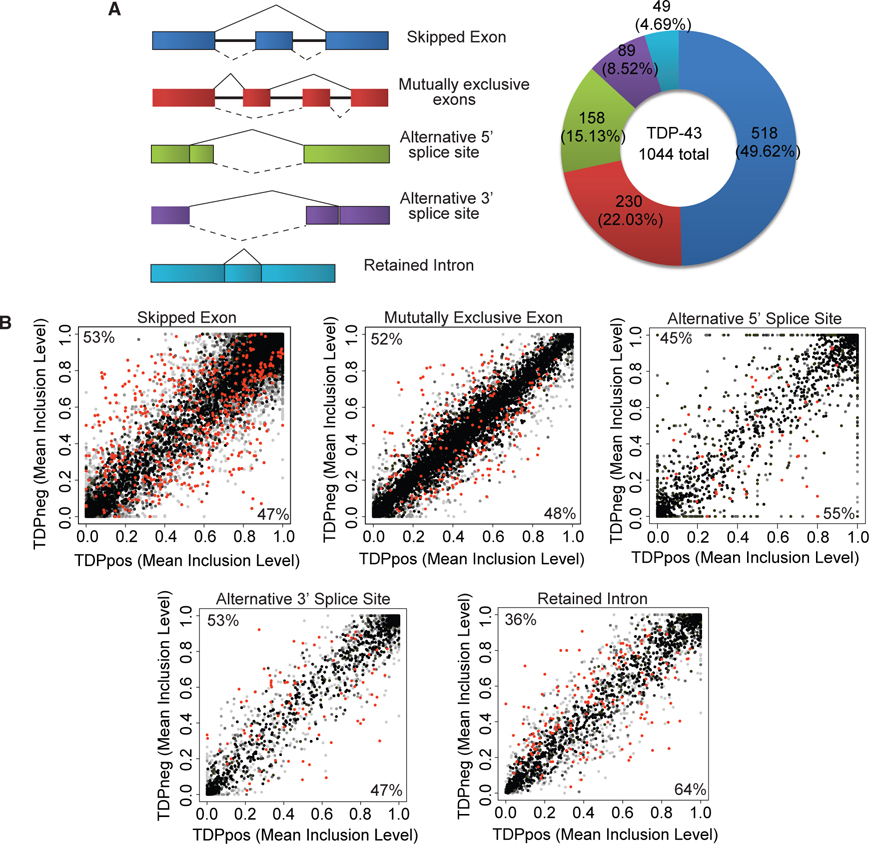
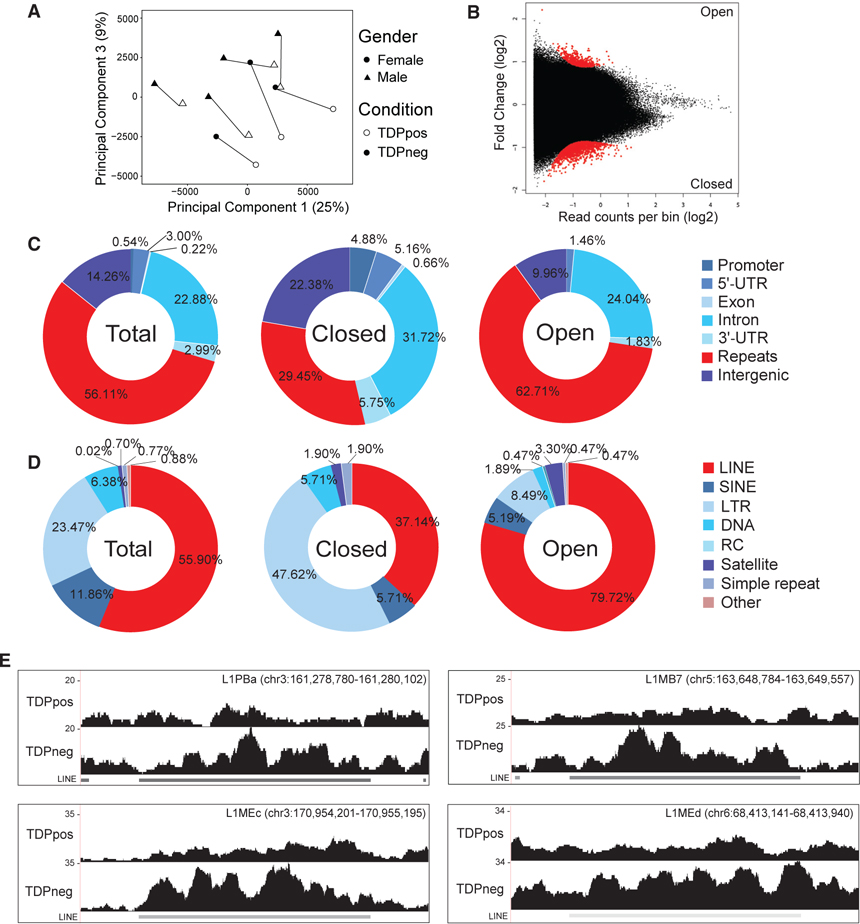
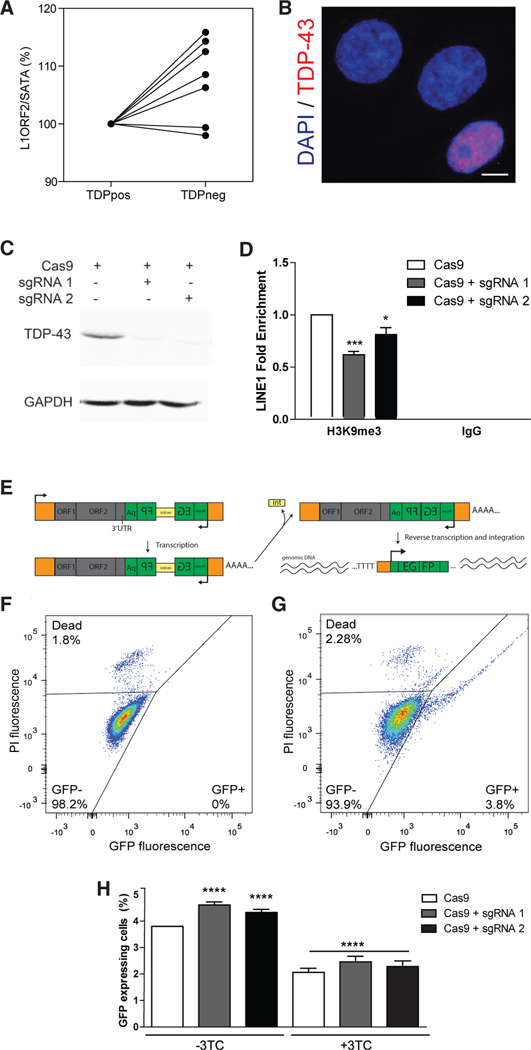
Loss of the nuclear RNA binding protein TAR DNA binding protein-43 (TDP-43) into cytoplasmic aggregates is the strongest correlate to neurodegeneration in amyotrophic lateral sclerosis and frontotemporal degeneration. The molecular changes associated with the loss of nuclear TDP-43 in human tissues are not entirely known. Using subcellular fractionation and fluorescent-activated cell sorting to enrich for diseased neuronal nuclei without TDP-43 from post-mortem frontotemporal degeneration-amyotrophic lateral sclerosis (FTD-ALS) human brain, we characterized the effects of TDP-43 loss on the transcriptome and chromatin accessibility. Nuclear TDP-43 loss is associated with gene expression changes that affect RNA processing, nucleocytoplasmic transport, histone processing, and DNA damage. Loss of nuclear TDP-43 is also associated with chromatin decondensation around long interspersed nuclear elements (LINEs) and increased LINE1 DNA content. Moreover, loss of TDP-43 leads to increased retrotransposition that can be inhibited with antiretroviral drugs, suggesting that TDP-43 neuropathology is associated with altered chromatin structure including decondensation of LINEs.

Keywords: ATAC-seq; RNA; amyotrophic lateral sclerosis; autoregulation; chromatin; frontotemporal dementia; histone; motor neuron disease; reverse transcriptase; splicing.


Conflict of interest statement

DECLARATION OF INTERESTS

E.Y.L. is currently affiliated with ETHOS Health Communications, Yardley, PA, USA. J.R. is currently affiliated with DZNE e.V., Bonn, Germany.

Figures

Figure 1.
Figure 1.. Flow-Seq of Post-mortem Human Brain Is Able to Enrich for Neuronal Populations of Interest
(A) Schematic of Flow-Seq to isolate neuronal nuclei from post-mortem brain. NGS, next-generation sequencing. (B) Flow cytometry plots assessing TDP-43 fluorescence as a function of NeuN fluorescence of non-diseased post-mortem brain (left) versus an FTD-ALS brain (right). The non-diseased brain shows a non-neuronal population (NeuN-negative, TDP-43 positive) and neuronal TDP-43-positive (NeuN-positive, TDP-43 positive) population. The FTD-ALS brain has an extra population (circled) of a neuronal population without TDP-43 (NeuN-positive, TDP-43 negative). (C) Confocal microscopy of sorted populations with and without TDP-43 assessing NeuN (green), TDP-43 (red), and DAPI (blue) fluorescence. Scale bar, 10 mm. (D) Coverage plots of non-neuronal (GFAP, MBP) and neuronal (GAD2) genes in unsorted nuclei and neuronal nuclei with TDP-43. (E) Fisher’s exact test demonstrated that there was an enrichment of non-neuronal genes (gray and black) in significantly downregulated genes (557 out of 1,049; odds ratio = 8.57; p < 2.2E − 16), depletion of neuronal genes (red) in significantly downregulated genes (10 out of 1,049; odds ratio 0.31; p = 1.8E − 4), and enrichment of neuronal genes (red) within significantly upregulated genes (6 out of 22; odds ratio = 12.19; p = 3.5E − 5) between sorted neuronal nuclei and unsorted nuclei.
Figure 2.
Figure 2.. Loss of TDP-43 Is Associated with Abundant Gene Expression Changes Linked to Genes Involved in DNA Damage and Repair, Proteostasis, and RNA Processing
(A) Principal component analysis of gene expression data with shape denoting gender and color denoting presence or absence of TDP-43. Lines are drawn to connect nuclei with and without TDP-43 from the same individual. (B) MA plot of DEGs due to presence (TDPpos) or absence of TDP-43 (TDPneg), with red dots being significant DEGs (FDR < 0.05) and black dots being expressed genes. (C) Boxplot of gene size (bp) in all expressed genes and significant DEGs (t test, p < 2.2E − 16) showing significant DEGs due to TDP-43 loss are longer. (D) Boxplot of intron size (bp) in all expressed genes and significant DEGs (t test, p < 2.2E − 16) showing significant DEGs due to TDP-43 loss have longer introns. (E) Chi-square (χ2) analysis reveals significant enrichment of DEGs in the subset of genes with TDP-43 binding sites compared with all genes (30.80% versus 17.48%; χ2 = 945.7; p < 0.0001). (F) χ2 analysis reveals significant enrichment of genes with TDP-43 binding sites in DEGs compared with all genes (67.54% versus 38.34%; χ2 = 1652; p < 0.0001). (G) Network analysis of a weighted gene co-expression network analysis (WGCNA) module derived from significantly DEGs linked to TDP-43 loss. Genes are categorized by gene ontology term based on color. Purple genes are enriched in both red and blue pathways. Orange genes are enriched in both yellow and red pathways.
Figure 3.
Figure 3.. Transcriptome Linked to Loss of TDP-43 Highlights TARDBP Autoregulation and Selective Vulnerability in Human Post-mortem Brain
(A) Coverage plot of TARDBP of TDPpos versus TDPneg nuclei showing reads mapped to the TDP-43 binding site (shaded red) and the longer extreme 3 UTR (shaded blue). o(B) Junction reads across the TDP-43 binding site were normalized to total TARDBP reads, showing fewer junction reads in TDPneg versus TDPpos nuclei (n = 7 pairs; t test, p = 0.0014). (C) Reads mapping to the TDP-43 binding site were normalized to total TARDBP reads, showing more binding site reads in TDPneg versus TDPpos nuclei (n = 7 pairs; t test, p = 0.010). (D) Reads mapping to TARDBP were quantified normalized to total reads, showing fewer reads in TDPneg versus TDPpos nuclei (n = 7 pairs; t test, p = 0.0015). (E) Reads within the extreme 3 UTR of the TARDBP gene were normalized to the reads across TARDBP, showing fewer extreme 3 UTR reads in TDPneg versus TDPpos nuclei (n = 7 pairs; t test, p = 0.0018). (F) Representative immunohistochemistry of TDP-43 aggregates from one of the sequenced cases showing preferential TDP-43 pathology in superficial layers (layer II) and little TDP-43 pathology in deeper cortical layers (layer V/VI). Scale bars, 100 mm; 50 mm (inset). (G) Significantly upregulated and downregulated genes were annotated according to cortical layers where red colors correspond to layers IV–VI and black/gray colors correspond to layers I–III genes. Enrichment of upper cortical neurons within significantly upregulated genes in TDPneg nuclei (χ2 = 26.36, p < 0.0001) and enrichment of lower cortical neurons within significantly downregulated genes (χ2= 25.69, p < 0.0001) in TDPneg nuclei were observed.
Figure 4.
Figure 4.. Alternative Splicing Associated with Loss of TDP-43
(A) Representative examples of alternative splicing changes with color of each event denoted in the pie chart. Solid lines correspond to canonical splicing event, and dotted lines correspond to alternative splicing event. Alternatively spliced events upon TDP-43 loss are quantified in the pie chart on the right. (B) Mean inclusion levels of TDPneg nuclei were plotted against mean inclusion levels of TDPpos nuclei for each queried alterative splicing event with significant alternative splicing events in red (FDR < 0.05). The darker a dot is, the more junction read counts there were for a particular splicing event. Numbers indicate the percentage of inclusion events.
Figure 5.
Figure 5.. Decondensation of LINEs in Post-mortem Human Neuronal Nuclei without TDP-43
(A) Principal component analysis of ATAC-seq bin accessibility with shape denoting gender and color denoting condition with a line drawn for each individual. (B) MA plot of bin accessibility changes linked to TDP-43 loss with red dots being significantly differentially open bins (FDR < 0.05) and black being non-significant bins. (C) Percentage of bins mapped to genic elements (promoter, 5 UTR, exon, intron, 3 UTR), intergenic repeat regions, or intergenic regions in all autosomal bins (left), significantly closed genomic bins in TDPneg nuclei (center), or significantly open genomic bins in TDPneg nuclei (right). χ2 test was performed to determine enrichment of repeats in open regions versus closed regions (62.71% versus 29.45%;χ2= 368, p < 0.0001), or enrichment of repeats in open regions versus all autosomal bins (62.71% versus 56.11%;χ2= 19.06, p < 0.0001). (D) Percentage of bins annotated as repeat elements that belong to repeat families such as long interspersed nuclear elements (LINEs), short interspersed nuclear elements (SINEs), long terminal repeats (LTRs), low complexity DNA (DNA), rolling circle (RC), satellite repeats, simple repeats or other (rRNA, small nuclear RNA [snRNA], signal recognition particle RNA [srpRNA]) in University of California, Santa Cruz (UCSC) RepeatMasker tracks in all autosomal bins (left), significantly closed bins in TDPneg nuclei (center), or significantly open bins in TDPneg nuclei (right).χ2 test was done to determine enrichment of LINEs in open versus closed bins (79.72% versus 37.14%; χ2= 56.41, p < 0.0001) and in open versus all bins (79.72% versus 55.90%; χ2= 48.73, p < 0.0001). (E) Representative coverage plots of LINEs that are significantly more accessible (FDR < 0.05).
Figure 6.
Figure 6.. Loss of TDP-43 Is Associated with Increased Retro-transposition
(A) qPCR quantification of L1ORF2 DNA normalized to SATA repeat DNA in TDPpos and TDPneg neuronal nuclei (n = 7 pairs; t test, p = 0.0262). (B) Immunofluorescence image of CRISPR/Cas9-engineered TARDBP knockout cells (red = TDP-43, blue = DAPI). Scale bar, 5 μm. (C) Immunoblot of TDP-43 (top) and GAPDH (bottom) from cells transfected with Cas9 only (left) versus Cas9 with one of two guide RNAs used to knock out TARDBP (sgRNA1 and sgRNA2, middle and right). (D) Chromatin immunoprecipitation with anti-H3K9me3 or non-specific IgG from HeLa cells transfected with Cas9 alone versus Cas9 with one of two different guide RNAs (sgRNA1 and sgRNA2) that target TARDBP followed by qPCR for LINE1 DNA. Data are shown as mean + SEM (n = 2 independent replicates; two-way ANOVA: TARDBP knockout p = 0.0020, H3K9me3 versus IgG p < 0.0001; interaction p = 0.0022; post hoc analysis with Bonferroni correction *p < 0.05, ***p < 0.001). (E) Retrotransposition assay using a LINE1-GFP plasmid containing ORF1, ORF2, and a reverse orientation sequence of EGFP harboring an internal intron. After transcription, the intron within EGFP is spliced out followed by reverse transcription and integration of the DNA into genomic DNA, resulting in EGFP expression only from cells that have undergone retrotransposition. ((F and G) Representative flow cytometry dot plots of untransfected cells (F) and LINE1-GFP-transfected cells (G). GFP fluorescence reflects retro-transposition, and propidium iodide (PI) counterstain is used to assess viability. ((H) Retrotransposition efficiency as measured by %GFP expression in trans-fected with LINE1-GFP with either Cas9 only, or Cas9 with one of two different guide RNAs (sgRNA1 and sgRNA2) that target TARDBP (n = 8 independent experiments with three technical replicates in each experiment). TARDBP knockout increases retrotransposition (Cas9 3.57%; sgRNA1 4.27%, p < 0.0001; sgRNA 4.03%, p = 0.0001). Lamivudine (3-TC) reduced retro-transposition activity irrespective of TDP-43 knockout (n = 4 independent experiments with three technical replicates in each experiment; 44.7% decrease down to 1.97%; p < 0.0001). Analyzed using a mixed effects linear regression model and shown as β + SEM (see Table S5).

References

    1. Amlie-Wolf A, Ryvkin P, Tong R, Dragomir I, Suh E, Xu Y, Van Deerlin VM, Gregory BD, Kwong LK, Trojanowski JQ, et al. (2015). Transcrip-tomic Changes Due to Cytoplasmic TDP-43 Expression Reveal Dysregulation of Histone Transcripts and Nuclear Chromatin. PLoS ONE 10, e0141836. - PMC - PubMed
    1. Andrews S (2010). FastQC: a quality control tool for high throughput sequence data (Babraham Institute). http://www.bioinformatics.babraham.ac.uk/projects/fastqc.
    1. Avendaño-Vázquez SE, Dhir A, Bembich S, Buratti E, Proudfoot N, and Baralle FE (2012). Autoregulation of TDP-43 mRNA levels involves interplay between transcription, splicing, and alternative polyA site selection. Genes Dev. 26, 1679–1684. - PMC - PubMed
    1. Ayala YM, De Conti L, Avendaño-Vázquez SE, Dhir A, Romano M, D’Ambrogio A, Tollervey J, Ule J, Baralle M, Buratti E, and Baralle FE (2011). TDP-43 regulates its mRNA levels through a negative feedback loop. EMBO J. 30, 277–288. - PMC - PubMed
    1. Azevedo FA, Carvalho LR, Grinberg LT, Farfel JM, Ferretti RE, Leite RE, Jacob Filho W, Lent R, and Herculano-Houzel S (2009). Equal numbers of neuronal and nonneuronal cells make the human brain an isomet-rically scaled-up primate brain. J. Comp. Neurol 513, 532–541. - PubMed

Publication types

MeSH terms

Supplementary concepts