. 2019 Jun;570(7761):332-337.
doi: 10.1038/s41586-019-1195-2. Epub 2019 May 1.

Single-cell transcriptomic analysis of Alzheimer's disease

Affiliations

Single-cell transcriptomic analysis of Alzheimer's disease

Hansruedi Mathys et al. Nature. 2019 Jun.

Erratum in

Abstract

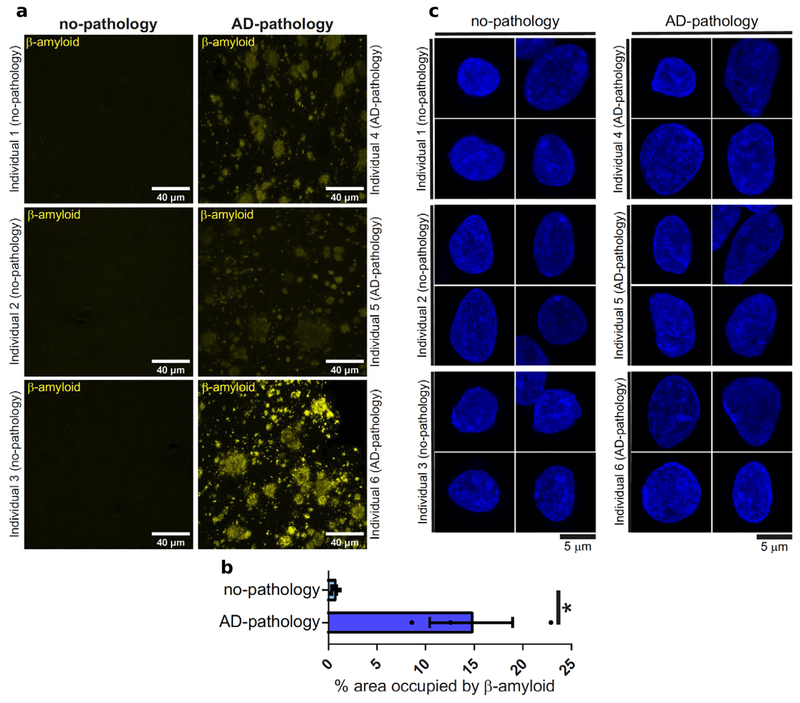
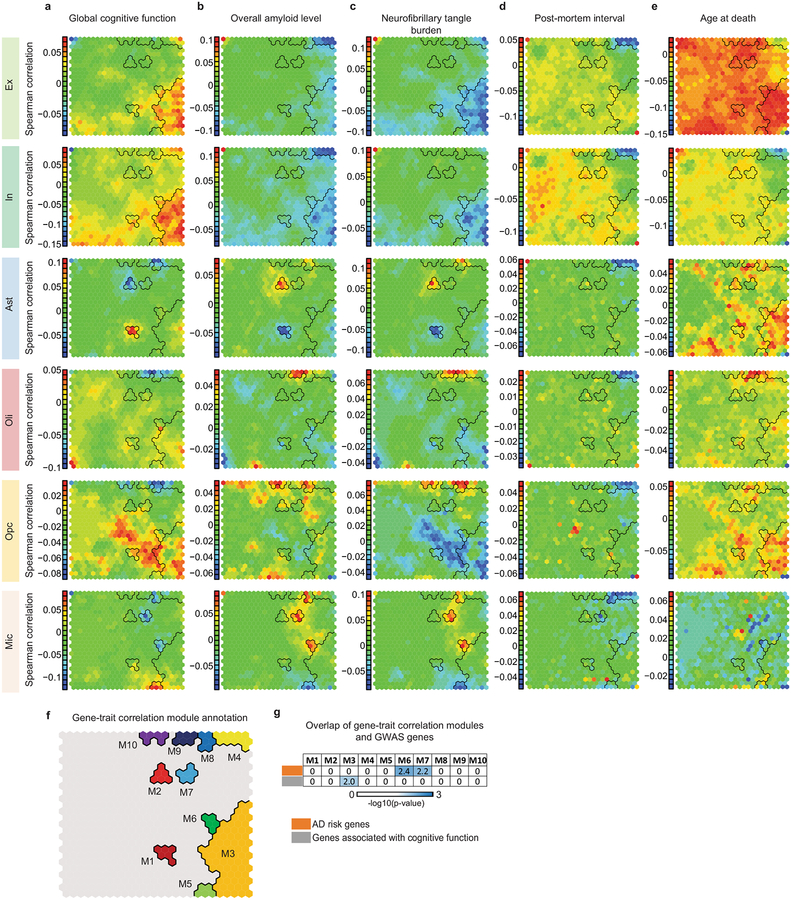
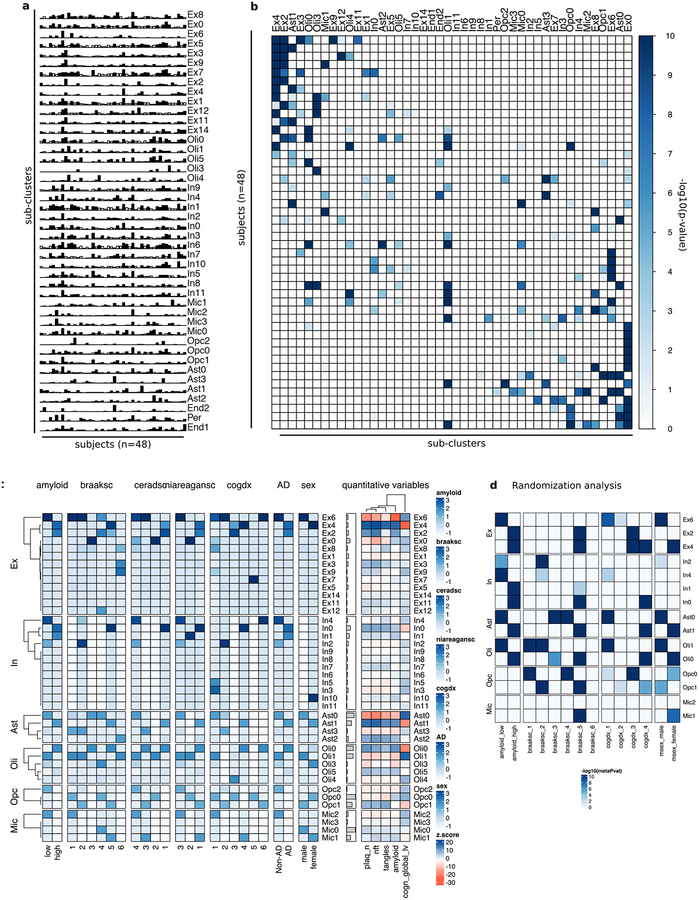
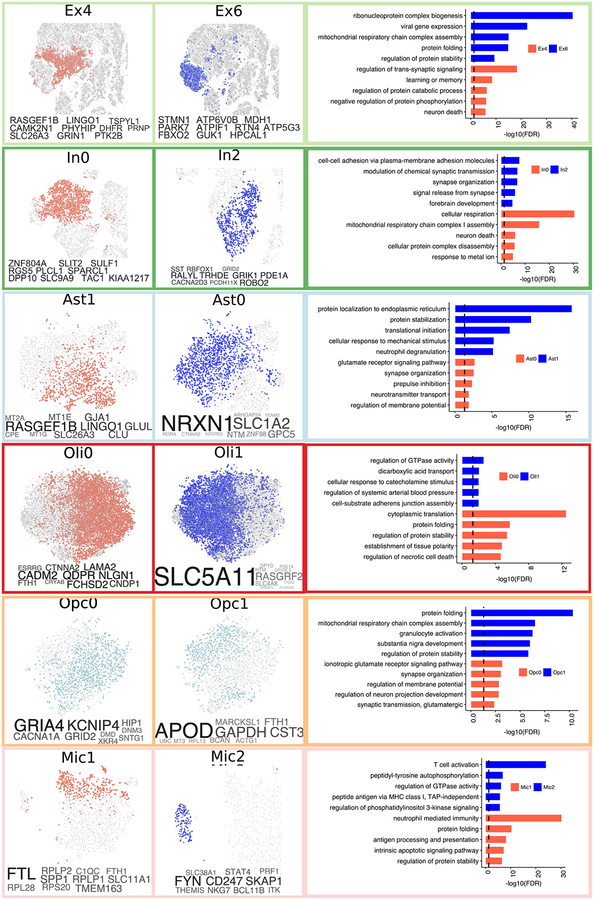
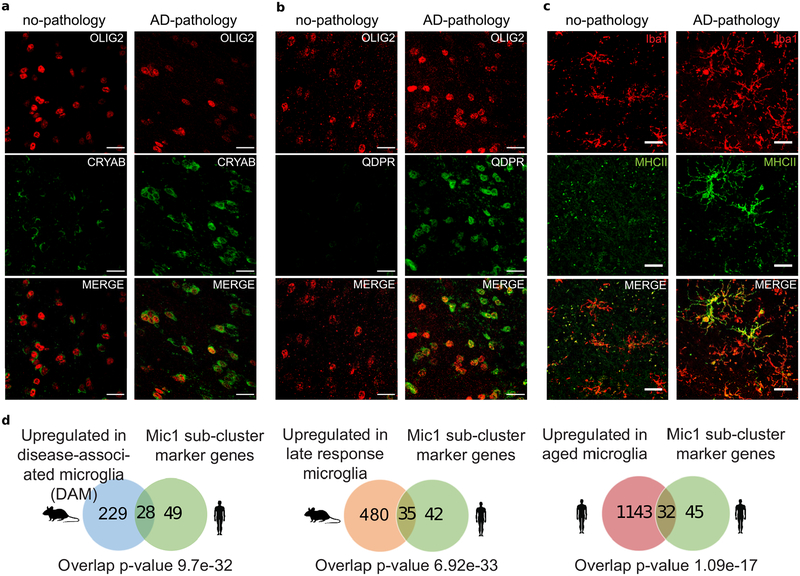
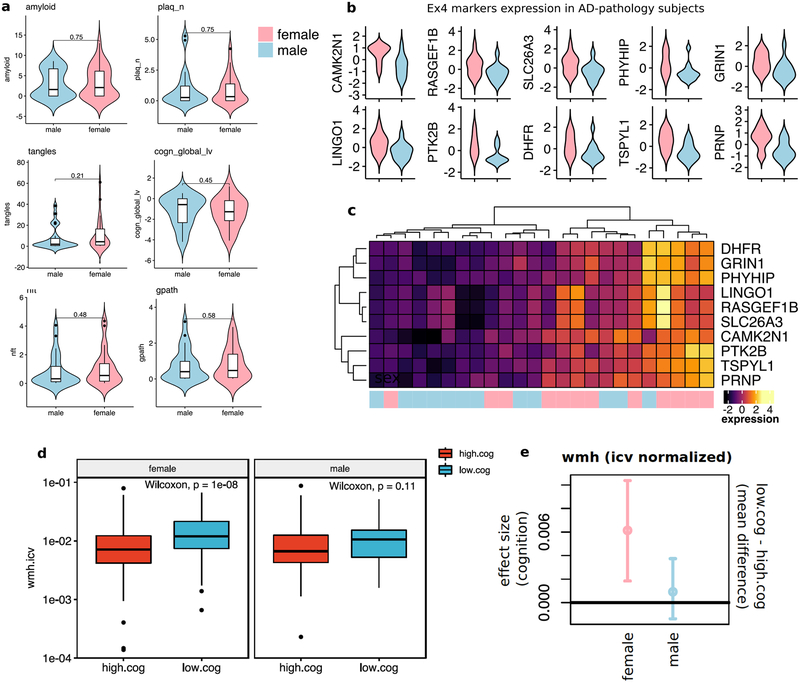
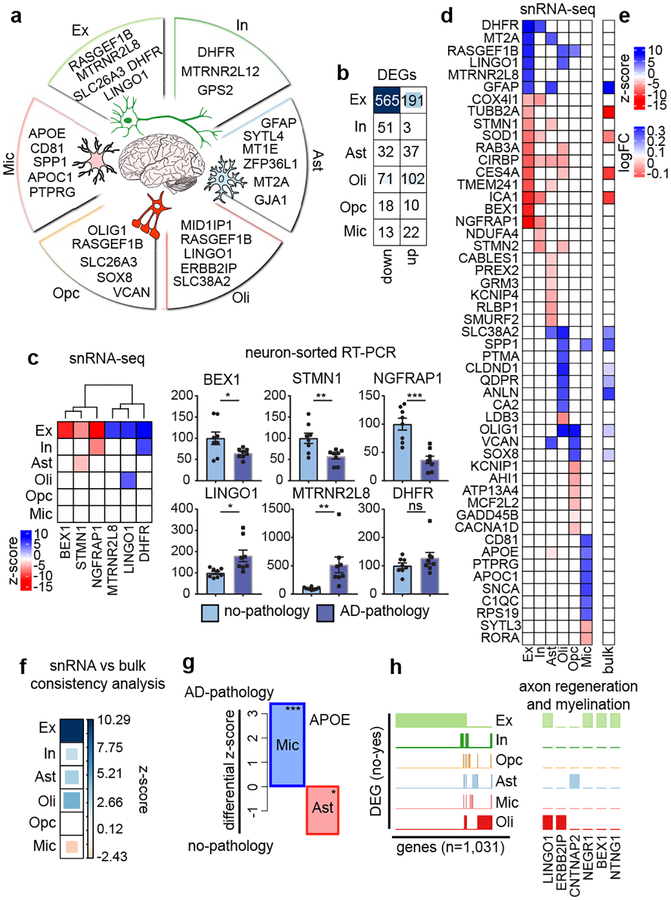
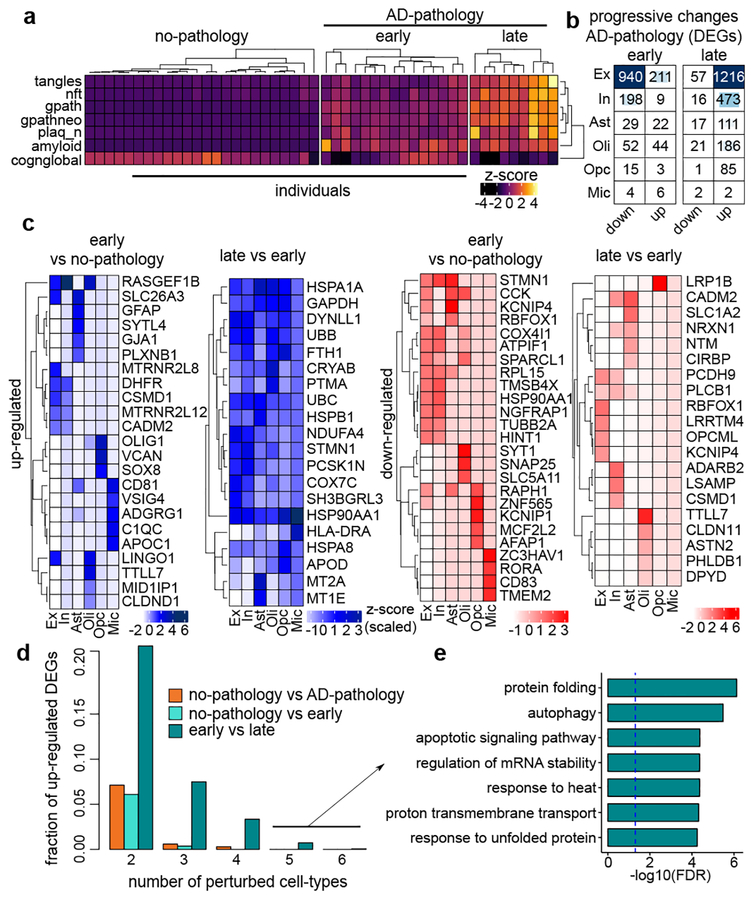
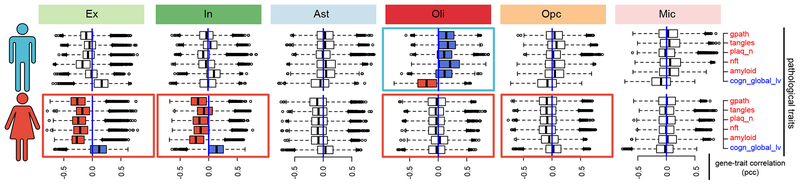
Alzheimer's disease is a pervasive neurodegenerative disorder, the molecular complexity of which remains poorly understood. Here, we analysed 80,660 single-nucleus transcriptomes from the prefrontal cortex of 48 individuals with varying degrees of Alzheimer's disease pathology. Across six major brain cell types, we identified transcriptionally distinct subpopulations, including those associated with pathology and characterized by regulators of myelination, inflammation, and neuron survival. The strongest disease-associated changes appeared early in pathological progression and were highly cell-type specific, whereas genes upregulated at late stages were common across cell types and primarily involved in the global stress response. Notably, we found that female cells were overrepresented in disease-associated subpopulations, and that transcriptional responses were substantially different between sexes in several cell types, including oligodendrocytes. Overall, myelination-related processes were recurrently perturbed in multiple cell types, suggesting that myelination has a key role in Alzheimer's disease pathophysiology. Our single-cell transcriptomic resource provides a blueprint for interrogating the molecular and cellular basis of Alzheimer's disease.


Conflict of interest statement

Competing interests The authors declare no competing interests.

Figures

Extended Data Fig. 1 |
Extended Data Fig. 1 |. Pathological status verification physical integrity of isolated neuronal nuclei.
a, Immunohistochemistry with anti-amyloidbeta (D54D2, yellow) antibody in the grey matter of Brodmann area 10 of no-pathology and pathology individuals. b, Quantification of the amyloid-beta immunostaining shown in (a). Error bars show the standard error of the mean, asterisks denote statistical significance as assessed by Student’s two-tailed t-test (*, P-Value < 0.05, exact P value 0.030). c, High resolution confocal microscopy images of neuronal nuclei isolated from no-pathology and pathology individuals and stained with Hoechst. The experiment was performed once.
Extended Data Fig. 2 |
Extended Data Fig. 2 |. Single-nucleus RNA-seq profiling and cell type characterization.
a, Study cohort and sample preparation. b, Clustering analysis workflow. c, 2-dimensional t-SNE projection of all annotated cells (n=75,060 from 24 pathology and 24 no-pathology individuals). d, Correlation matrix (Pearson correlation coefficient) of the average expression profiles by cell-type for each individual.
Extended Data Fig. 3 |
Extended Data Fig. 3 |. Consistency of cells of the same type across individuals.
a, Known cell-type marker gene expression for each cell-type. b, Expression of known cell-type marker genes in each cluster (left) and fraction of cells in each cluster expressing each marker gene (right). Vertical blue line represents a scale bar referencing 0.5. c, over-representation analysis (hypergeometric test) within each of the pre-cluster marker sets (rows) of genes identified as markers in Lake et al. 2018 (n=1729 total genes, columns, left) and genes identified as markers of cortical layers in He et al. 2017 (n=3400 total genes, columns, right). d, fraction of cells of each type isolated across all (n=48, left), no-pathology (n=24, center), and AD-pathology (n=24, right) individuals. e, fraction of cells of each type isolated from each individual (n=48, columns).
Extended Data Fig. 4 |
Extended Data Fig. 4 |. Expression values and validation of top DEGs.
a, mean expression values of genes across the nuclei isolated from each individual. Each point represents one individual. DEGs were classified into low, mid, or highly expressed based on their median expression level across the cells of the corresponding cell-type. Groups were defined based on k-means clustering (k=3). Top 3 genes for each group and cell-types are shown. For Opc and Mic only 1 and 2 genes were classified within the high expression group. Box Plots are centered around the median, with interquartile ranges defining the box. b, RNA in-situ hybridization (RNAscope) with probes detecting excitatory neuron marker SLC17A7 (red) and NTNG1 (blue) in the grey matter of Brodmann area 10 (BA10) of a no-pathology and a pathology individual (left). The tissue was counterstained with hematoxylin. Right, quantification of RNA in situ hybridization on BA10 tissue sections (mean ± s.e.m.; *, P-Value < 0.05, Student’s two-tailed t-test, exact P value = 0.047; n=4 no-pathology and n=4 pathology individuals; n= 5, 6 images per individual).
Extended Data Fig. 5 |
Extended Data Fig. 5 |. Overlap of genes altered in AD pathology and progression.
Quantification of the overlap (jaccard coefficient) between pairs of gene sets identified as differentially expressed (DE) in each of the major cell-types when comparing cells isolated from AD pathology individuals with cells isolated from no-pathology, and combinations of early and late pathology.
Extended Data Fig. 6 |
Extended Data Fig. 6 |. Cell-type-specific and phenotype-specific gene-trait correlation analysis.
a–e, Self-organizing map (SOM) generated from transcriptome-wide gene expression correlation of each gene with neuropathological signatures of AD (a: cogn_global_lv; b: amyloid; c: nft d, pmi; e, age_death). Genes with similar correlation patterns are mapped to the same SOM unit and similar units group close together. SOM grid layout is common and built jointly across all phenotypes and all cell types (including Fig. 4). Color: Average Spearman’s rank correlation for genes in each unit. f, Selected SOM territories (M1–M10). g, Overlap (one-sided Fisher’s exact test) between gene-trait correlation module genes (M3 n = 1472, M6 n = 70, M7 n = 80 genes) and AD GWAS risk genes (top) (n = 28 genes), as well as genes associated with general cognitive function (bottom) (n = 709 genes). The p-values have been adjusted for multiple hypothesis testing, -log10(Bonferroni corrected p-values) are shown.
Extended Data Fig. 7 |
Extended Data Fig. 7 |. Sub-cluster cell over-representation analyses.
a, Cell composition of each identified subclusters (rows) across individuals (columns). Bars represent the fraction of cells corresponding to each individual. Bar color indicates whether the corresponding value exceeds (black) or not (white) the average value measured across all the entries in the row. b, Over-representation analysis (hypergeometric test) within each pre-cluster (columns) of cells isolated from each individual (rows). c, Over-representation analysis within each sub-cluster of cells isolated from individuals with different values of discrete clinico-pathological variables (overall amyloid level [amyloid], Braak stage [braaksc], CERAD score [ceradsc], NIA-Reagan score [niareagansc], clinical consensus diagnosis of cognitive status at the time of death [cogdx], sex). The scale bars on the right indicate the significance of the over-representation (hypergeometric test, −log10(p-value), z-scaled, FDR multiple testing correction). For quantitative variables enrichment was computed based on an estimated z-score quantifying the deviation from random expected values using resampling (see methods). The quantitative variables considered are neuritic plaque count (plaq_n), neurofibrillary tangle burden (nft), tangle density (tangles), overall amyloid level (amyloid), and global cognitive function (cogn_global_lv, last valid score). For a detailed description of clinico-pathological variables see Extended Data Text S1. d, Over-representation analysis (hypergeometric test) similar to (a) but computed across only cells isolated from randomly chosen female and male individuals for pathology and no-pathology groups (see methods). Scores represent aggregated p-values (meta-p values, meanp method, metap R package) computed across 100 random realizations. Only scores passing a FDR<0.01 (correction across traits × subpopulations) are plotted.
Extended Data Fig. 8 |
Extended Data Fig. 8 |. Cell-type subpopulations.
Cells from sub-clusters enriched (red) or depleted (blue) with cells for individuals with AD pathology and cognitive decline shown using t-SNE for major cell types (Ast1 n=1134, Ast0 n=1728, Oli0 n=8310, Oli1 n=8032, Ex4 n=3198, Ex6 n=2757, In0 n=2368, In2 n=984, Opc0 n= 1,589, Opc1 n= 976, Mic1 n=509, Mic2 n=169 cells), corresponding marker genes (font proportional to enrichment level) (left), and enriched gene ontology terms (right). GO enrichment based on FDR-corrected cumulative hypergeometric P-values, with P-value ranked gene marker lists (FDR<0.01, LFC>0.5, two-sided Wilcoxon-rank-sum test) used as input (Ex4=783, Ex6=2438, In0=1702, In2=350, Ast1=574, Ast0=73, Oli0=227, Oli1= 73, Opc0 n=19, Opc1 n=536, Mic1 n=487, Mic2 n=646).
Extended Data Fig. 9 |
Extended Data Fig. 9 |. Immunohistochemistry of subpopulation markers in oligodendrocyte lineage cells and microglia.
a, oligodendrocyte lineage cell subpopulation marked by alpha B-crystallin (CRYAB). Immunohistochemistry with anti-OLIG2 (red) and anti-CRYAB (green) antibodies in the white matter of Brodmann area 10 of a no-pathology and a pathology individual (scale bar: 20μm). A selected area of these images is shown in Fig. 3g. The experiment was performed once. b, oligodendrocyte lineage cell subpopulation marked by quinoid dihydropteridine reductase (QDPR). Immunohistochemistry with anti-OLIG2 (red) and anti-QDPR (green) antibodies in the white matter of Brodmann area 10 of a no-pathology and a pathology individual (scale bar: 20μm). A selected area of these images is shown in Fig. 3h. The experiment was performed once. c, Immunohistochemistry with anti-Iba1 (red) and anti-MHC class II (green) antibodies in the white matter of Brodmann area 10 of a no-pathology and a pathology individual (scale bar: 20μm). The experiment was performed once. d, Overlap (one-sided Fisher’s exact test) between Mic1 marker genes and genes upregulated in mouse disease-associated microglia (left), in mouse late response microglia (middle), and in aged human microglia (right).
Extended Data Fig. 10 |
Extended Data Fig. 10 |. Sex comparisons in pathology, expression and white matter.
a, Quantitative clinico-pathological measurement comparison between male and female individuals (female n=24, male n=24, two-sided Wilcoxon-rank-sum test). Violin plots are centered around the median with interquartile ranges with the shape representing individual distribution. The quantitative clinico-pathological variables considered are overall amyloid level (amyloid), neuritic plaque burden (plaq_n), neurofibrillary tangle burden (nft), tangle density (tangles), global cognitive function (cogn_global_lv, last valid score) and global AD pathology burden (gpath). Violin plots are centered around the median with interquartile ranges with the shape representing individual distribution. b, Violin plots showing aggregate expression levels (z-scaled) across Ex neurons in female (red) vs. male (blue) individuals (n= 12 each) of top 10 marker genes of AD-associated Ex4 subpopulation of excitatory neurons. Violin plots are centered around the median with interquartile ranges with the shape representing individual distribution. c, Hierarchical clustering of pathology-affected individuals (columns) based on average expression level (color) of top 10 marker genes (rows) of AD-enriched Ex4 subpopulation of excitatory neurons for female vs. male individuals. d–e Statistical comparison of in-vivo brain MRI imaging from ROSMAP cohort. d., Intracranial volume-normalized white matter hyperintensities (wmh.icv) measures for female (n=399) and male (n=106) subjects and high- (female n=252, male n=63) and low-cog (female n= 147, male n=43) groups. Groups were defined based on whether subjects have an overall cognition score lower (low-cog, z-scoe<0) or larger (high-cog, z-scoe>0) than the average. Mean rank difference values between cog groups were compared using the two-sided Wilcoxon rank sum test. Boxplots are centered around the median, with interquartile ranges defining the box. e., Statistical estimation of significant difference in WMH between low-cog and high-cog groups in females, and between low-cog and high-cog groups in males, assessed by bootstrap point and 95% confidence interval estimation of the effect size (mean difference) between groups. Bootstrap resampling was performed by resampling n=40 observations per group 1000 times. Horizontal line highlights zero difference. The positive effect size point and confidence interval estimates do not overlap the zero line in the female group, which indicates statistical evidence of an increment of white matter hyperintensities (wmh.icv) in the low.cog group relative to high.cog in females but not in males.
Fig. 1 |
Fig. 1 |. Cell-type specific gene expression changes in AD pathology.
a, Genes most upregulated: excitatory (Ex) and inhibitory (In) neurons, astrocytes (Ast), oligodendrocytes (Oli), oligodendrocyte precursor cells (OPC), and microglia (Mic) (Font size, -log10 P-value). b, Differentially-expressed gene (DEG) counts (2-sided Wilcoxon-rank-sum test, FDR<0.01, logFC>0.25, Poisson mixed-model FDR<0.05). c, RT-qPCR validation. snRNA-seq differential scores for Ex and In DEGs (z-score, Poisson mixed-model) (left) and qPCR validation (right), FACS-sorted NeuN-positive nuclei (no-pathology n=8, pathology n=8 individuals) (mean ± s.e.m.; ***, P < 0.001; **, P < 0.01, *; P < 0.05; ns; P > 0.05; Student’s two-tailed t-test). d, Top snRNA-seq DEGs differential scores (z-score, Poisson mixed-model) and corresponding values in bulk RNA-seq (e) (ROSMAP cohort, n=484, P-Value <0.01). f, Global snRNA-seq and bulk RNA-seq consistency. (Dis)Agreement is estimated by deviation from random expectation (z-score) of single-cell DEG average rank scores in the ranked list of bulk differential analysis. g, APOE differential expression in Mic (n=955 cells, 24 pathology individuals; n=965 cells, 24 no-pathology individuals) and Ast (n=1830 cells, 24 pathology individuals; n=1562 cells, 24 no-pathology individuals) (z-score Poisson mixed-model, ***, P-Value = 0.001, *, P-Value = 0.05, two-sided, standard normal). h, Binary plot indicating with bars whether a gene (column) is a DEG in a cell-type (rows) or not (left, n=1,031 DEGs). Six genes associated with myelination and/or axon regeneration (right).
Fig. 2 |
Fig. 2 |. Gene expression changes in AD pathology progression.
a, Phenotypic clustering of 48 individuals (columns) using clinico-pathological variables (rows) measuring neuronal neurofibrillary tangle density (tangles), neurofibrillary tangle burden (nft), global AD pathology burden (gpath), neuritic plaque burden (plaq_n), overall amyloid level (amyloid), and global cognitive function (cogn_global_lv). b, DEG counts (2-sided Wilcoxon-rank-sum test, FDR<0.01, |log-Fold-Change|>0.25, Poisson mixed-model FDR<0.05). c, Most-significantly-altered genes (rows) for each cell type (columns) and comparison, based on p-value rank (FDR<0.01, 2-sided Wilcoxon-rank-sum test, z-scores Poisson mixed-model, column-scaled). d, Fraction of total up-regulated genes (y-axis) as a function of the total number of cell-types in which the up-regulation occurs e, GO terms associated with genes upregulated in late-pathology common to ≥5 cell types (n=11 genes, hypergeometric test, FDR correction).
Fig. 3 |
Fig. 3 |. Cellular subpopulation trait associations.
a–d, Overrepresentation (hypergeometric test) within each sub-cluster of cells isolated from individuals with varying (a) amyloid levels, (b) Braak stages, (c) cognitive status at time of death (cogdx, 1=no impairment; 4=impairment), and (d) sex. Only significant associations after FDR correction over all variables and subpopulations are displayed. e, Fraction of cells in each sub-cluster. f, Quantitative clinico-pathological feature enrichment across sub-clusters for: global AD pathology burden (gpath); neurofibrillary tangle burden (nft); neuritic plaque count (plaq_n); overall amyloid levels (amyloid); global cognitive function (global_cogn). Z-score estimated using resampling. Square size proportional to numeric entry. g, Immunohistochemistry with anti-OLIG2 (red) and anti-CRYAB (green) antibodies in white matter of Brodmann area 10 of a no-pathology and an AD-pathology individual (scale bar: 10μm). The experiment was performed once. h, Similar to (g) for anti-OLIG2 (red) and anti-QDPR (green). The experiment was performed once.
Fig. 4 |
Fig. 4 |. Sex-specific differential response to AD pathology.
Individual-level transcriptome-wide gene-trait correlation analysis. Boxplots show the distribution of correlation values (PCC, Pearson correlation coefficient) computed between gene expression profiles (n= 17,926 genes) averaged for cells of each type across each individual and the corresponding pathological measurements across individuals (female n=24, male n=24 individuals). Boxplots are centered around the median, with interquartile ranges defining the box. Pathological traits are represented in red font and cognition in blue. Rectangles around plots highlight the most contrasting differences observed between male and female transcriptional responses, with blue indicating dominant positive correlation and red negative correlation.

Comment in

References

    1. Masters CL et al. Alzheimer’s disease. Nat Rev Dis Primers 1, 15056 (2015). - PubMed
    1. Hardy J & Selkoe DJ The amyloid hypothesis of Alzheimer’s disease: progress and problems on the road to therapeutics. Science 297, 353–356 (2002). - PubMed
    1. Braak H & Braak E Neuropathological stageing of Alzheimer-related changes. Acta Neuropathol. 82, 239–259 (1991). - PubMed
    1. De Strooper B & Karran E The Cellular Phase of Alzheimer’s Disease. Cell 164, 603–615 (2016). - PubMed
    1. Canter RG, Penney J & Tsai L-H The road to restoring neural circuits for the treatment of Alzheimer’s disease. Nature 539, 187–196 (2016). - PubMed

Publication types