. 2019 Aug;17(8):1613-1626.
doi: 10.1158/1541-7786.MCR-18-1235. Epub 2019 May 1.

TFE3 Xp11.2 Translocation Renal Cell Carcinoma Mouse Model Reveals Novel Therapeutic Targets and Identifies GPNMB as a Diagnostic Marker for Human Disease

Affiliations

TFE3 Xp11.2 Translocation Renal Cell Carcinoma Mouse Model Reveals Novel Therapeutic Targets and Identifies GPNMB as a Diagnostic Marker for Human Disease

Masaya Baba et al. Mol Cancer Res. 2019 Aug.

Abstract

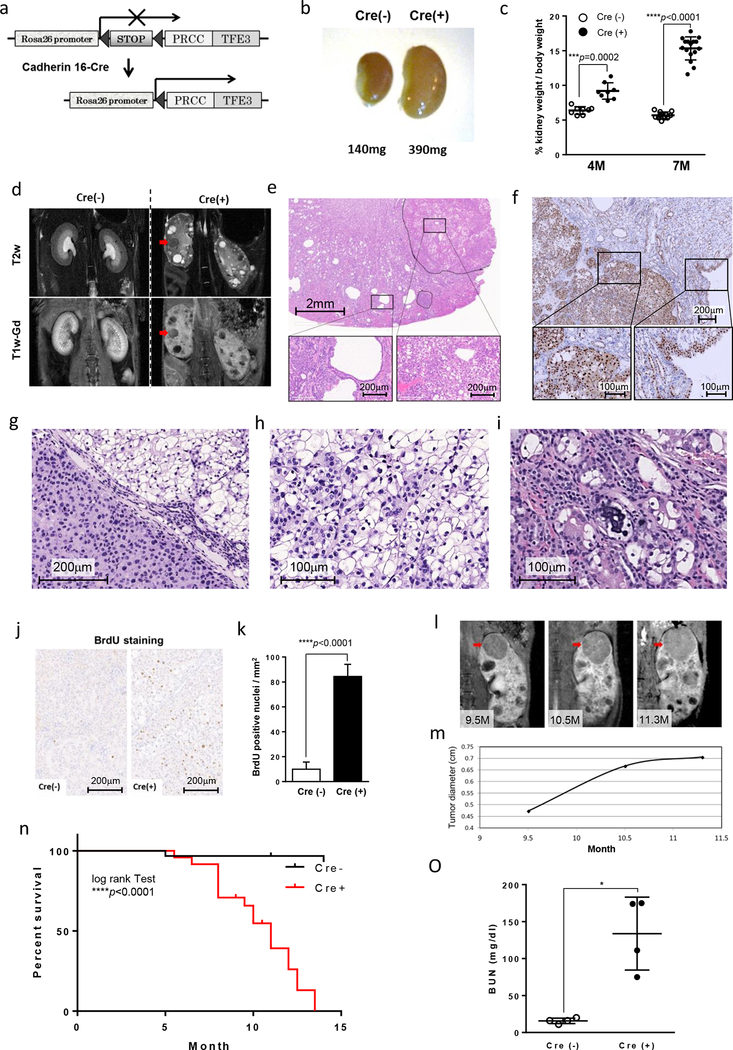
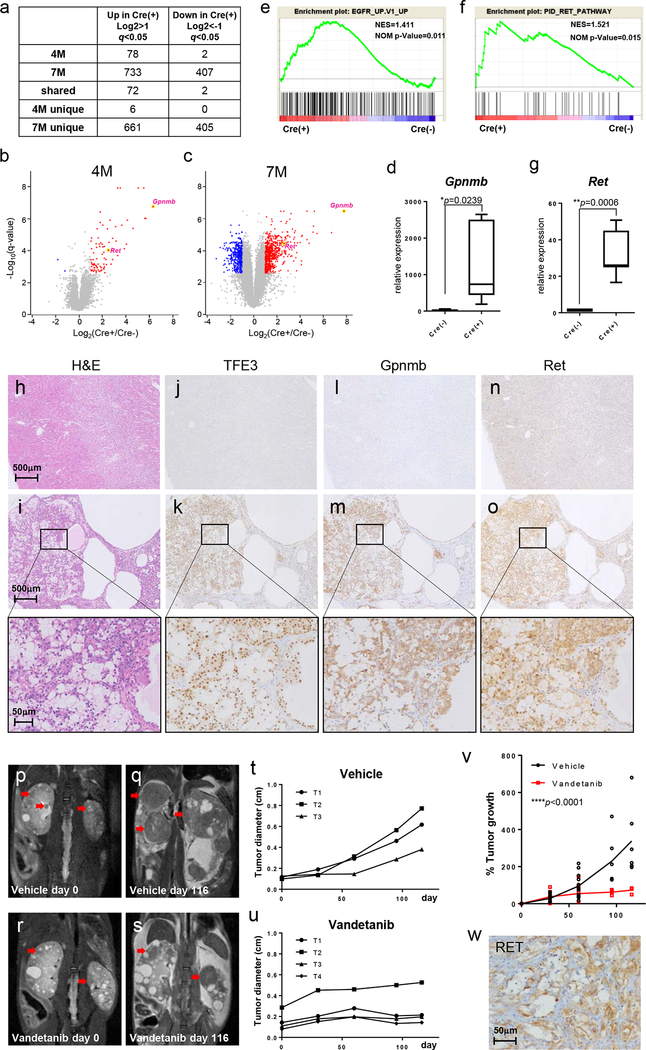
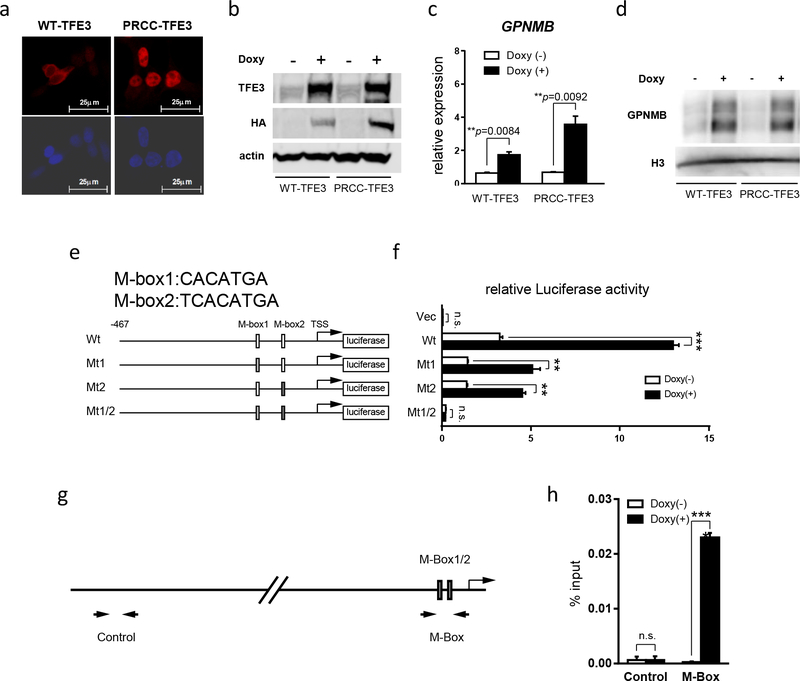
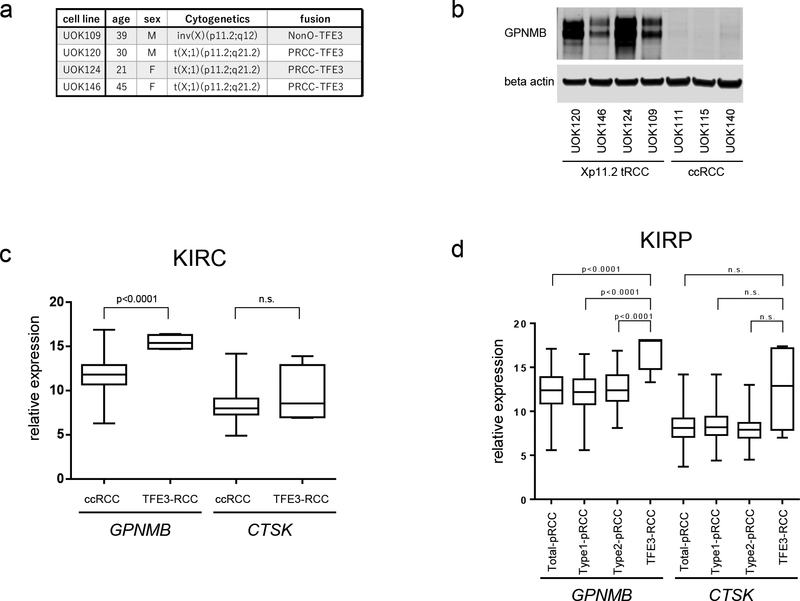
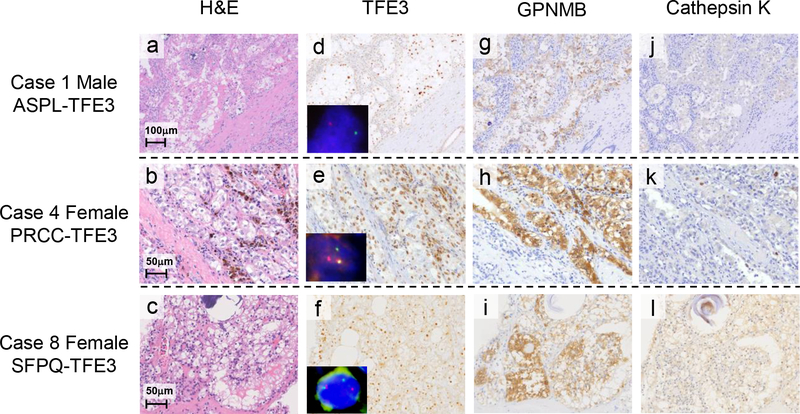
Renal cell carcinoma (RCC) associated with Xp11.2 translocation (TFE3-RCC) has been recently defined as a distinct subset of RCC classified by characteristic morphology and clinical presentation. The Xp11 translocations involve the TFE3 transcription factor and produce chimeric TFE3 proteins retaining the basic helix-loop-helix leucine zipper structure for dimerization and DNA binding suggesting that chimeric TFE3 proteins function as oncogenic transcription factors. Diagnostic biomarkers and effective forms of therapy for advanced cases of TFE3-RCC are as yet unavailable. To facilitate the development of molecular based diagnostic tools and targeted therapies for this aggressive kidney cancer, we generated a translocation RCC mouse model, in which the PRCC-TFE3 transgene is expressed specifically in kidneys leading to the development of RCC with characteristic histology. Expression of the receptor tyrosine kinase Ret was elevated in the kidneys of the TFE3-RCC mice, and treatment with RET inhibitor, vandetanib, significantly suppressed RCC growth. Moreover, we found that Gpnmb (Glycoprotein nonmetastatic B) expression was notably elevated in the TFE3-RCC mouse kidneys as seen in human TFE3-RCC tumors, and confirmed that GPNMB is the direct transcriptional target of TFE3 fusions. While GPNMB IHC staining was positive in 9/9 cases of TFE3-RCC, Cathepsin K, a conventional marker for TFE3-RCC, was positive in only 67% of cases. These data support RET as a potential target and GPNMB as a diagnostic marker for TFE3-RCC. The TFE3-RCC mouse provides a preclinical in vivo model for the development of new biomarkers and targeted therapeutics for patients affected with this aggressive form of RCC. IMPLICATIONS: Key findings from studies with this preclinical mouse model of TFE3-RCC underscore the potential for RET as a therapeutic target for treatment of patients with TFE3-RCC, and suggest that GPNMB may serve as diagnostic biomarker for TFE3 fusion RCC.


Conflict of interest statement

Disclosure of Potential Conflicts of Interest: Masaya Baba received a research grant from Ono Pharmaceutical Co. Ltd and Bristol-Myers Squibb K.K. Other authors declare no conflict of interest.

Figures

Figure 1.
Figure 1.. Generation and characterization of TFE3-RCC mouse model.
(a)A schematic diagram showing the generation of kidney specific PRCC-TFE3 expressing mice. A floxed Neomycin resistance cassette with stop codon, followed by a human PRCC-TFE3 cDNA, was inserted into the Rosa26 locus (PRCC-TFE3). Kidney-specific PRCC-TFE3 expression was obtained by crossing PRCC-TFE3 mice with Cadherin 16-Cre (KSP-Cre) mice. (b) Macroscopic appearance of PRCC-TFE3;KSP-Cre- [Cre(-)] and PRCC-TFE3;KSP-Cre+ [Cre(+)] mouse kidneys at the age of 7 months. (c) Relative ratio of kidney to body weight (100 X kidney weight/BW) of 4-month-old mice (n=8 for PRCC-TFE3;KSP-Cre- [Cre(-)]; n=8 for PRCC-TFE3;KSP-Cre+ [Cre(+)], unpaired t-test: ***p =0.0002) and 7-month-old mice (n=12 for [Cre(-)]; n=16 for [Cre(+)], unpaired t-test: ****p <0.0001) was calculated. Data are presented as mean with SD. (d) T2 weighted coronal magnetic resonance imaging (MRI) image (upper panel) and corresponding Gadolinium-enhanced T1 weighted MRI image (lower panel) of 7-month-old PRCC-TFE3;KSP-Cre- and PRCC-TFE3;KSP-Cre+ mice. The cysts appear bright on the T2w image and dark on the T1w. The tumor (red arrow) is well distinguished on both type of images. (e) A representative histology of hematoxylin and eosin (H&E) stained kidney from a 7-month-old PRCC-TFE3;KSP-Cre+ mouse. Lower panels are higher magnified images of the rectangular areas in upper panel. (f) Representative images of TFE3 immunohistochemistry of a kidney from a 7-month-old PRCC-TFE3;KSP-Cre+ mouse. Lower panels are higher magnified images of the rectangular areas in upper panel. (g, h, i) Representative H&E staining of solid tumors in 7-month-old PRCC-TFE3;KSP-Cre+ mice. Solid tumors are composed of two types of cells with eosinophilic cytoplasm (g) and large clear cytoplasm (h). (i) Psammoma body, a characteristic calcified lesion seen in human TFE3-RCC, was occasionally seen. (j) 5´-Bromo-2´-deoxyuridine (BrdU) (100 μg/g body wt) was injected intraperitoneally into 7-month-old PRCC-TFE3;KSP-Cre- mice and PRCC-TFE3;KSP-Cre+ mice 2 hr before euthanization. BrdU staining detects few proliferating cells in PRCC-TFE3;KSP-Cre- kidneys (left) and many proliferating cells in PRCC-TFE3;KSP-Cre+ kidneys (right). (k) Greater than 8-fold more BrdU incorporated cells were detected in PRCC-TFE3;KSP-Cre+ mouse kidneys compared with PRCC-TFE3;KSP-Cre- mouse kidneys (n=4 for each group, mean=10.0 per mm2 versus 84.4 per mm2, unpaired t-test: ****p<0.0001). BrdU positive cells per field were counted in 4 randomly selected fields from 4 mice for each group. Data are represented as means and SD. (l, m) Representative MRI images of and tumor (red arrow) diameters in PRCC-TFE3;KSP-Cre+ mouse kidneys, which were chronologically examined at 9.5, 10.5, and 11.3 months of age. (n) Kaplan-Meier survival analysis shows a statistically significant difference between PRCC-TFE3;KSP-Cre- and PRCC-TFE3;KSP-Cre+ mice (n=31 for [Cre(-)]; n=24 for [Cre(+)], log-rank test, ****p<0.0001). Median survival time of PRCC-TFE3;KSP-Cre+ mice is 11 months. (o) PRCC-TFE3;KSP-Cre+ mice die of renal failure. Blood urea nitrogen (BUN) levels were determined for PRCC-TFE3;KSP-Cre+ mice when moribund at ages ranging from 10 month to 12 month. Statistically significant elevation of BUN levels was observed in PRCC-TFE3;KSP-Cre+ mice compared with PRCC-TFE3;KSP-Cre- mice (n=4 for each group, mean=133.8 mg/dL versus mean=15.8 mg/dL, unpaired t-test: *p<0.017). Data are presented as mean with SD.
Figure 2.
Figure 2.. Overexpression of Gpnmb and Ret in TFE3-RCC mouse model.
(a) Numbers of genes differentially expressed between PRCC-TFE3;KSP-Cre+ kidneys and PRCC-TFE3;KSP-Cre- kidneys. (b, c) Volcano plot of gene expression changes for 4 month-old (b) and 7 month-old (c) PRCC-TFE3;KSP-Cre- kidneys and PRCC-TFE3;KSP-Cre+ kidneys. The x-axis specifies the fold-changes [Log2(Cre(+)/Cre(-))] and the y-axis specifies the negative log to the base 10 of the t-test q-values. Red and blue dots represent genes expressed at significantly higher or lower levels (>2 fold vs. <-2 fold) in PRCC-TFE3;KSP-Cre+ kidneys (q<0.05). Gpnmb was one of the most significant genes showing increased expression in both 4 month-old and 7 month-old PRCC-TFE3;KSP-Cre+ kidneys. Ret was identified as one of the highly expressed and druggable receptor tyrosine kinases in both 4 month-old and 7 month-old PRCC-TFE3;KSP-Cre+ kidneys. (d) Expression of Gpnmb was quantified by qRT-PCR analysis of 8 month-old PRCC-TFE3;KSP-Cre- mouse kidneys (n=6) and PRCC-TFE3;KSP-Cre+ mouse kidneys (n=7). Data are represented as box-and-whisker plot. (unpaired t-test) (e, f) Gene Set Enrichment Analysis (GSEA) of microarray data from 4 month old PRCC-TFE3; KSP-Cre+ mouse kidneys (n=4) vs 4 month old PRCC-TFE3; KSP-Cre- mouse kidneys (n=4) (e) and 7 month old PRCC-TFE3; KSP-Cre+ mouse kidneys (n=4) vs 7 month old PRCC-TFE3; KSP-Cre- mouse kidneys (n=3) (f). Significant enrichment of genes associated with EGFR activation (e) and RET activation (f) was seen in kidneys from PRCC-TFE3; KSP-Cre+ mice. NES: normalized enrichment score, NOM p-Value: Nominal p value. (g) Expression of Ret was quantified by qRT-PCR analysis of 8 month-old PRCC-TFE3;KSP-Cre- mouse kidneys (n=6) and PRCC-TFE3;KSP-Cre+ mouse kidneys (n=7). Data are represented as box-and-whisker plot. (unpaired t-test) (h) H&E staining of 7 month-old PRCC-TFE3;KSP-Cre- and (i) PRCC-TFE3;KSP-Cre+ mouse kidneys. (j-o) Representative immunostaining for TFE3 (j, k), Gpnmb (l, m), and Ret (n, o) on serial sections of 7 month-old PRCC-TFE3;KSP-Cre- (j, l, n) and PRCC-TFE3;KSP-Cre+ (k, m, o) kidneys. Lower panels are higher magnified images of the rectangular areas in upper panels. (p-v) Treatment of PRCC-TFE3;KSP-Cre+ mice with vandetanib, an inhibitor of RET. Representative coronal T2 weighted MRI images of vehicle treated (p, q) and vandetanib treated (100mg/kg) (r, s) PRCC-TFE3;KSP-Cre+ mice chronologically taken on day 0 and day 116 of the study. Red arrows indicate the tumors which were tracked for growth. (t, u) Representative tumor growth curves of vehicle treated (t) and vandetanib treated (u) PRCC-TFE3;KSP-Cre+ mice shown in (p, q) and (r, s), respectively. The largest dimension of each tumor was measured from sequential MRI images taken on day 0, 30, 60, 95, and 116 of treatment. (v) Nonlinear regression analysis of % tumor growth in the vehicle treated group (black dots) and vandetanib treated group (red square). (****p<0.0001) (w) Representative immunostaining for RET on human TFE3-RCC demonstrates significant cytoplasmic staining.
Figure 3.
Figure 3.. Gpnmb is a direct transcriptional target of PRCC-TFE3.
(a) Immunocytochemistry using anti-HA antibody on HEK293 derived stable cell lines which express HA tagged wild type TFE3 and PRCC-TFE3 in a doxycycline- dependent manner. (b) Western blotting with anti-TFE3, anti-HA, and anti-beta actin on HEK293 derived doxycycline-inducible cell lines cultured without and with doxycycline.(c) GPNMB expression was quantified by qRT-PCR on HEK293 derived doxycycline-inducible cell lines which were cultured without (open bar) and with doxycycline (solid bar). Data represent means ± SD (triplicate, unpaired t-test: WT-TFE3 **p=0.0084, PRCC-TFE3 **p=0.0092). Representative data from at least three independent experiments are shown. (d) Western blotting with anti-GPNMB and anti-histone H3 on HEK293 derived doxycycline-inducible cell lines cultured without and with doxycycline. (e) Scheme of Luciferase reporter constructs with human GPNMB promoter. Putative TFE3 consensus sequences are listed as M-box1 (CACATGA) and M-box2 (TCACATGA). Wt: wild type GPNMB promoter construct; Mt1: M-box1 is mutated to CTCGAGA; Mt2: M-box2 is mutated to TCTCGAGA; M-box1/2: Both M-box1 and M-box2 are mutated to CTCGAGA and TCTCGAGA, respectively. (f) Each Luciferase reporter construct and pGL4 as a negative control were transfected into PRCC-TFE3 doxycycline- inducible HEK 293 cell line with phRL internal control. 12hr after transfection, medium was changed to new medium with or without doxycycline, followed by additional 24hr incubation and harvest. The x-axis displays relative Luciferase activity. GPNMB promoter activity is upregulated by PRCC-TFE3 induction in an M-Box- dependent manner. Data represent means ± SD (triplicate, unpaired t-test: n.s. not significant, **p <.01, ***p <.001). Representative data from at least three independent experiments are shown. (g, h) ChIP was performed using anti-HA antibody on PRCC-TFE3 doxycycline-inducible HEK 293 cells cultured with or without doxycycline, followed by qPCR on ChIP samples. (g) Scheme indicating the primer sets used for qPCR. (h) ChIP-qPCR results demonstrate PRCC-TFE3 specifically binds to M-Box containing sequence in GPNMB promoter. Y-axis indicates % of input. Data represent means ± SD (triplicate, unpaired t-test: n.s. not significant, ***p <.001).
Figure 4.
Figure 4.. GPNMB overexpression differentiates TFE3-RCC from clear cell RCC and papillary RCC.
(a,) Detailed information of four TFE3-RCC cell lines. (b) Western blotting demonstrates significantly higher GPNMB expression in TFE3-RCC cell lines compared to ccRCC cell lines. (c) Comparison of GPNMB and Cathepsin K (CTSK) expression in TFE3-RCC (n=4) and ccRCC (n=465). The gene expression database for ccRCC (KIRC) from the Cancer Genome Atlas project which contained 4 cases of TFE3-RCC was utilized for analysis. (d) The gene expression database for papillary RCC (KIRP) from the Cancer Genome Atlas containing 6 cases of TFE3-RCC was utilized to compare GPNMB and Cathepsin K (CTSK) expression in TFE3-RCC and papillary RCC. Total papillary RCC (n=283 without TFE3-RCC) includes 161 cases of type1 papillary RCC and 79 cases of type2 papillary RCC. Data are represented as a box-and-whisker plot. (unpaired t-test with or without Welch’s correction, based on p-value of the F test: n.s. not significant)
Figure 5.
Figure 5.. Immunostaining of TFE3, GPNMB and Cathepsin K in human TFE3-RCCs
(a-l) Histology, immunohistochemistry (TFE3, GPNMB, and Cathepsin K), and TFE3 gene break-apart FISH on representative cases of human TFE3-RCC with different TFE3 fusion genes (Cases #1, 4, 8 in Table 1). (a, b, c) H&E staining displays characteristic histology resembling clear cell RCC and papillary RCCs composed of epithelioid clear cells and eosinophilic cells. Occasional psammoma bodies are seen. (d, e, f) Immunohistochemistry shows nuclear staining for TFE3. Representative images of TFE3 gene break-apart FISH are inserted. All cases show TFE3 translocations represented by separation of green and red probes. The male case has a split (d) and the female cases have split and fused signals (e, f). (g, h, i) Immunostaining for GPNMB demonstrates significant cytoplasmic staining. (j, k, l) Immunohistochemistry of Cathepsin K demonstrates either negative staining (j, k) or positive staining (l).

References

    1. de Jong B, Molenaar IM, Leeuw JA, Idenberg VJ, Oosterhuis JW. Cytogenetics of a renal adenocarcinoma in a 2-year-old child. Cancer genetics and cytogenetics 1986;21(2):165–9. - PubMed
    1. Shipley JM, Birdsall S, Clark J, Crew J, Gill S, Linehan WM, et al. Mapping the X chromosome breakpoint in two papillary renal cell carcinoma cell lines with a t(X;1)(p11.2;q21.2) and the first report of a female case. Cytogenet Cell Genet 1995;71:280–4. - PubMed
    1. Sidhar SK, Clark J, Gill S, Hamoudi R, Crew J, Gwilliam R, et al. The t(X;1)(p11.2;q21.2) translocation in papillary renal cell carcinoma fuses anovel gene PRCC to the TFE3 transcription factor gene. Hum Mol Genet 1996;5(9):1333–8. - PubMed
    1. Ross H, Argani P. Xp11 translocation renal cell carcinoma. Pathology 2010;42(4):369–73 - PubMed
    1. Weterman MA, Wilbrink M, Dijkhuizen T, van den Berg E, Geurts van Kessel A. Fine mapping of the 1q21 breakpoint of the papillary renal cell carcinoma-associated (X;1) translocation. Human genetics 1996;98(1):16–21. - PubMed

Publication types

MeSH terms