. 2019 May 1;11(490):eaat8462.
doi: 10.1126/scitranslmed.aat8462.

Aβ and tau prion-like activities decline with longevity in the Alzheimer's disease human brain

Affiliations

Aβ and tau prion-like activities decline with longevity in the Alzheimer's disease human brain

Atsushi Aoyagi et al. Sci Transl Med. .

Abstract

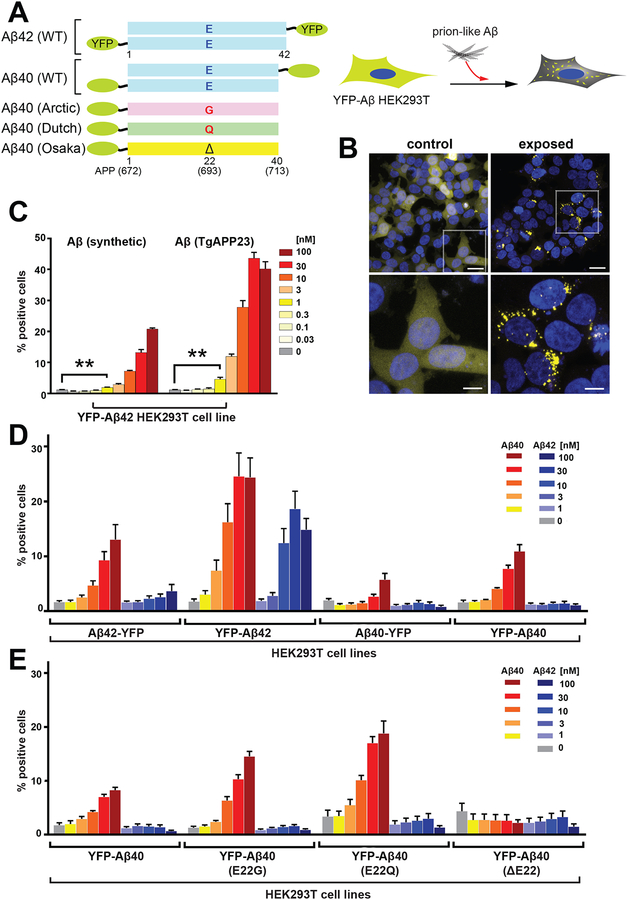
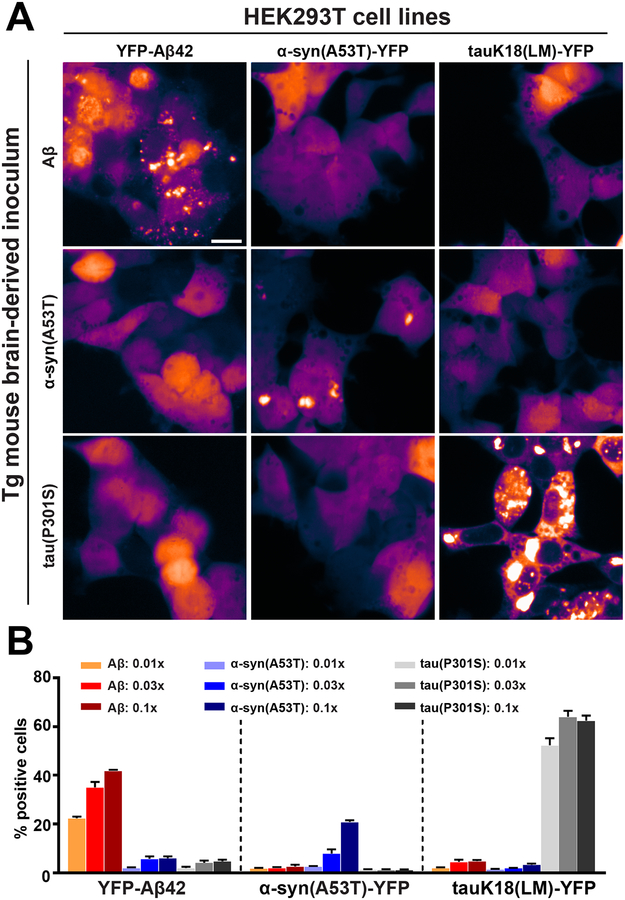
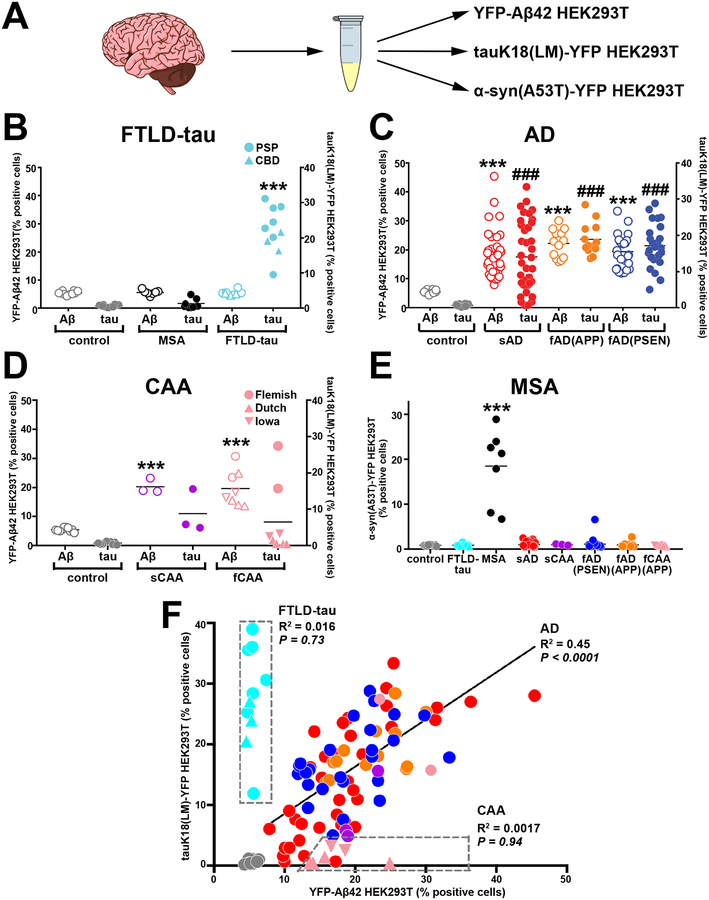
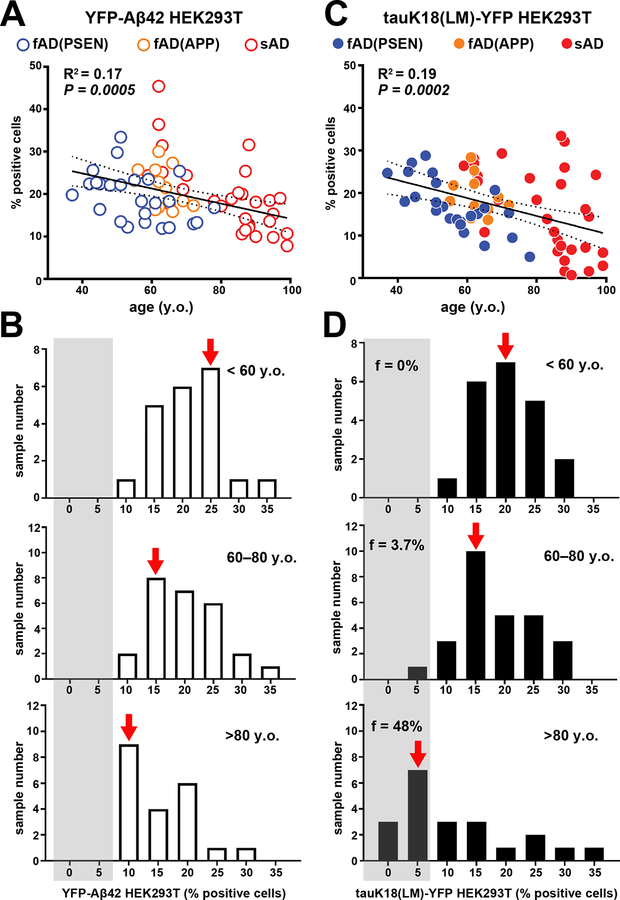
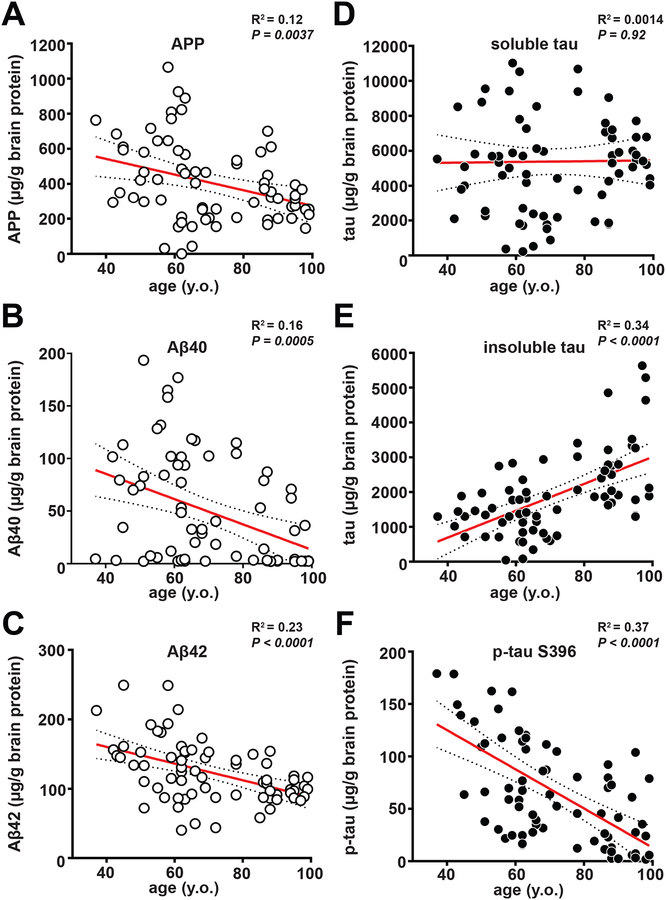
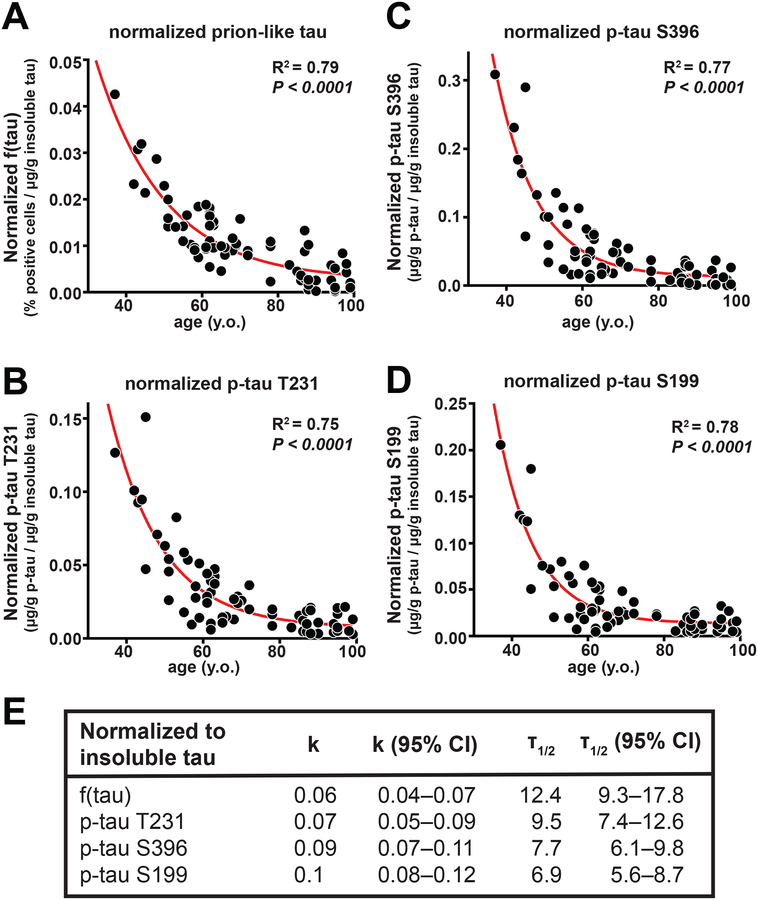
The hallmarks of Alzheimer's disease (AD) are the accumulation of Aβ plaques and neurofibrillary tangles composed of hyperphosphorylated tau. We developed sensitive cellular assays using human embryonic kidney-293T cells to quantify intracellular self-propagating conformers of Aβ in brain samples from patients with AD or other neurodegenerative diseases. Postmortem brain tissue from patients with AD had measurable amounts of pathological Aβ conformers. Individuals over 80 years of age had the lowest amounts of prion-like Aβ and phosphorylated tau. Unexpectedly, the longevity-dependent decrease in self-propagating tau conformers occurred in spite of increasing amounts of total insoluble tau. When corrected for the abundance of insoluble tau, the ability of postmortem AD brain homogenates to induce misfolded tau in the cellular assays showed an exponential decrease with longevity, with a half-life of about one decade over the age range of 37 to 99 years. Thus, our findings demonstrate an inverse correlation between longevity in patients with AD and the abundance of pathological tau conformers. Our cellular assays can be applied to patient selection for clinical studies and the development of new drugs and diagnostics for AD.


Figures

Figure 1.
Figure 1.. Development of YFP-Aβ fusion proteins in HEK-293T cell lines for measuring Aβ aggregates in brains.
The indicated cell lines were developed to measure prion-like activity of preparations consisting of synthetic Aβ peptides and mouse brain-derived extracts based on their abilities to induce fluorescent aggregates which we refer to as puncta. (A) Diagram illustrating the Aβ constructs used in this study (left). Stably transfected HEK293T cells expressing an Aβ-YFP fusion construct underwent lipofectamine-based transduction with synthetic Aβ fibrils (right). (B) Representative confocal images of HEK293T cells expressing Aβ42 fused to YFP at the N-terminus (clone #1), which were treated with PBS (left; control) or exposed to synthetic Aβ40 fibrils (initial monomeric concentration, 1 μM) (right, exposed). The aggregates of Aβ-YFP appear as fluorescent yellow puncta. To measure prion-like activity, we counted the number of puncta-positive cells and expressed this as a percent of the total number of cells in the field of view (% positive cells). Lower panels are higher magnification images of white boxed areas in upper panels. Scale bars: 20 μm (upper panels) or 5 μm (lower panels). (C) HEK293T cells transfected with YFP-Aβ42 were treated with two different types of Aβ ranging from 0.03–100 nM (initial monomeric concentration): synthetic Aβ40 (left) or Aβ purified from TgAPP23 mouse brains (right). Puncta-inducing activity in the HEK293T cells was quantified 2 days after the initial exposure to various Aβ preparations. Data shown are mean ± SEM as determined from four images per well across four wells, and are representative of 3 independent experiments. (D) Cell lines stably expressing four different wildtype (WT) Aβ constructs (shown in panel A) were developed and puncta formation was compared with synthetic Aβ40 and Aβ42 isoforms. Quantification of Aβ in 16 monoclonal cell lines (four randomly chosen clones from each construct; see fig. S2A) was performed 2 days after exposure to increasing concentrations of synthetic Aβ40 or Aβ42 isoforms (1–100 nM) (see fig. S1). Data shown are mean ± SEM as determined from four images per well across four wells, , and are representative of 2 to 3 independent experiments. (E) Cell lines stably expressing four different Aβ40 constructs fused to YFP at the N-terminus (shown in panel A) were developed, and puncta formation was compared after exposure to synthetic Aβ40 and Aβ42 isoforms. Quantification of Aβ in 16 monoclonal cell lines (four randomly chosen clones from each construct; see fig. S2B) was performed two days after exposure to increasing concentrations of synthetic Aβ40 or Aβ42 isoforms (1–100 nM) (see fig. S1). Data shown are mean ± SEM as determined from four images per well across four wells, and are representative of 2 independent experiments.
Figure 2.
Figure 2.. Specificity of the Aβ cellular assays.
Various Tg mouse brain inocula were assayed for their Aβ, tau and α-synuclein prion-like activities. (A) Representative confocal images of HEK293T cells stably expressing YFP-Aβ42 (top row), α-synuclein containing the A53T mutation fused to YFP (α-synA53T-YFP, middle row), or tauK18(LM)-YFP (bottom row) (see materials and methods for construct details). The cells were treated with APP-derived peptides from the brains of TgAPP23 mice (0.1 × PTA sample, left column), or Tgα-Syn*A53T mice (0.1 × PTA sample, middle column), or homozygous Tg0N4Rtau*P301S mice (0.1 × PTA sample, right column). Scale bar represents 20 μm. (B) Quantification of the responses of the YFP-Aβ42, α-synA53T-YFP, and tauK18(LM)-YFP cell lines two days after exposure to increasing concentrations of transgenic mouse brain-derived Aβ (0.01x–0.1x PTA sample; orange to dark red), α-synuclein carrying the A53T mutation (0.01x–0.1x PTA sample; light blue to dark blue), and tau carrying the P301S mutation (0.01×–0.1× PTA sample; light green to dark green). Data shown are mean ± SEM as determined from four images per well across four wells, and are representative of 4 independent experiments.
Figure 3.
Figure 3.. Quantitation of postmortem human brain Aβ and tau in parallel cellular assays.
(A) The prion-like activities of Aβ and tau in postmortem human brain samples from patients with FTLD-tau, AD, CAA and MSA were added to three different HEK293T cell lines expressing: YFP-Aβ42, tauK18(LM)-YFP, or α-synA53T-YFP. (B–D) The prion-like activities of Aβ and tau in human brain tissue samples were quantified using the YFP-Aβ42 and tauK18(LM)-YFP cell lines. The cell lines were exposed to a 0.03x dilution of PTA-precipitated brain homogenates derived from 86 patients with sporadic or familial AD or CAA, 10 aged healthy controls, and 10 patients with FTLD-tau (7 PSP and 3 CBD). Data shown are mean ± SEM as determined from four images per well across four wells per sample. Statistical significance is indicated as *** (P<0.0001) for Aβ puncta-inducing prion-like activity compared to control, or### (P<0.0001) for tau puncta-inducing prion-like activity compared to control. (E) α-Synuclein abundance in brain homogenates was quantified as a percent of α-synA53T-YFP expressing cells positive for α-synuclein puncta. The α-synA53T-YFP cell line was exposed to a 0.03x dilution of PTA-precipitated brain homogenates from all postmortem brain samples. Data shown are mean ± SEM as determined from four images per well across four wells per sample. (F) Correlation analyses between Aβ load (x-axis) and tau load (y-axis). Shown is a summary plot for brain tissue from 75 AD cases (37 sporadic AD, red; 25 familial AD with the PSEN mutation, blue; 13 familial AD with the APP mutation, orange) compared to brain tissue from aged healthy controls (gray) and from patients with CAA (sporadic CAA, purple; familial CAA, pink) or FTLD-tau (PSP/CBD, cyan). Brain tissue from one sporadic AD patient lacked a Braak stage score and had comorbid Lewy body dementia; brain tissue samples from two sporadic AD patients were Braak stage III/IV; all three data points fell well within the range of other close-lying points and thus were not removed. Data representative of 3 independent experiments.
Figure 4.
Figure 4.. Inverse correlation between longevity and self-propagating Aβ and tau activities.
The Aβ and tau prion activity in brain tissue from sporadic and familial AD samples (Braak stage V to VI) was plotted as a function of patient age at death (A): familial AD with the PSEN mutation, blue; familial AD with the APP mutation, orange; sporadic AD, red. Statistical values for correlation, linear regression, and 95% confidence intervals are shown. (B) Histogram of Aβ load for the same data set binned into three age groups: <60 years old (y.o., top); 60–80 years old (y.o., middle); >80 years old (y.o., bottom). (C) Tau load in brain tissue from sporadic and familial AD patients plotted as a function of patient age at death: familial AD with the PSEN mutation, blue; familial AD with the APP mutation, orange; sporadic AD, red. Statistical values for correlation, linear regression, and 95% confidence intervals are shown. (D) Histogram of tau abundance for the same data set binned into three age groups:<60 years old (y.o, top); 60–80 years old (y.o., middle); >80 years old (y.o., bottom). Fraction of total sample number in each age bin with 0%–5% tau-positive cells. The standard deviations of individual data points are similar to those in Figure 1 and are much smaller than the deviation from the regression line, indicating that measurement error did not contribute significantly to the deviations from the trend line. Data representative of 3 independent experiments.
Figure 5.
Figure 5.. Measurement of the expression level of APP, and the amounts of soluble and insoluble Aβ and tau species as a function of the age at death of AD patients.
ELISA was used to measure different proteins in brain samples (Braak stage V to VI) from patients with familial or sporadic AD. The following proteins were measured: (A) APP in the clarified brain homogenate (PBS soluble), (B, C) Aβ40 and Aβ42 (formic acid soluble), respectively, (D) total tau in the clarified brain homogenate (PBS soluble), (E) total tau (formic acid soluble), and (F) phosphorylated-tau (phosphorylated epitope Serine396, formic acid soluble). All data are plotted as a function of patient age at death (y.o., years old). Statistical values for correlation, linear regression, and 95% confidence interval are shown. The measurements were made in duplicate and are much smaller than the deviation from the regression line, indicating that measurement error did not contribute significantly to the deviations from the trend line. Data representative of 1 to 2 independent experiments.
Figure 6.
Figure 6.. The abundance of self-propagating and phosphorylated tau decreased exponentially over six decades in patients with AD.
The specific activity of prion-like tau in AD brain homogenates decreased in parallel with a reduction in hyperphosphorylated tau. (A) Prion-like tau abundance measured in AD brain tissue samples (Braak stage V to VI) was normalized to the adjusted value of insoluble tau as measured by ELISA (see Fig. 5E). Shown are normalized data plotted as a function of AD patient age at death and fitted using an exponential decal model equation (one-phase decay). (B) Phosphorylated-tau (phosphorylated on Threonine 231; p-tauT231) was measured in AD brain samples normalized to the adjusted value of insoluble tau as measured by ELISA (see Fig. 5E). Normalized data were plotted as a function of AD patient age at death and fitted using an exponential decay model equation (one-phase decay). To normalize the data, the prion-like tau values from Fig. 4 or the p-tau concentration from Fig. 5 were divided by concentration of total insoluble tau obtained from the regression line for total tau versus age at death for AD patients shown in Fig. 5E. (C) Phosphorylated-tau (phosphorylated on Serine 396; p-tauS396) was measured in AD brain samples normalized to the adjusted value of insoluble tau as measured by ELISA. (D) Phosphorylated-tau (phosphorylated on Serine 199; p-tauS199) was measured in AD samples normalized to the adjusted value of insoluble tau as measured by ELISA. (E) Statistical values for correlation, decay constant (K), half-life (T), and their respective 95% confidence intervals (CI) are shown.

References

    1. Alzheimer A, Über eigenartige Krankheitsfälle des späteren Alters. Zentralbl. Gesamte Neurol. Psychiatr 4, 356–385 (1911).
    1. Glenner GG, Wong CW, Alzheimer’s disease: Initial report of the purification and characterization of a novel cerebrovascular amyloid protein. Biochem. Biophys. Res. Commun 120, 885–890 (1984). - PubMed
    1. Brion JP, Couck AM, Passareiro E, Flament-Durand J, Neurofibrillary tangles of Alzheimer’s disease: an immunohistochemical study. J. Submicrosc. Cytol 17, 89–96 (1985). - PubMed
    1. Grundke-Iqbal I et al., Abnormal phosphorylation of the microtubule-associated protein (tau) in Alzheimer cytoskeletal pathology. Proc. Natl. Acad. Sci. U.S.A. 83, 4913–4917 (1986). - PMC - PubMed
    1. Kosik KS, Joachim CL, Selkoe DJ, Microtubule-associated protein tau is a major antigenic component of paired helical filaments in Alzheimer disease. Proc. Natl. Acad. Sci. U.S.A 83, 4044–4048 (1986). - PMC - PubMed

Publication types

MeSH terms