. 2019 May 1;10(1):1731.
doi: 10.1038/s41467-019-09683-z.

CXCL4 assembles DNA into liquid crystalline complexes to amplify TLR9-mediated interferon-α production in systemic sclerosis

Affiliations

CXCL4 assembles DNA into liquid crystalline complexes to amplify TLR9-mediated interferon-α production in systemic sclerosis

Roberto Lande et al. Nat Commun. .

Abstract

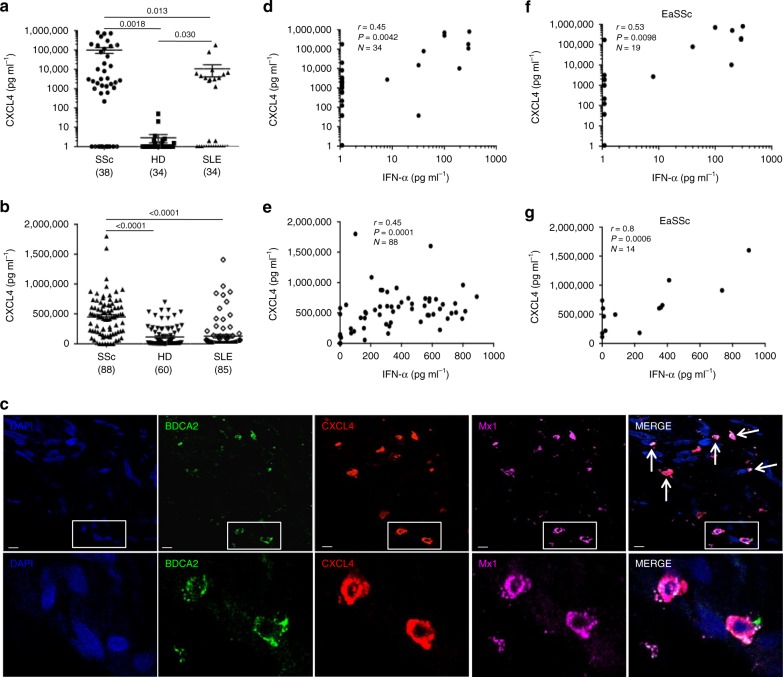
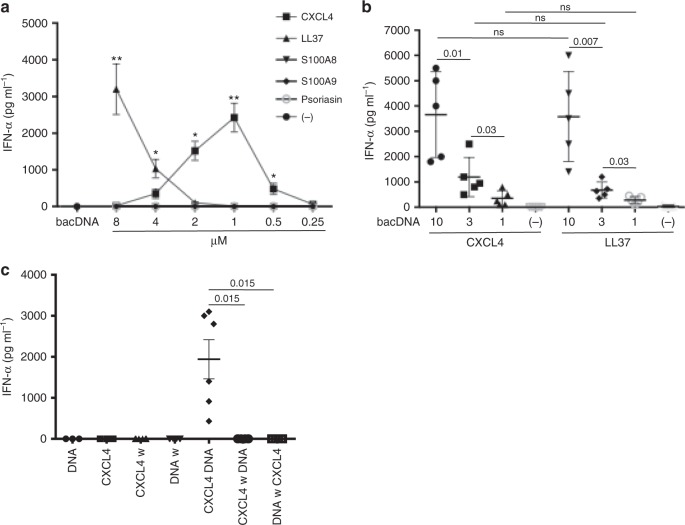
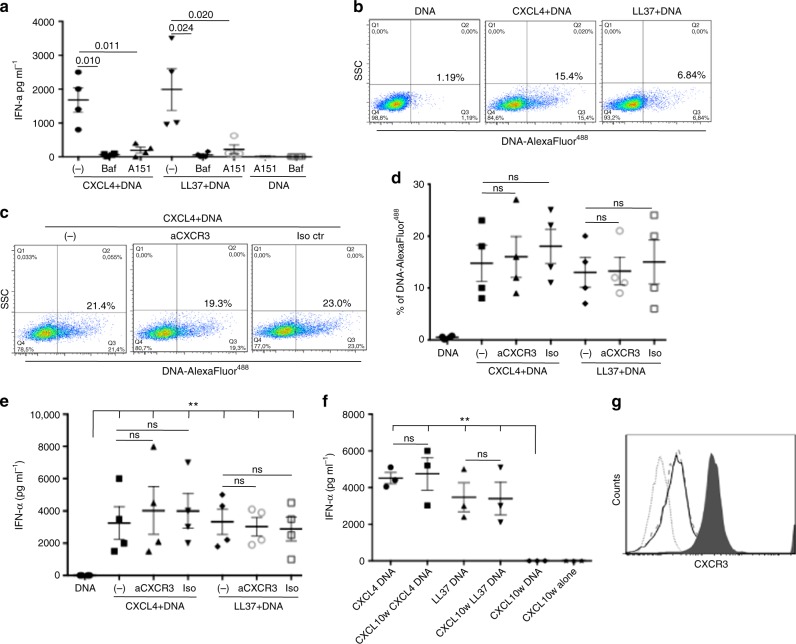
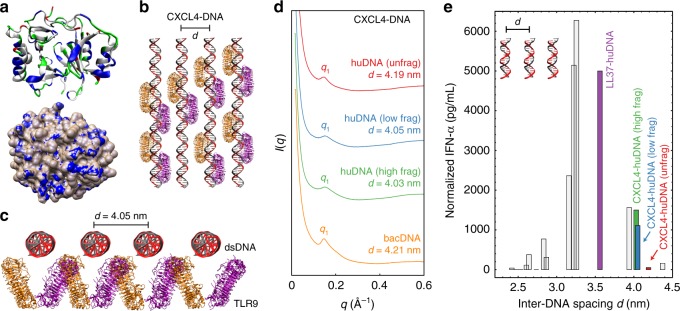
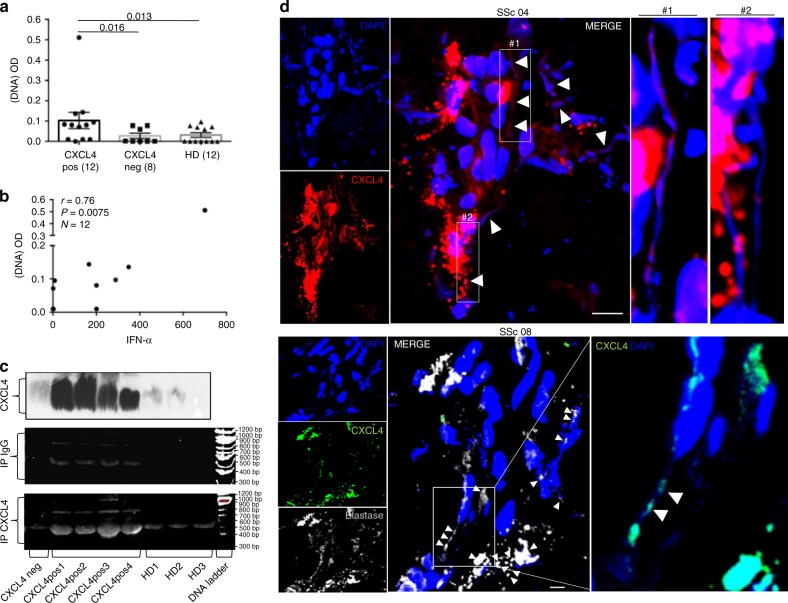
Systemic sclerosis (SSc) is a chronic autoimmune disease characterized by fibrosis and vasculopathy. CXCL4 represents an early serum biomarker of severe SSc and likely contributes to inflammation via chemokine signaling pathways, but the exact role of CXCL4 in SSc pathogenesis is unclear. Here, we elucidate an unanticipated mechanism for CXCL4-mediated immune amplification in SSc, in which CXCL4 organizes "self" and microbial DNA into liquid crystalline immune complexes that amplify TLR9-mediated plasmacytoid dendritic cell (pDC)-hyperactivation and interferon-α production. Surprisingly, this activity does not require CXCR3, the CXCL4 receptor. Importantly, we find that CXCL4-DNA complexes are present in vivo and correlate with type I interferon (IFN-I) in SSc blood, and that CXCL4-positive skin pDCs coexpress IFN-I-related genes. Thus, we establish a direct link between CXCL4 overexpression and the IFN-I-gene signature in SSc and outline a paradigm in which chemokines can drastically modulate innate immune receptors without being direct agonists.


Conflict of interest statement

The authors declare no competing interests.

Figures

Fig. 1
Fig. 1
CXCL4 is overexpressed in SSc and correlates with IFN-I. CXCL4 was measured by ELISA in the plasma of SSc (N = 38) (discovery cohort), HD (N = 34), and SLE (N = 34) (a), and in the sera of SSc patients (N = 88), HD (N = 60), and SLE patients (N = 85) (b). Horizontal bars are the means and vertical bars are the standard errors of the mean (s.e.m.). P-values are calculated with Student’s t test for unpaired samples (two-tailed). c Confocal images of SSc skin stained with DAPI (blue) to color nuclei, anti-BDCA2 (green), anti-Mx1 (magenta), and anti-CXCL4 (red). White arrows indicate co-localization of BDCA2, CXCL4, and Mx1. Upper images show a dermal compartment (objective ×60; bar, 10 µm). Lower images show a detail (inset) of the dermal compartment. One representative experiment of 10 performed with different SSc donors. Amounts of CXCL4 measured in SSc plasma (d, f) or serum (e, g) were correlated to IFN-α level measured by ELISA in the same sera/plasma. Correlation was measured by Pearson’s correlations test. Coefficient of correlation “r”, significance “P”, and sample size “N” are indicated
Fig. 2
Fig. 2
CXCL4 forms complexes with different DNA types and protects DNA from nucleases. a HuDNA or bacDNA (10 μg ml−1) were stained with PicoGreen and mixed with different concentrations of the indicated molecules. Fluorescence emission was measured by a fluorimeter. Data are expressed as percent of fluorescence with respect to the fluorescence of DNA alone (100%). Horizontal bars represent the mean, vertical bars are s.e.m. Results from eight independent experiments performed with either huDNA or bacDNA (four each); *P-values < 0.05 by Student’s t test for paired samples (two-tailed) are calculated with respect to the fluorescence of DNA alone; b 10 μM of the indicated proteins were premixed with 10 μg of fluorochrome-conjugated huDNA. Formation of complexes was visualized by confocal microscopy; no binding resulted in a dark panel. One representative experiment out of four. c HuDNA or bacDNA (10 μg ml−1) were mixed with different doses of the indicated proteins for 20 min in the presence/absence of DNase I (see Methods). Fluorescence was analyzed by PicoGreen assay and percent of DNA protected from degradation calculated with respect to DNA degradation (decrease of picoGreen fluorescence) obtained in the absence of any molecule (DNA alone). Horizontal bars are the mean, vertical bars are s.e.m. Results from six independent experiments performed with huDNA or bacDNA (three each). *P-values < 0.05 by Student’s t test for paired samples (two-tailed) calculated in comparison with degradation of DNA alone
Fig. 3
Fig. 3
CXCL4–DNA complexes activate pDCs to produce IFN-α. a pDCs were stimulated with the indicated doses of CXCL4 or control molecules premixed with bacDNA (10 μg ml−1). IFN-α was measured after 24 h by ELISA. Data are shown as a mean±s.e.m. from five independent experiments. *P-values < 0.05, **P-values < 0.01 by Student’s t test for paired samples (two-tailed) are calculated with respect to IFN-α values obtained after stimulation of pDCs by bacDNA alone. b PDCs were stimulated with complexes made with fixed concentrations of CXCL4 (1 μM) or LL37 (10 μM) and different doses of bacDNA (μg ml−1). IFN-α was measured after 24 h by ELISA. Horizontal bars are the means, vertical bars are the s.e.m., P-values by Student’s t test for paired samples (two-tailed). c PDCs were stimulated with CXCL4 (1 μM)–bacDNA (10 μg ml−1) complexes, or by CXCL4 or DNA alone (same concentration) for 3 h, then cells were extensively washed (w). Subsequently, the pDCs were stimulated with bacDNA or CXCL4 (as above), and IFN-α production was measured by ELISA. Horizontal bars are the means, vertical bars are s.e.m., P-values by Student’s t test for paired samples (one-tailed)
Fig. 4
Fig. 4
Stimulation of pDCs by CXCL4–DNA complexes is sensitive to the degree of DNA fragmentation. a PDCs were stimulated with huDNA unfragmented (−) or huDNA moderately (low) and highly (high) fragmented by sonication (see Methods) in complex with CXCL4 (1 µM) or LL37 (10 µM). IFN-α production was quantified by ELISA after 24 h. Horizontal bars are the mean, vertical bars are s.e.m., P-values from Student’s t test for paired samples (two-tailed). b Two percent agarose gel shows unfragmented (−) and the degree of fragmentation (low and high) of the huDNA preparation used for the functional assays depicted in a
Fig. 5
Fig. 5
Activation of pDCs by CXCL4–DNA is TLR9-dependent and CXCR3-independent. a PDCs were stimulated with CXCL4 (1 μM)–DNA (10 μg  ml−1) or LL37(10 μM)–DNA (10 μg ml−1) complexes in the presence/absence of bafilomycin A (Baf), an inhibitor of endosomal acidification, or A151, a specific inhibitor of TLR9. Horizontal bars represent the mean, vertical bars s.e.m. P-values by Student’s t test for paired samples (one-tailed). b pDCs were treated with CXCL4 (1 μM) or LL37 (10 μM) in complex with 10 μg ml−1 of AlexaFluor 488-conjugated huDNA, or with huDNA alone. DNA entry into pDCs was quantitated by flow cytometry. One representative experiment out of five was performed with huDNA or bacDNA. c pDCs were treated with CXCL4–huDNA complexes in the presence/absence of a blocking anti-CXCR3 or an isotype control antibody and analyzed by flow cytometry. d Cumulative data on huDNA/bacDNA uptake into pDCs quantitated for CXCL4–DNA complexes in the presence/absence of neutralizing anti-CXCR3 (10 μg ml−1) or isotype control antibody as in c. Horizontal bars are the mean, vertical bars s.e.m. Significance by Student’s t test for paired samples (two-tailed). e PDCs were stimulated (bacDNA at 10 µg ml−1) as indicated, in the presence/absence of the blocking anti-CXCR3 (10 µg ml−1) or isotype control antibody (10 µg ml−1) and IFN-α production was measured by ELISA after 24 h. Horizontal and vertical bars represent the mean and s.e.m., respectively. Significance by the Student’s t test for paired samples (two-tailed). f PDCs were pretreated with CXCL10 (10 µg ml−1) for 1 h, washed, and stimulated with CXCL4–bacDNA or LL37–bacDNA complexes. IFN-α production was measured by ELISA after 24 h. Horizontal and vertical bars represent the mean and s.e.m. P-values calculated by Student’s t test for paired samples (two-tailed). g PDC expression of CXCR3 by flow cytometry after no treatment (filled histogram) or 2 -h treatment (and after washing) with anti-CXCR3 blocking antibody (10 µg ml−1) (unfilled histogram) or with CXCL10 (10 µg ml−1) (unfilled dashed histogram). Flow cytometry isotype control is shown as light gray dotted histogram
Fig. 6
Fig. 6
CXCL4 organizes both self-DNA and bacDNA into liquid-crystalline supramolecular complexes at an inter-DNA spacing that facilitates amplified TLR9 activation. a Structure of CXCL4 (PDB ID: 1F9Q) with solvent-exposed putative DNA-binding cationic surface residues in blue and hydrophobic residues in white (top). Uncharged polar residues are shown in green and anionic residues are shown in red. Molecular structures were visualized in visual molecular dynamics (VMD). TLR9 structure (PDB ID: 3WPG) was obtained from previous work. The electrostatic potential map of the CXCL4 surface was calculated in Chimera using the APBS plugin (bottom). Blue corresponds to a positive electrostatic potential and white corresponds to a neutral potential. b Graphical schematic to scale of ordered CXCL4–DNA complexes binding to clustered TLR9. CXCL4 is omitted for clarity. Top–down view and c end-on view of CXCL4-fragmented huDNA complexes binding to TLR9 dimers (orange and purple). CXCL4 organizes huDNA (black–gray) into a liquid-crystalline columnar complex with an average inter-DNA spacing d = 4.05 nm, near the optimal value for intercalative multivalent binding to a clustered array of TLR9 receptors, consistent with elevated levels of IFN-ɑ production. d SAXS data of CXCL4 bound to huDNA and bacDNA: The first peak positions q1 and inter-DNA spacings (d) are indicated. CXCL4 forms liquid-crystalline supramolecular complexes with huDNA and bacDNA, cognate to those formed with LL37 but with a lower degree of DNA ordering (Supplementary Fig. 7). e Plot of TLR9 activation vs. inter-DNA spacing for CXCL4–huDNA complexes. The fragmentation state of huDNA affects the ability of complexes to induce IFN-ɑ production from pDCs. Gray bars derived from previously published data. Relative TLR9 activation levels are consistent with the relative levels of cytokine production predicted from the inter-DNA spacings
Fig. 7
Fig. 7
CXCL4 from SSc blood stimulates pDCs in a DNA-dependent manner. a PDCs were stimulated with SSc plasma alone (SSc, 1:50 dilution) pretreated with 10 µg ml−1 of huDNA (SSc+DNA) or with plasma from HD (same dilution) also pretreated with huDNA (HD+DNA) or untreated (HD), or with huDNA alone (DNA). IFN-α was quantitated by ELISA after 24 h. Horizontal bars are the means, vertical bars are the s.e.m. P-values by Wilcoxon signed-rank test. b PDCs were treated with SSc plasma pretreated with huDNA as in a in the absence or in the presence of a neutralizing anti-CXCL4 antibody (aCXCL4; see Methods), neutralizing anti-CD32 antibody (aCD32), corresponding control (Iso ctr), or irrelevant antibodies (aS100A8), and IFN-α was analyzed after 24 h by ELISA. Data are expressed as percent of inhibition of IFN-α production (using as a reference the amounts of IFN-α obtained after stimulation with SSc plasma pretreated with huDNA). Significance was assessed by Wilcoxon signed-rank test
Fig. 8
Fig. 8
CXCL4–DNA complex detection in vivo. a SSc plasma that was either positive (SSc pos, N = 12) or negative (SSc neg, N = 8) for CXCL4 content and HD plasma (that were all negative for CXCL4 content, N = 12) were plated on 96-well plates coated with a mouse anti-CXCL4 antibody. After washing, levels of CXCL4–DNA complexes were measured by using an anti-dsDNA antibody (see Methods, 1:300 dilution). Results are expressed as optical density (OD). Horizontal bars are the mean, vertical bars are s.e.m., P-values by Mann–Whitney test. b CXCL4–DNA immune complexes of CXCL4-positive patients (measured as in panel a) were plotted against IFN-α plasma levels to assess correlation between the presence of circulating CXCL4–DNA complexes and IFN-α in SSc patients (N = 12). Spearman’s correlation coefficient “r”, significance “P”, and sample size “N”, were indicated. c CXCL4 (upper panel) was immune-precipitated using an anti-CXCL4 antibody from plasma of SSc patients that were negative (SSc neg, N = 1) or positive (SSc pos, N = 4) for CXCL4 content, and from HD plasma (N = 3). The immune-precipitated material was run on a gel (8% acrylamide) and DNA was stained by ethidium bromide. In the middle panel, ethidium bromide staining of the same SSc and HD plasma immune-precipitated for IgG–immune complexes (IP IgG, see Methods); in the lower panel, ethidium bromide staining of plasma immune-precipitated for CXCL4 (IP CXCL4). Results are representative of one experiment of two performed, with different SSc and HD plasma. d LSM images relative to the presence of extracellular traps in skin biopsies from two different SSc patients out of four that show DNA filaments (blue, DAPI), CXCL4 in red (upper panels, patients SSc 04), or in green (lower panels, patient SSc 08), elastase in gray (lower panel) (magnification ×63; bar, 5 µm). CXCL4–DNA complexes are indicated by white arrowheads; high-power images of some of the indicated complexes are provided as insets for both patients. Results from two biopsies of eight analyzed

References

    1. Gabrielli A, Avvedimento EV, Krieg T. Scleroderma. N. Engl. J. Med. 2009;360:1989–2003. - PubMed
    1. Ho YY, Lagares D, Tager AM, Kapoor M. Fibrosis—a lethal component of systemic sclerosis. Nat. Rev. Rheumatol. 2014;10:390–402. - PubMed
    1. van Bon L, et al. Proteome-wide analysis and CXCL4 as a biomarker in systemic sclerosis. N. Engl. J. Med. 2014;370:433–443. - PMC - PubMed
    1. Ah Kioon MD, et al. Plasmacytoid dendritic cells promote systemic sclerosis with a key role for TLR8. Sci. Transl. Med. 2018;10:eaam8458. - PMC - PubMed
    1. Bhattacharyya S, et al. Tenascin-C drives persistence of organ fibrosis. Nat. Commun. 2016;7:11703. - PMC - PubMed

Publication types

MeSH terms