. 2019 May 1;9(1):6785.
doi: 10.1038/s41598-019-43268-6.

Structure and stability of the coral microbiome in space and time

Affiliations

Structure and stability of the coral microbiome in space and time

Courtney M Dunphy et al. Sci Rep. .

Abstract

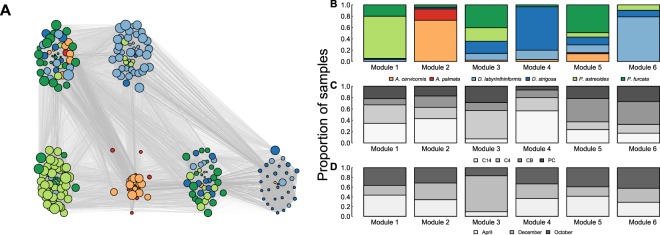
Although it is well established that the microbial communities inhabiting corals perform key functions that promote the health and persistence of their hosts, little is known about their spatial structure and temporal stability. We examined the natural variability of microbial communities associated with six Caribbean coral species from three genera at four reef sites over one year. We identified differences in microbial community composition between coral genera and species that persisted across space and time, suggesting that local host identity likely plays a dominant role in structuring the microbiome. However, we found that microbial community dissimilarity increased with geographical distance, which indicates that regional processes such as dispersal limitation and spatiotemporal environmental heterogeneity also influence microbial community composition. In addition, network analysis revealed that the strength of host identity varied across coral host genera, with species from the genus Acropora having the most influence over their microbial community. Overall, our results demonstrate that despite high levels of microbial diversity, coral species are characterized by signature microbiomes that are stable in both space and time.


Conflict of interest statement

The authors declare no competing interests.

Figures

Figure 1
Figure 1
Prevalence and distribution of microbial classes (A) Porites, (B) Acropora and (C) Diploria and core microbiomes (D) Porites, (E) Acropora and (F) Diporia associated with coral genera Porites, Acropora, and Diploria across all sites and time points. Range bars on the x-axis show all samples collected within each time point.
Figure 2
Figure 2
(A) Non-metric Multidimensional Scaling (nMDS) analysis based on Bray-Curtis dissimilarity between the bacterial communities of the coral samples. Labels: species and time; Ellipses for genera and site. (B) Mean (+/−s.e.) Bray-Curtis dissimilarity of microbial communities associated with each coral genus as a function of the geographical distance that separates them. The red trend line represents the significant positive relationship between Bray-Curtis dissimilarity and geographical distance obtained via ANCOVA (p-value = 0.0009). Both Bray-Curtis dissimilarity and geographical distance were log-transformed prior to conducting ANCOVA.
Figure 3
Figure 3
Simper analysis of top 10 represented microbial classes (A) Host, (B) Site and (C) Time along with their associated radar plots comparing microbial community representation for all groups within each factor (D) Host, (E) Site and (F) Time. All pairwise comparisons involving the host are at the level of coral genus. Asterisks indicate significance for within bar comparisons at the α = 0.05 level based on sequential Bonferroni correction.
Figure 4
Figure 4
(A) Coral microbiome network based on all coral species, sites and times exhibits 6 distinct modules based on microbiome differences across coral samples. (BD) Proportion of samples from each (B) coral species, (C) site and (D) time represented in each module. Nodes in the network represent the color-coded coral species each sample is associated with. Node size is proportional to its eigen centrality value.
Figure 5
Figure 5
Mean eigencentrality for (A) coral species, (B) coral genus, (C) site, and (D) time. Labels indicate which bars are significantly different from one another at the α = 0.05 level based on sequential Bonferroni correction.

References

    1. Stat M, Carter D, Hoegh-Guldberg O. The evolutionary history of Symbiodinium and scleractinian hosts—symbiosis, diversity, and the effect of climate change. Perspect. Plant Ecol. Evol. Syst. 2006;8:23–43. doi: 10.1016/j.ppees.2006.04.001. - DOI
    1. Bourne DG, et al. Microbial disease and the coral holobiont. Trends Microbiol. 2009;17:554–562. doi: 10.1016/j.tim.2009.09.004. - DOI - PubMed
    1. Sweet MJ, Croquer A, Bythell JC. Bacterial assemblages differ between compartments within the coral holobiont. Coral Reefs. 2011;30:39–52. doi: 10.1007/s00338-010-0695-1. - DOI
    1. Rohwer F, Seguritan V, Azam F, Knowlton N. Diversity and distribution of coral-associated bacteria. Mar. Ecol. Prog. Ser. 2002;243:1–10. doi: 10.3354/meps243001. - DOI
    1. Rosenberg E, Koren O, Reshef L, Efrony R, Zilber-Rosenberg I. The role of microorganisms in coral health, disease and evolution. Nat. Rev. Microbiol. 2007;5:355–362. doi: 10.1038/nrmicro1635. - DOI - PubMed

Publication types