. 2019 May;569(7755):265-269.
doi: 10.1038/s41586-019-1165-8. Epub 2019 May 1.

Arabidopsis FLL2 promotes liquid-liquid phase separation of polyadenylation complexes

Affiliations

Arabidopsis FLL2 promotes liquid-liquid phase separation of polyadenylation complexes

Xiaofeng Fang et al. Nature. 2019 May.

Abstract

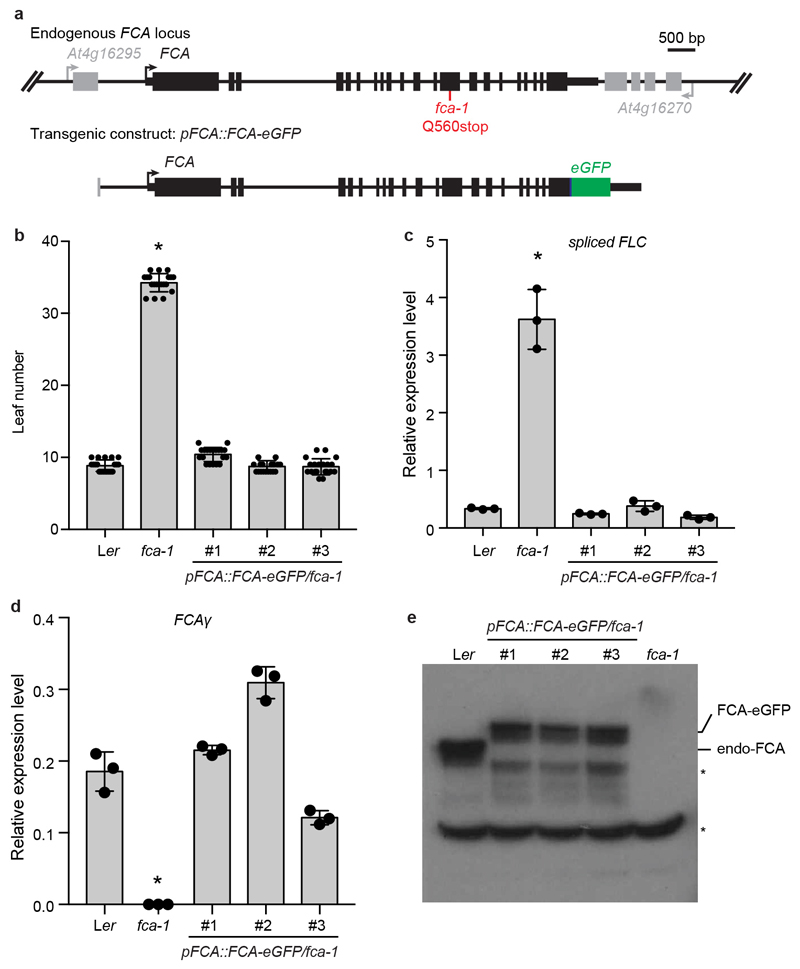
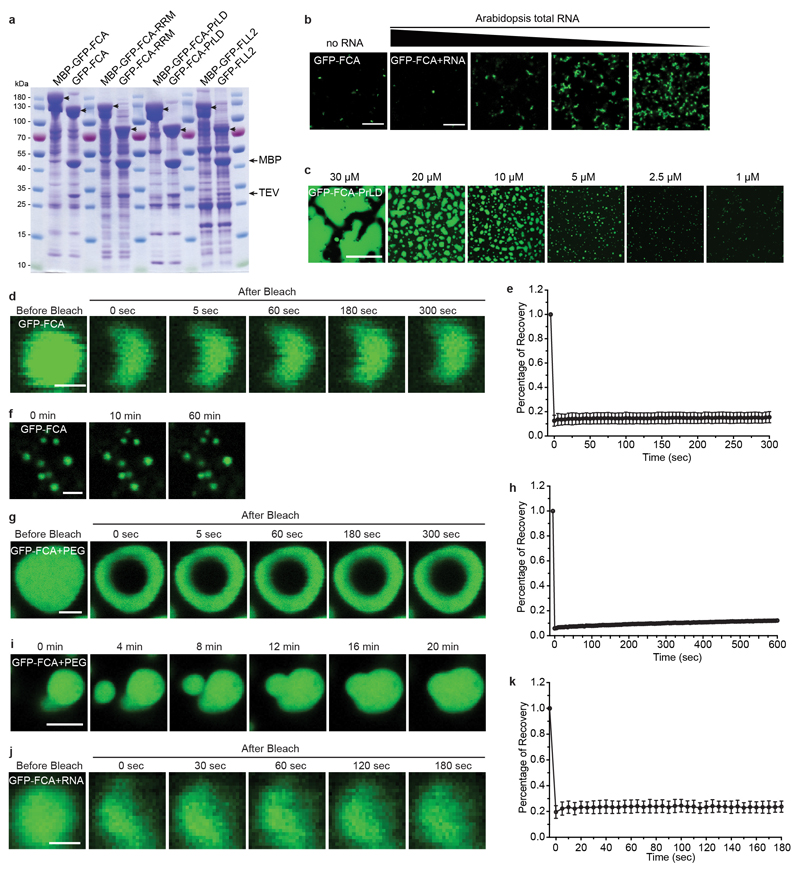
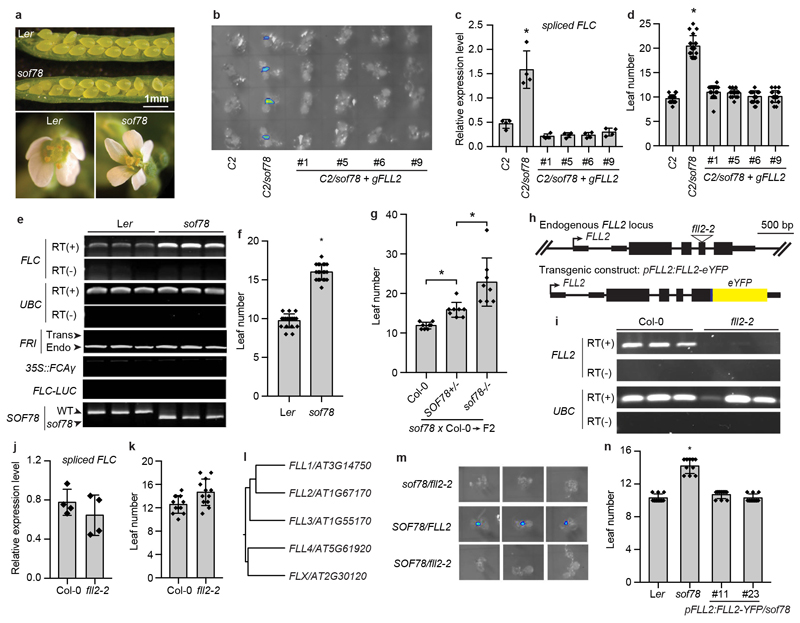
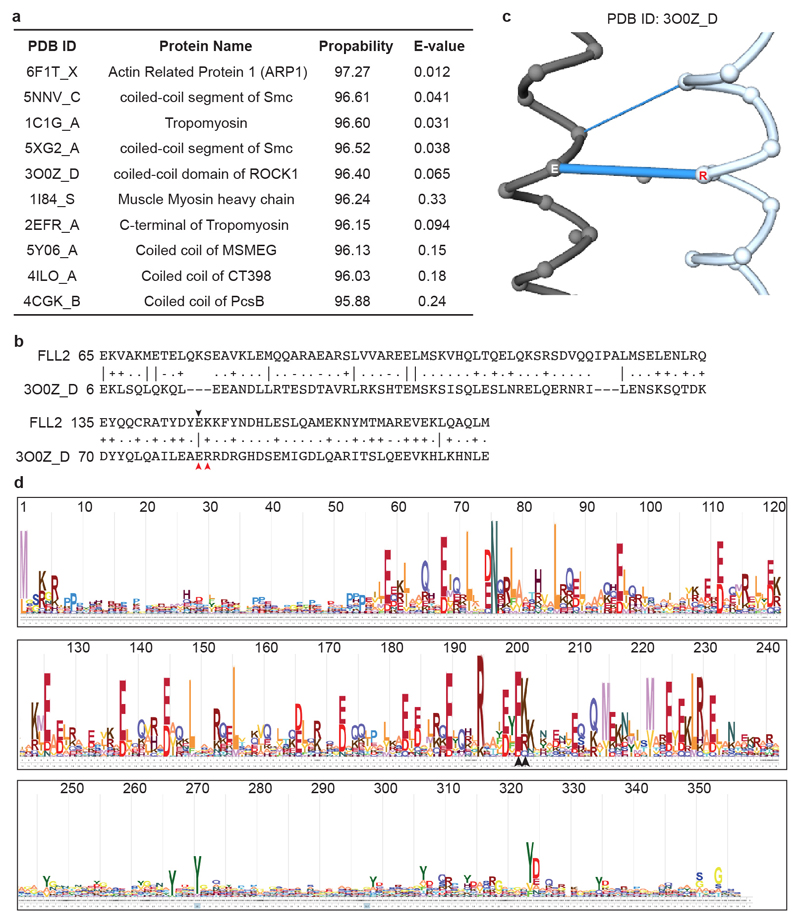
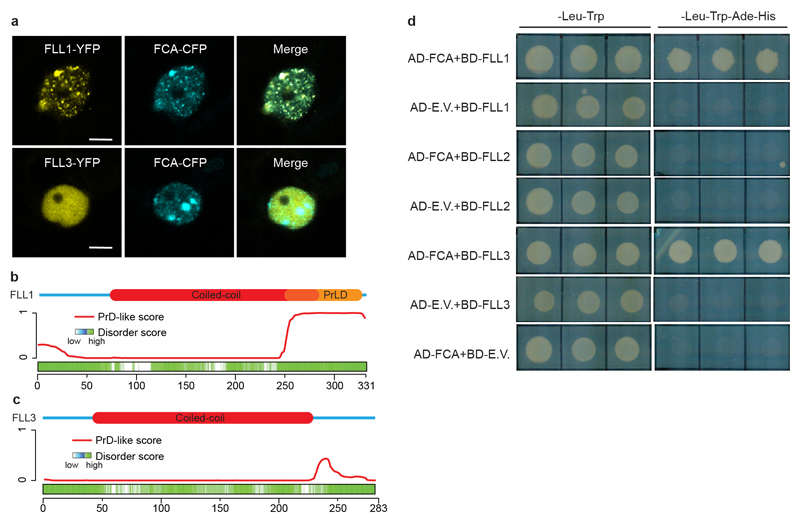
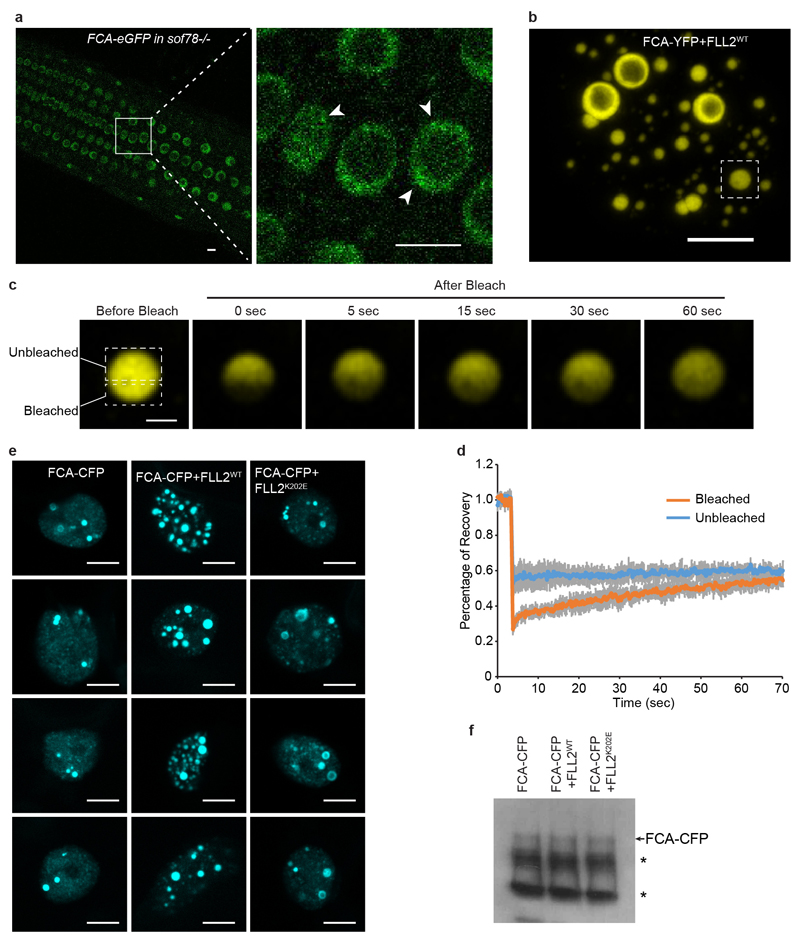
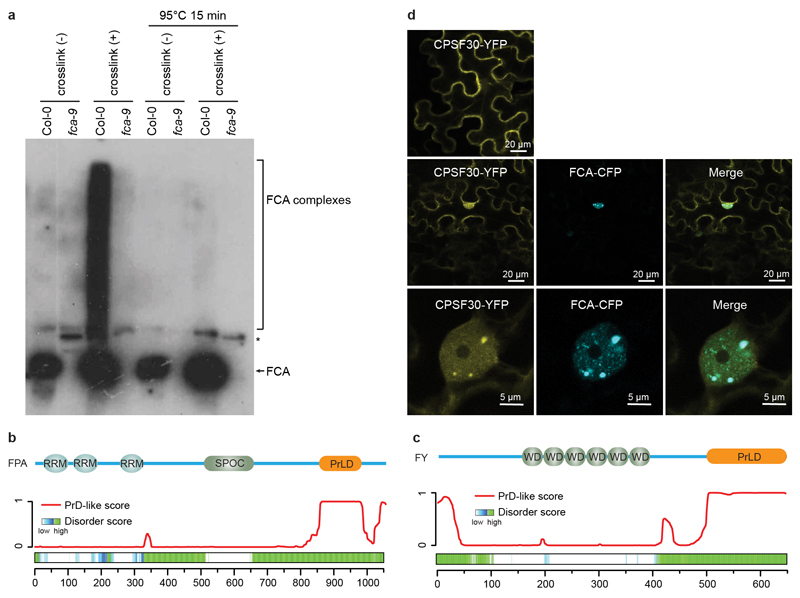
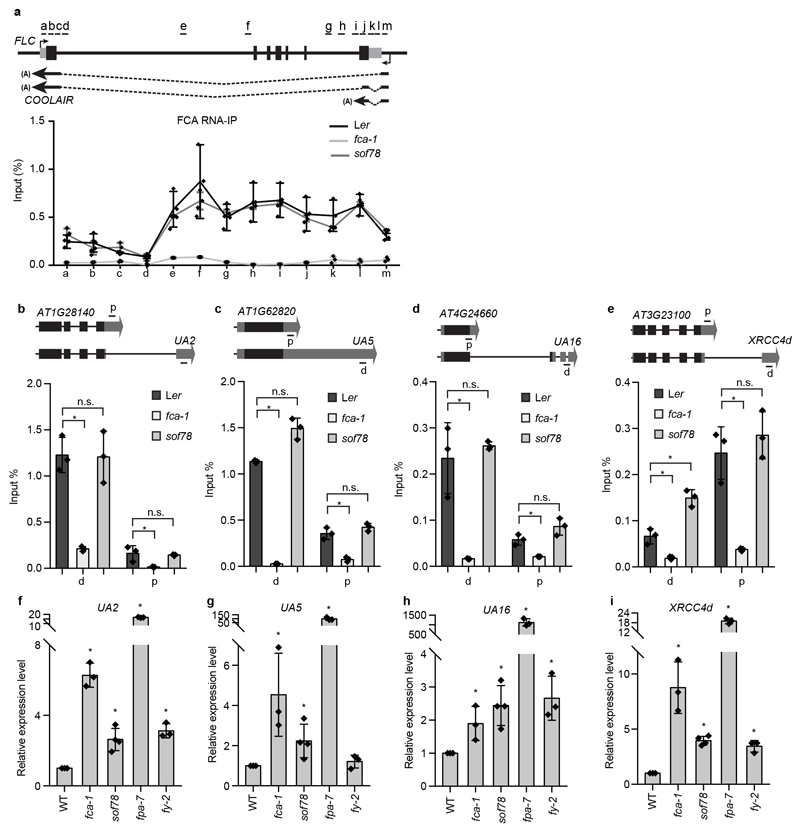
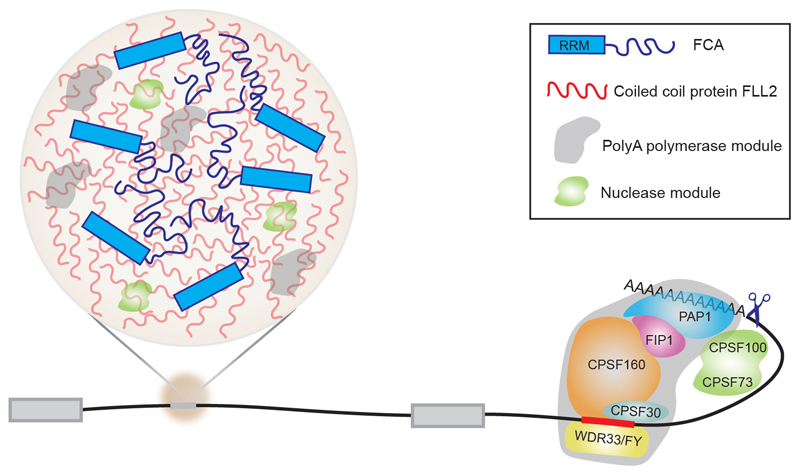
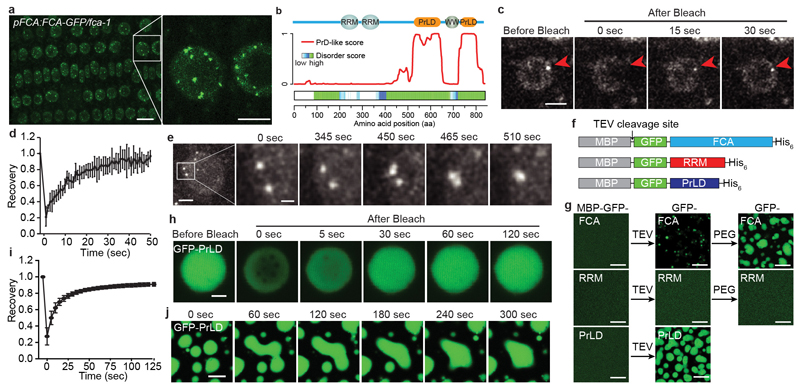
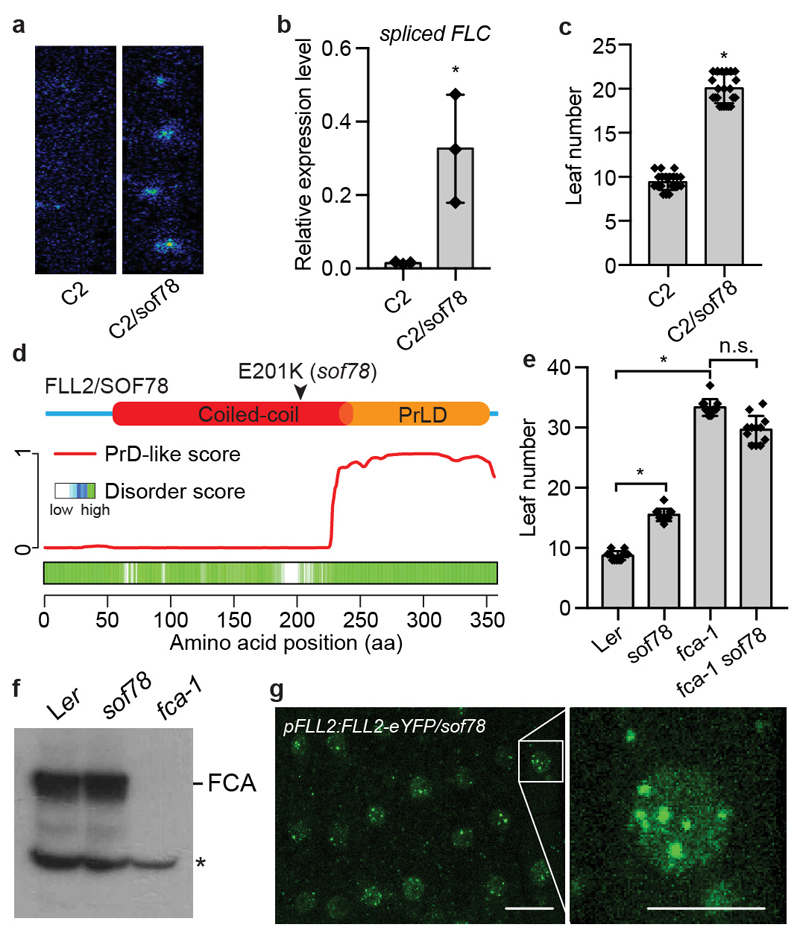
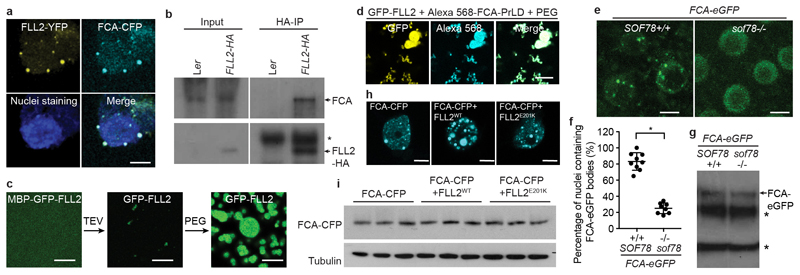
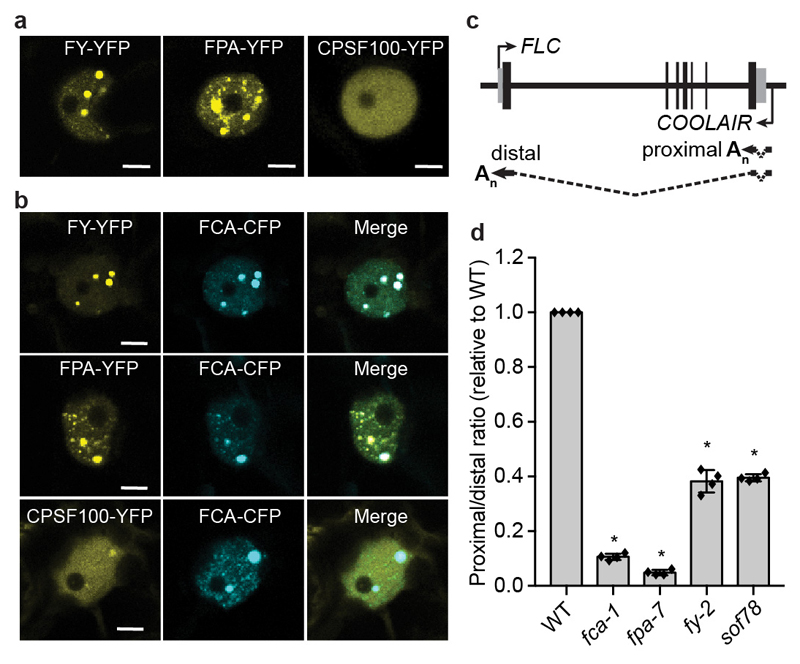
An important component of cellular biochemistry is the concentration of proteins and nucleic acids in non-membranous compartments1,2. These biomolecular condensates are formed from processes that include liquid-liquid phase separation. The multivalent interactions necessary for liquid-liquid phase separation have been extensively studied in vitro1,3. However, the regulation of this process in vivo is poorly understood. Here we identify an in vivo regulator of liquid-liquid phase separation through a genetic screen targeting factors required for Arabidopsis RNA-binding protein FCA function. FCA contains prion-like domains that phase-separate in vitro, and exhibits behaviour in vivo that is consistent with phase separation. The mutant screen identified a functional requirement for FLL2, a coiled-coil protein, in the formation of FCA nuclear bodies. FCA reduces transcriptional read-through by promoting proximal polyadenylation at many sites in the Arabidopsis genome3,4. FLL2 was required to promote this proximal polyadenylation, but not the binding of FCA to target RNA. Ectopic expression of FLL2 increased the size and number of FCA nuclear bodies. Crosslinking with formaldehyde captured in vivo interactions between FLL2, FCA and the polymerase and nuclease modules of the RNA 3'-end processing machinery. These 3' RNA-processing components colocalized with FCA in the nuclear bodies in vivo, which indicates that FCA nuclear bodies compartmentalize 3'-end processing factors to enhance polyadenylation at specific sites. Our findings show that coiled-coil proteins can promote liquid-liquid phase separation, which expands our understanding of the principles that govern the in vivo dynamics of liquid-like bodies.


Conflict of interest statement

Competing interests

The authors declare no competing interests.

Figures

Extended Data Fig. 1
Extended Data Fig. 1. Transgenic FCA-eGFP is functionally equivalent to endogenous FCA.
a, Top, genomic FCA locus indicating upstream and downstream genes (grey) and position of fca-1 mutation. Bottom, illustration of transgenic FCA-eGFP construct. Thick black boxes indicate exons, thin black boxes indicate UTRs and black lines indicate introns. b, Flowering time of indicated plants grown in a long day photoperiod. Data are presented as the mean ± SD (n = 20). Asterisk indicates a significant difference (P = 0.0001, two-tailed t test). c, Expression of spliced FLC relative to UBC in the indicated plants. Data are presented as the mean ± SD (n = 3). Asterisk indicates a significant difference (P = 0.0004, two-tailed t test). d, Expression of spliced FCAγ relative to UBC in the indicated plants. Data are presented as the mean ± SD (n = 3). Asterisk indicates a significant difference (P = 0.0003, two-tailed t test). e, The protein levels of FCA and FCA-GFP in the indicated plants as determined by western blot. Asterisks indicate non-specific signals. Data are representative of two independent experiments. For gel source data, see Supplementary Figure 1.
Extended Data Fig. 2
Extended Data Fig. 2. FCA undergoes phase separation in vitro.
a, Coomassie staining of indicated protein samples before and after TEV cleavage of the MBP tag. Arrowheads indicate the proteins labelled on top of the gel. Data are representative of three independent experiments. b, Phase separation of GFP-FCA in the presence of Arabidopsis total RNA was tested using 3.13 μM of GFP-FCA and RNA ranging from 0.09 to 1.3 μg/ml. Scale bar, 10 μm. Data are representative of three independent experiments. c, In vitro phase separation assay of GFP-FCA-PrLD at different protein concentrations. Scale bar, 50 μm. Data are representative of three independent experiments. d, FRAP of GFP-FCA puncta. Time 0 indicates the time of the photobleaching pulse. Scale bar, 1 μm. Data are representative of eight independent experiments. e, Plot showing the time course of the recovery after photobleaching GFP-FCA puncta. Data are presented as the mean ± SD (n = 8). f, GFP-FCA puncta neither grow in size, nor coalesce with each other. Time points are indicated in minutes above. Scale bar, 10 μm. Data are representative of three independent experiments. g, FRAP of GFP-FCA puncta in the presence of 10% (w/v) PEG. Time 0 indicates the time of the photobleaching pulse. Scale bar, 2 μm. Data are representative of nine independent experiments. h, Plot showing the time course of the recovery after photobleaching GFP-FCA puncta in the presence of 10% (w/v) PEG. Data are presented as the mean ± SD (n = 9). i, Fusion of GFP-FCA puncta in the presence of 10% (w/v) PEG. Time points are indicated in minutes above. Scale bar, 2 μm. Data are representative of three independent experiments. j, FRAP of GFP-FCA puncta in the presence of Arabidopsis total RNA. Time 0 indicates the time of the photobleaching pulse. Scale bar, 1 μm. Data are representative of eight independent experiments. k, Plot showing the time course of the recovery after photobleaching GFP-FCA puncta in the presence of Arabidopsis total RNA. Data are presented as the mean ± SD (n = 8).
Extended Data Fig. 3
Extended Data Fig. 3. Characterization of the sof78 mutation.
a, The seed development (top) and the petal number (bottom) of sof78 mutant and Ler wild type. Photos are representative of at least five independent experiments. b, FLC-LUC bioluminescence signal of indicated plants taken by CCD camera. Data are representative of three independent experiments. c, Expression of spliced FLC relative to UBC in the indicated genotypes. Data are presented as the mean ± SD (n = 4). Asterisk indicates a significant difference (P = 0.0014, two-tailed t test). d, Flowering time of indicated plants grown in long day photoperiod. Data are presented as the mean ± SD (n = 20). Asterisk indicates a significant difference (P < 0.0001, two-tailed t test). e, RT-PCR detection of FLC and UBC transcripts or PCR amplification of indicated fragments from genomic DNA. Data are representative of three independent experiments. f, Flowering time of indicated plants grown in long day photoperiod. Data are presented as the mean ± SD (n = 20). Asterisk indicates a significant difference (P < 0.0001, two-tailed t test). g, Flowering time of indicated plants grown in long day photoperiod. Data are presented as the mean ± SD (n = 8). Asterisks indicate significant differences (P ≤ 0.0077, two-tailed t test). h, Genomic FLL2 locus indicating upstream and downstream genes and positions of sof78 mutation and fll2-2 T-DNA insertion (top); illustration of transgenic FLL2-eYFP construct (bottom). Thick black boxes indicate exons, thin black boxes indicate UTRs and black lines indicate introns. i, RT-PCR detection of FLL2 and UBC transcripts in Col-0 and fll2-2. Data are representative of three independent experiments. j, Expression of spliced FLC relative to UBC in the indicated genotypes. Data are presented as the mean ± SD (n = 4). k, Flowering time of indicated plants grown in long day photoperiod. Data are presented as the mean ± SD (n = 12). l, Phylogenetic tree of FLX family proteins. The tree was drawn by PHYLIP program. Bootstrap values from 1000 trials are shown. m, FLC-LUC bioluminescence signal of indicated plants taken by CCD camera. Data are representative of three independent experiments. n, Flowering time of indicated plants grown in long day photoperiod. Data are presented as the mean ± SD (n = 10). Asterisk indicates a significant difference (P < 0.0001, two-tailed t test).
Extended Data Fig. 4
Extended Data Fig. 4. FLL2 encodes a coiled coil domain protein.
a, A fragment (55-243 aa) of FLL2 protein was blasted against the PDB_mmCIF70_5_Oct database using HHpred of MPI Bioinformatics Toolkit (https://toolkit.tuebingen.mpg.de/#/). Top 10 hits were shown. When the probability is larger than 95%, the homology is nearly certain. b, The alignment between coiled-coil domains of FLL2 and human ROCK1. Black arrowhead indicates the amino acid Glu mutated in sof78. c, A salt bridge was formed between E and R (indicated by red arrowheads in b) on two molecules of ROCK1. Data was obtained from Protein Contacts Atlas (http://www.mrc-lmb.cam. ac.uk/pca/). d, Plot showing the sequence conservation of FLL2. Analysis was done using the HmmerWeb server (https://www.ebi.ac.uk/Tools/hmmer/) by searching with Arabidopsis thaliana FLL2 within the taxonomy of plants “Ensembl genomes plants”, yielding 520 homologs within Streptophyta. The HMM logo shows the conservation for each amino acid for the 520 homologs. Black arrowheads indicate two amino acids predicted to form a salt bridge.
Extended Data Fig. 5
Extended Data Fig. 5. Characterization of FLL1 and FLL3.
a, Colocalization of FLL1-YFP and FLL3-YFP with FCA-CFP in tobacco leaf nuclei. Scale bars, 5 μm. Data are representative of three independent experiments. b, c, Top, protein domain structures of FLL1 and FLL3. Bottom, predictions of prion-like domains and disordered regions by PLAAC and D2P2 algorithms, respectively. d, Interactions of FCA with FLLs in yeast two-hybrid assay. Combinations of constructs were transformed into yeast AH109 strain and assayed on stringent medium. Three independent colonies were tested. E.V., empty vector. Data are representative of three independent experiments.
Extended Data Fig. 6
Extended Data Fig. 6. FLL2 promotes the formation of FCA nuclear bodies.
a, An example image showing the FCA-eGFP nuclear bodies in sof78 mutant background. 7-day-old Arabidopsis root tip was observed under confocal microscope. Region indicated in left panel was zoomed-in as right panel. Scale bars, 5 μm. Image is representative of eight independent experiments. b, A tobacco nucleus over-expressing FCA-YFP and FLL2. Scale bar, 5 μm. Data are representative of six independent experiments. c, Half-bleach of FCA-YFP body indicated in (b). Time 0 indicates the time of the photobleaching pulse. Scale bar, 1 μm. Data are representative of six independent experiments. d, Plot showing the time course of the recovery after photobleaching FCA body. Data are presented as the mean ± SD (n = 6). e, The effect of FLL2 overexpression on the pattern of FCA-CFP nuclear bodies assayed in tobacco leaf nuclei. Scale bars, 5 μm. Data are representative of three independent experiments. f, The protein level of FCA-CFP in indicated samples as determined by western blot. Asterisks indicate non-specific signal. Data are representative of three independent experiments. For gel source data, see Supplementary Figure 1.
Extended Data Fig. 7
Extended Data Fig. 7. Analysis of FCA, FPA, FY and CPSF30.
a, In vivo formaldehyde crosslinking gives much larger heterogenous FCA complexes. Nuclear extracts were prepared from crosslinked or non-crosslinked plants, half of the extracts were mixed with NuPAGE LDS Sample Buffer and boiled at 70°C, the other half extracts were reverse-crosslinked by heating at 95°C. Samples were analysed by western blot using FCA antibody. Data are representative of two independent experiments. For gel source data, see Supplementary Figure 1. b, c, Top, the annotated functional domains of FPA (a) and FY (b). Bottom, predictions of prion-like domains and disordered regions by PLAAC and D2P2 algorithms, respectively. d, The colocalization of CPSF30-YFP with FCA-CFP. CPSF30-YFP alone (top) or together with FCA-CFP (middle and bottom) are expressed in tobacco leaves. Images are representative of three independent experiments. Scale bars, top and middle, 20 μm; bottom, 5 μm.
Extended Data Fig. 8
Extended Data Fig. 8. Effect of sof78 mutation on the binding of FCA to the nascent transcripts of COOLAIR and UAs and proximal polyadenylation of UAs.
a-e, RNA-IP and qPCR analysis of FCA enrichment on the transcripts of COOLAIR (a), AT1G28140, UA2 (b), AT1G62820, UA5 (c), AT4G24660, UA16 (d) and AT3G23100, XRCC4d (e). Gene structures were shown at top. Data are presented as the mean ± SD (n = 3). Asterisks indicate significant differences (P ≤ 0.0381, two-tailed t test). Short black lines indicate positions of primers used for qPCR amplification. f-i, The expression levels of distally polyadenylated isoforms of UA2 (f), UA5 (g), UA16 (h) and XRCC4d (i) in the indicated plants relative to wild type. Data are presented as the mean ± SD (n = 3). Asterisks indicate significant differences (P ≤ 0.0099, two-tailed t test).
Extended Data Fig. 9
Extended Data Fig. 9. A working model for the role of the coiled coil protein FLL2 to promote nuclear bodies important for polyadenylation at specific sites.
At efficient polyA sites, the cleavage and polyadenylation specificity factor (CPSF) complex specifically recognizes the cis-acting motif upstream of the cleavage site, catalyzes pre-mRNA cleavage, and recruits polyA polymerase to initiate polyadenylation. At other sites, phase-separated FCA droplets compartmentalize 3’ end processing factors to enhance polyadenylation.
Fig. 1
Fig. 1. FCA phase separates in vitro and exhibits behaviour in vivo consistent with phase separation.
a, Fluorescence microscopy of Arabidopsis root tip nuclei expressing FCA-eGFP. Maximum projections of Z-stacks spanning the entire width of a nucleus were applied. Scale bars, left 10 μm, right 5 μm. Data are representative of five independent experiments. b, Top, protein domain structure of FCA. Bottom, predictions of prion-like domains and disordered regions by PLAAC and D2P2 algorithms, respectively. c, FRAP of FCA nuclear bodies. Time 0 indicates the time of the photobleaching pulse. Scale bar, 5 μm. Data are representative of seven independent experiments. d, Plot showing the time course of the recovery after photobleaching FCA nuclear bodies. Data are presented as the mean ± SD (n = 7). e, Fluorescence time-lapse microscopy of Arabidopsis root tip nuclei expressing FCA-eGFP. Two fusing bodies are zoomed-in. Scale bars, left 2 μm, right 0.5 μm. Data are representative of three independent experiments. f, Schematic depiction of protein fusions used for in vitro phase separation assay. g, In vitro phase separation assay of 10 μM GFP-FCA full-length and truncated proteins. Scale bars, 10 μm. Data are representative of three independent experiments. h, FRAP of GFP-FCA-PrLD droplets. Time 0 indicates the time of the photobleaching pulse. Scale bar, 2 μm. Data are representative of twelve independent experiments. i, Plot showing the time course of the recovery after photobleaching GFP-FCA-PrLD droplets. Data are presented as the mean ± SD (n = 12). j, Fusion of GFP-FCA-PrLD droplets. Data are representative of three independent experiments.
Fig. 2
Fig. 2. The coiled coil domain protein FLL2 is required for the function of FCA.
a, FLC-LUC bioluminescence signal of indicated plants taken by CCD camera. Data are representative of three independent experiments. b, Expression of spliced FLC relative to UBC in the indicated plants. Data are presented as the mean ± SD (n = 3). Asterisk indicates a significant difference (P = 0.0214, two-tailed t test). c, Flowering time of indicated plants (assayed as total leaf number, produced by the apical meristem before it switched to producing flowers) grown in a long day photoperiod. Data are presented as the mean ± SD (n = 20). Asterisk indicates a significant difference (P < 0.0001, two-tailed t test). d, Top, protein domain structure of FLL2. Bottom, predictions of prion-like domains and disordered regions by PLAAC and D2P2 algorithms, respectively. e, Flowering time of indicated plants grown in a long day photoperiod. Data are presented as the mean ± SD (n = 12). Asterisks indicate significant differences between the indicated plants (P < 0.0001, two-tailed t test). n.s., not significant. f, The protein level of FCA in the indicated plants as determined by western blot. Asterisk indicates non-specific signal. Data are representative of two independent experiments. For gel source data, see Supplementary Figure 1. g, Fluorescence microscopy of Arabidopsis root tip nuclei expressing FLL2-eYFP. Maximum projections of Z-stacks spanning the entire width of the nucleus were applied. Scale bars, left 10 μm, right 5 μm. Data are representative of three independent experiments.
Fig. 3
Fig. 3. FLL2 promotes the phase separation of FCA to form nuclear bodies.
a, Colocalization of FLL2-YFP with FCA-CFP in Arabidopsis cultured cell nuclei. Scale bar, 5 μm. Images are representative of three independent experiments. b, Co-IP in stable transgenic plants after formaldehyde crosslinking to detect the association of FLL2-HA with FCA. Asterisk indicates non-specific signal. Data are representative of two independent experiments. For gel source data, see Supplementary Figure 1. c, In vitro phase separation assay of 10 μM GFP-FLL2. Scale bars, 10 μm. Data are representative of three independent experiments. d, Co-separation of FCA-PrLD with GFP-FLL2. Alexa Fluor 568 labelled 0.5 μM FCA-PrLD preferentially partitioned into GFP-FLL2 droplets. Scale bar, 10 μm. Data are representative of three independent experiments. e, Representative fluorescence microscopic images of FCA-GFP nuclear bodies in wildtype and sof78 mutant backgrounds. For each image, maximum projections of Z-stacks spanning the entire width of the nucleus was applied. Scale bars, 5 μm. Data are representative of eight independent experiments. f, Percentage of nuclei containing FCA-GFP nuclear bodies in wildtype and sof78 mutant backgrounds. Data are presented as the mean ± SD (n = 8). Asterisk indicates a significant difference (P < 0.0001, two-tailed t test). g, The protein level of FCA-GFP in wildtype and sof78 mutant backgrounds as determined by western blot. Asterisks indicate non-specific signals. Data are representative of three independent experiments. For gel source data, see Supplementary Figure 1. h, The effect of FLL2 overexpression on the pattern of FCA-CFP nuclear bodies assayed in tobacco leaf nuclei. Images are representative of three independent experiments. Scale bars, 5 μm. i, The protein level of FCA-CFP in indicated samples as determined by western blot. Data are representative of three independent experiments. For gel source data, see Supplementary Figure 1.
Fig. 4
Fig. 4. FCA and FLL2 associate with 3’ processing factors and are important for polyadenylation at specific sites.
a, Fluorescence microscopy of tobacco leaf nuclei expressing indicated proteins. Images are representative of three independent experiments. Scale bars, 5 μm. b, Colocalization of FY-YFP, FPA-YFP and CPSF100-YFP with FCA-CFP in tobacco leaf nuclei. Images are representative of three independent experiments. Scale bars, 5 μm. c, Schematic representation of COOLAIR transcripts from the FLC locus. Black rectangles denote exons and dashed lines denote introns. d, The ratio of proximal to distal isoforms of COOLAIR transcripts in the indicated plants relative to wild type. Data are presented as the mean ± SD (n = 4). Asterisks indicate significant differences (P < 0.0001, two-tailed t test).

References

    1. Banani SF, Lee HO, Hyman AA, Rosen MK. Biomolecular condensates: organizers of cellular biochemistry. Nat Rev Mol Cell Biol. 2017;18:285–298. doi: 10.1038/nrm.2017.7. - DOI - PMC - PubMed
    1. Shin Y, Brangwynne CP. Liquid phase condensation in cell physiology and disease. Science. 2017;357 doi: 10.1126/science.aaf4382. - DOI - PubMed
    1. Li P, et al. Phase transitions in the assembly of multivalent signalling proteins. Nature. 2012;483:336–340. doi: 10.1038/nature10879. - DOI - PMC - PubMed
    1. Sonmez C, et al. RNA 3' processing functions of Arabidopsis FCA and FPA limit intergenic transcription. Proc Natl Acad Sci U S A. 2011;108:8508–8513. doi: 10.1073/pnas.1105334108. - DOI - PMC - PubMed
    1. Whittaker C, Dean C. The FLC Locus: A Platform for Discoveries in Epigenetics and Adaptation. Annu Rev Cell Dev Biol. 2017;33:555–575. doi: 10.1146/annurev-cellbio-100616-060546. - DOI - PubMed

Publication types

MeSH terms