Comparative Study
. 2019 Aug;572(7767):67-73.
doi: 10.1038/s41586-019-1158-7. Epub 2019 May 1.

Childhood cerebellar tumours mirror conserved fetal transcriptional programs

Affiliations
Comparative Study

Childhood cerebellar tumours mirror conserved fetal transcriptional programs

Maria C Vladoiu et al. Nature. 2019 Aug.

Abstract

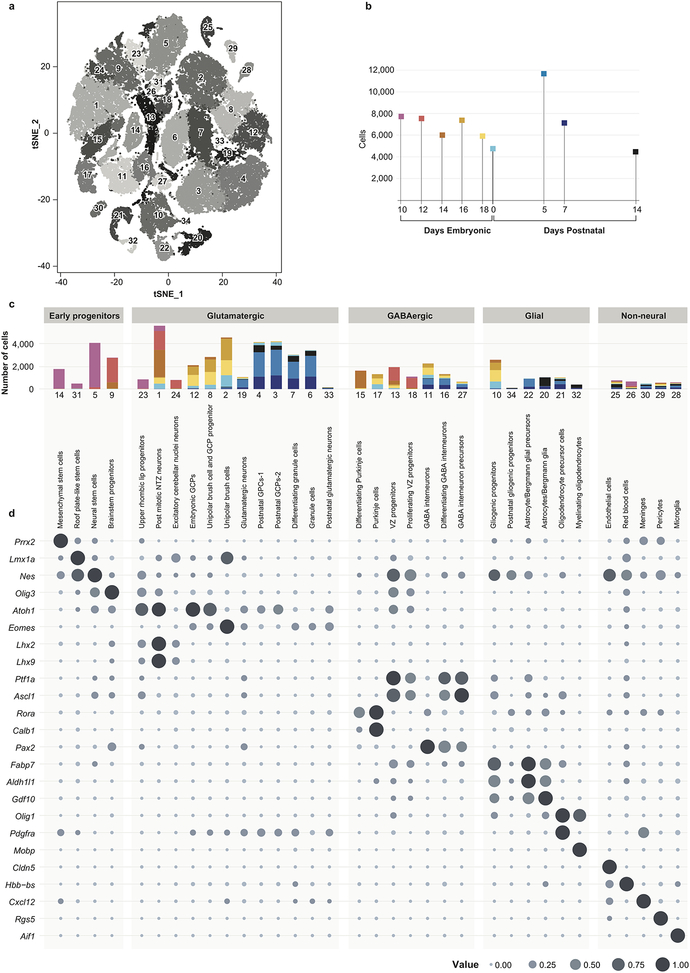
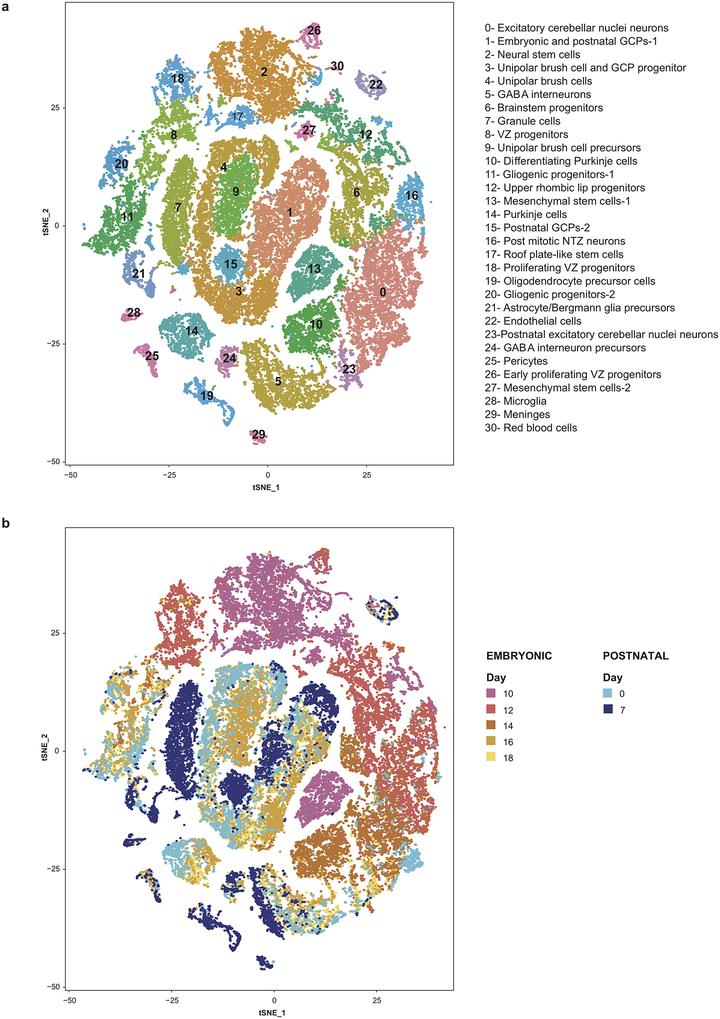
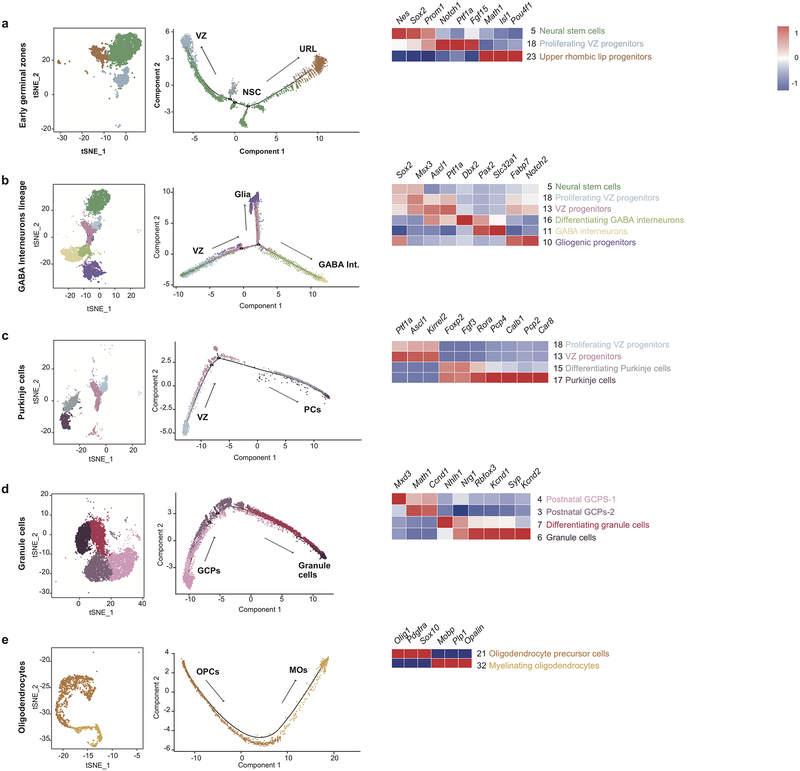
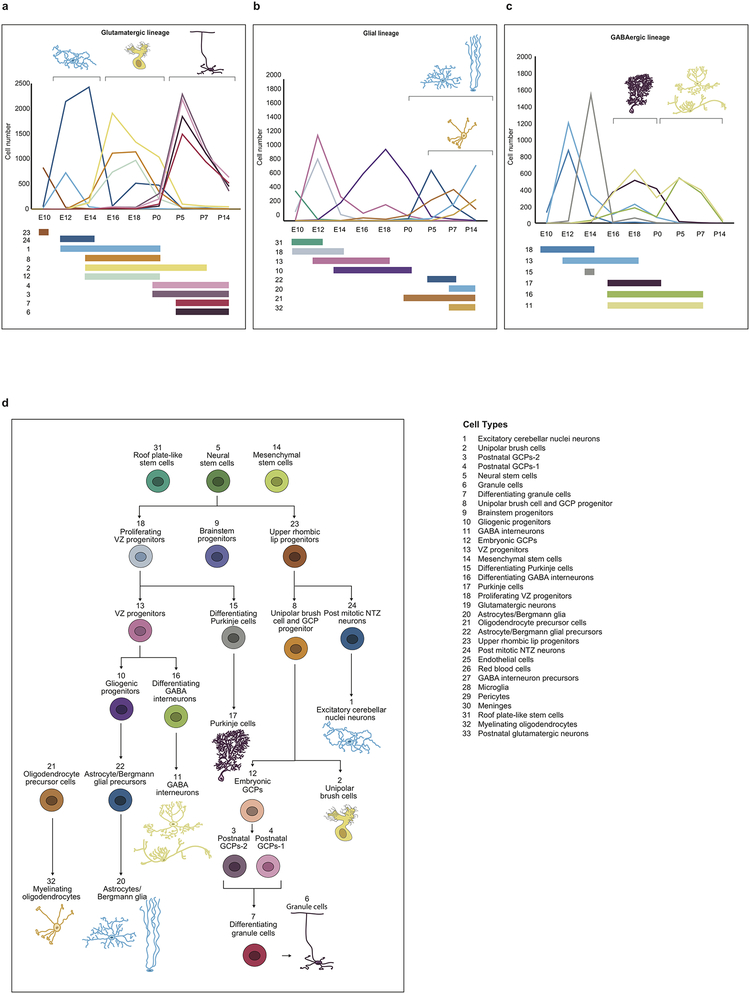
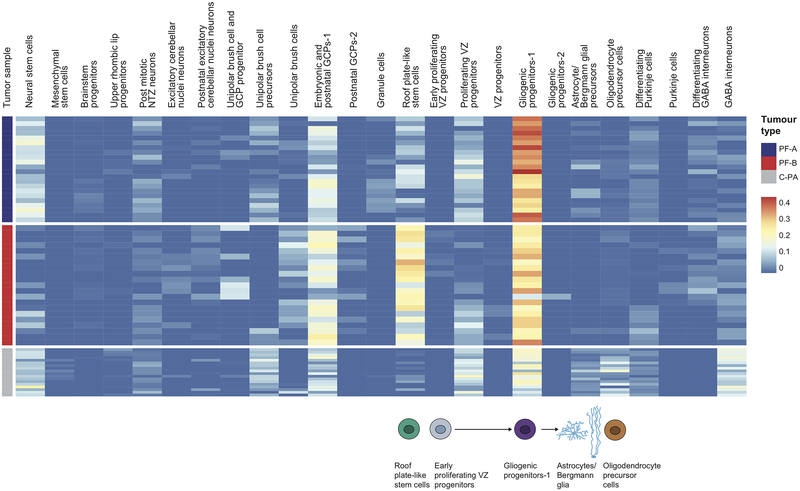
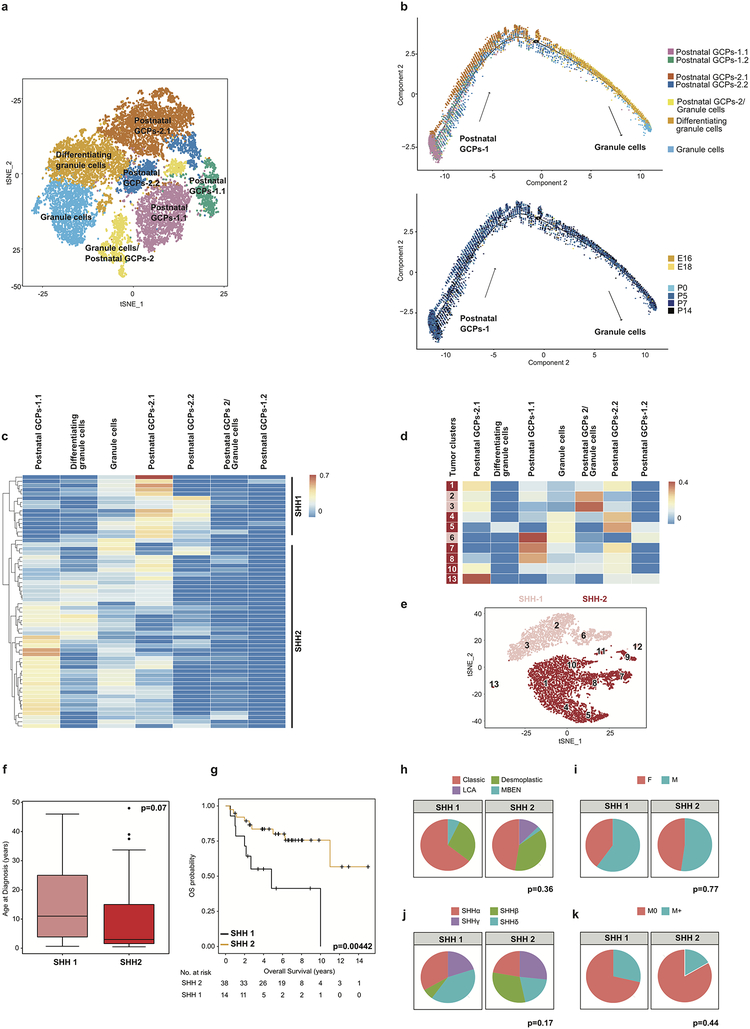
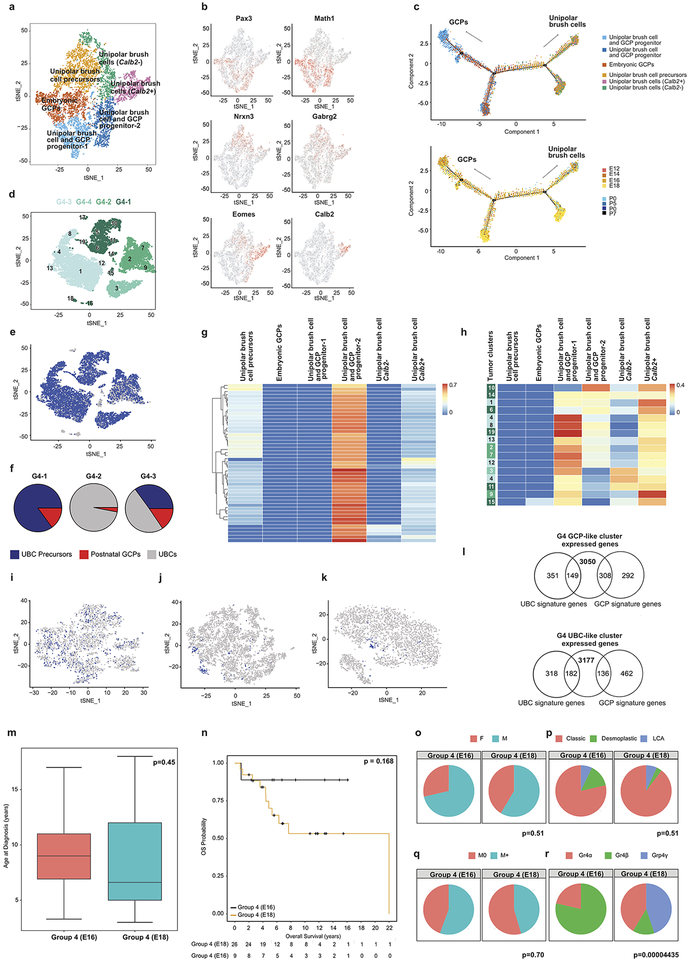
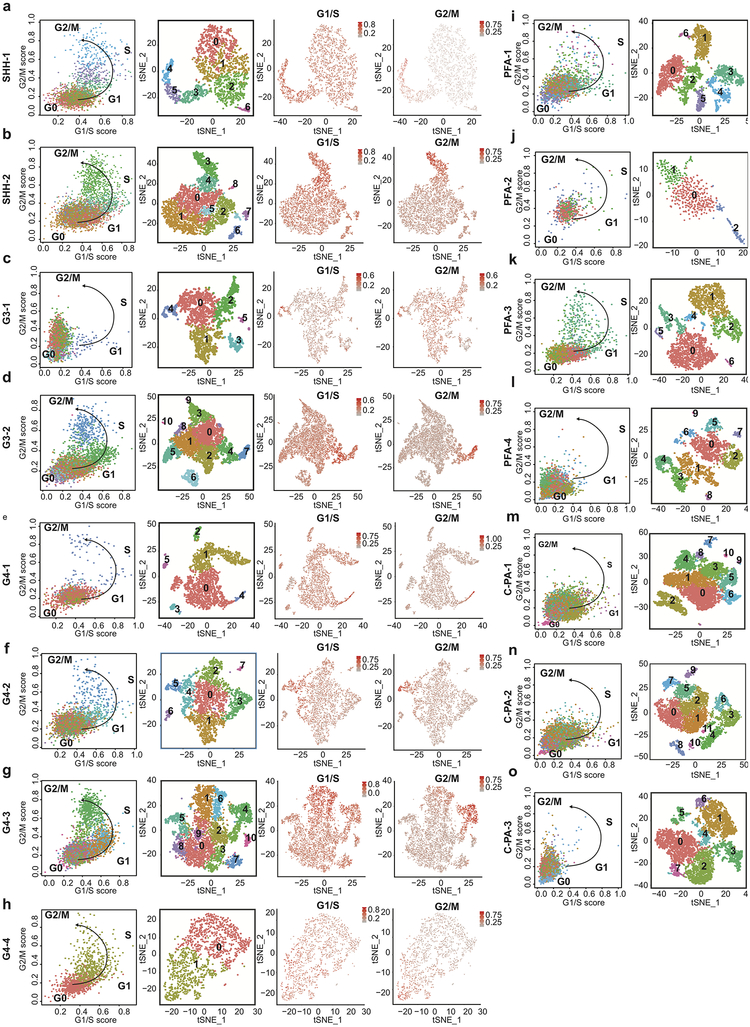
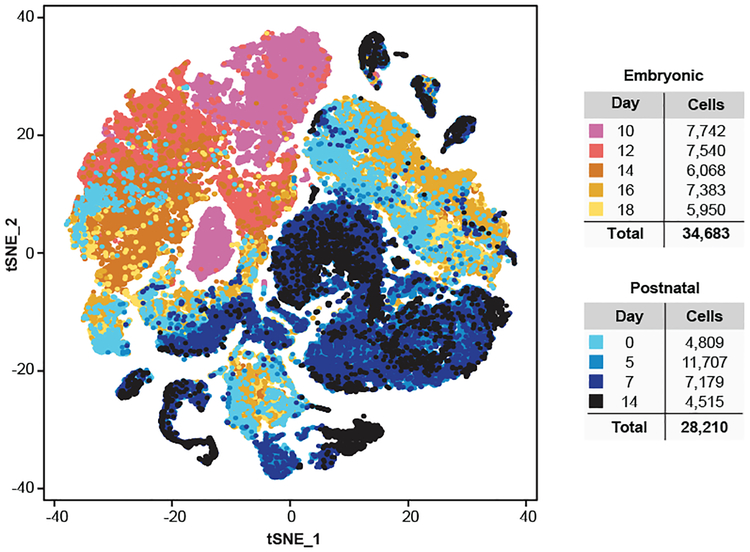
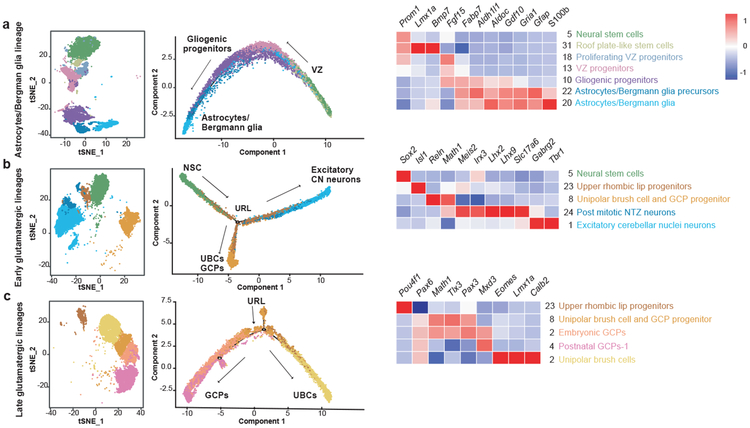
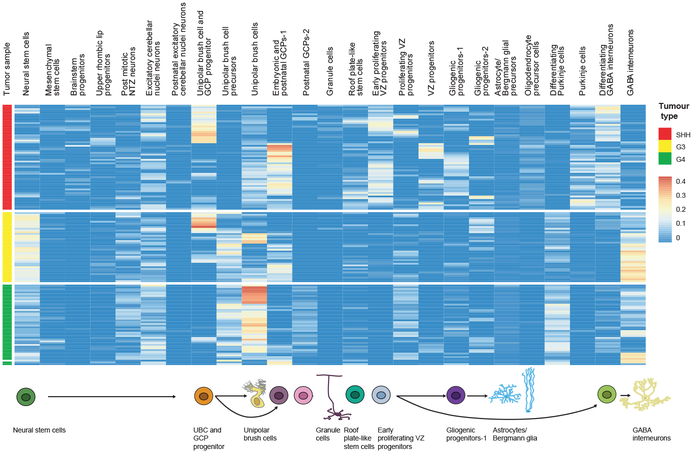
Study of the origin and development of cerebellar tumours has been hampered by the complexity and heterogeneity of cerebellar cells that change over the course of development. Here we use single-cell transcriptomics to study more than 60,000 cells from the developing mouse cerebellum and show that different molecular subgroups of childhood cerebellar tumours mirror the transcription of cells from distinct, temporally restricted cerebellar lineages. The Sonic Hedgehog medulloblastoma subgroup transcriptionally mirrors the granule cell hierarchy as expected, while group 3 medulloblastoma resembles Nestin+ stem cells, group 4 medulloblastoma resembles unipolar brush cells, and PFA/PFB ependymoma and cerebellar pilocytic astrocytoma resemble the prenatal gliogenic progenitor cells. Furthermore, single-cell transcriptomics of human childhood cerebellar tumours demonstrates that many bulk tumours contain a mixed population of cells with divergent differentiation. Our data highlight cerebellar tumours as a disorder of early brain development and provide a proximate explanation for the peak incidence of cerebellar tumours in early childhood.


Conflict of interest statement

Competing interests: Authors declare no competing financial interests.

Figures

Extended Figure 1.
Extended Figure 1.. Characterization of cell types in the mouse developing cerebellum.
t-SNE visualization demonstrating 34 unique clusters of 62,040 single cells (a). Bar chart displaying the number of cells collected during each developmental time point (n=9) (b). Bar plot displaying the number of cells within each identified cluster belonging to specific developmental time points (c). Circles showing the normalized average expression as indicated by the scale at the bottom right of established developmental lineage marker genes (n=24) specific to each cell cluster (d).
Extended Figure 2.
Extended Figure 2.. Clustering analysis of scRNA-seq data of mouse developing cerebellum of 7 time points used for generating CIBERSORT expression signature.
Seurat’s t-SNE visualization of transcriptionally distinct cell populations from 44,461 single cells from seven developmental time points annotated by cluster identity (n=31) (a) and by time point (n=7) (b).
Extended Figure 3.
Extended Figure 3.. Re-construction of cerebellar developmental lineages through pseudo-temporal ordering of cells.
t-SNE visualization and two-dimensional embedding showing constructed pseudo-time trajectories of different lineages in the developing cerebellum: Early germinal zones (n= 6,096 cells) (a), GABA Interneurons lineage (n= 13,432 cells) (b), Purkinje cells (n=6,048 cells) (c), Granule cells (n=15,011 cells) (d) and Oligodendrocytes (n= 1, 433 cells) (e). Cells within specific lineage clusters were selected, visualized using Seurat’s t-SNE visualization and then ordered based on Monocle 2’s reverse-graph embedding (RGE) method. Heatmaps demonstrate gene normalized expression levels of cluster-specific markers, red being highest and blue being lowest.
Extended Figure 4.
Extended Figure 4.. Diagram of developing cerebellar lineages showing relative abundance of cell type clusters across time.
Line plot showing the number of cells of each glutamatergic lineage cluster at each collected time point (a). Line plot showing the number of glial population clusters at each collected time point (b). Line plot showing the number of GABAergic cells at each collected time point (c). Cartoon of individual cell clusters identified through unsupervised hierarchical clustering of single cell transcriptomes from the developing mouse cerebellum (d). Cell clusters were arranged in their respective developmental hierarchies based on the expression of known marker genes as well as the results of pseudo-time analyses. Cluster annotations are found on the bottom right.
Extended Figure 5.
Extended Figure 5.. Deconvolution analyses of bulk human PFA, PFB ependymoma and cerebellar pilocytic astrocytoma tumor transcriptomes.
Hierarchical clustering of patient samples of known molecular subgroups based on calculated relative abundance values of the mouse cell-type clusters in each sample, obtained from CIBERSORT. Expression signatures from 26 mouse cell clusters were selected to deconvolute bulk RNA-seq of human PFA (n=22) and PFB (n=25) ependymomas, and C-PAs (n=10).
Extended Figure 6.
Extended Figure 6.. Clustering analysis and t-SNE visualization of human scRNA-seq data.
t-SNE visualization of scRNA-seq data used as input for the CIBERSORT deconvolution analysis of Shh MB (n=2) (a), Group 3 MB (n=2) (b), and Group 4 MB (n=4) (c), PFA (n=4) (d) and C-PA (n=3) (e) patient samples. Cluster annotations were established by expression of known marker genes unique to tumor and cell type and are defined as follows: SHH-1 Tumor clusters: 1,2,3,4,5 (cell cycle cluster: 5); Monocyte/Microglia: 6. SHH-2 Tumor clusters: 1,2,3,4,7 (cell cycle cluster: 4); Monocyte/Microglia: 5,6; T-cells:8. G3–1 Tumor clusters:1,2,3,5,6; Monocyte/Microglia:4. G3–2 Tumor clusters: 1,2,3,5,6,7 (cell cycle cluster: 2); Monocyte/Microglia:4. G4–1 Tumor clusters: 1,2,3,4,5,6 (cell cycle cluster: 4); Microglia/Monocytes: 8; T-cells:7. G4–2 Tumor clusters:1,2,3,4,5,7 (cell cycle cluster: 5); Microglia/Monocytes:6. G4–3 Tumor clusters: 1,2,3,4,5,6,7,8,9 (cell cycle cluster: 4); Monocytes/Microglia:10. G4–4 Tumor clusters: 1,2. PFA-1 Tumor clusters: 4,6; Monocytes/Microglia: 1,3,5; T-cells:2; B-cells:7. PFA-2 Tumor clusters: 1,2; Monocytes/Microglia: 3. PFA-3 Tumor clusters: 1,4,6,7; Microglia/Monocytes:2,3,5. PFA-4 Tumor clusters: 1,3,6,7; Monocytes/Microglia:2,4,5; T-cells:9; Pericytes:8; Endothelial cells:10. C-PA-1 Tumor cluster: 3; Monocytes/Microglia: 1,2,4,5,6,7,9,10,11; T-cells: 8. C-PA-2 Tumor clusters: 4,5,7; Monocytes/Microglia:1,2,3,6,8,10,11,12; T-cells:9. C-PA-3 Tumor clusters:2,4,5,7; Monocytes/Microglia:1,3,8; T-cells:6.
Extended Figure 7.
Extended Figure 7.. Re-clustering of the gliogenic progenitors and ‘roof plate like stem’ cells with comparison to PF ependymomas and C-PAs.
t-SNE visualization of the 8 sub-clusters obtained from combined re-clustering of ‘roof plate-like stem’ cells and gliogenic progenitor clusters (n= 2,525 cells) (a). Gene expression of gliogenic progenitor and ‘roof plate like stem’ cell marker genes onto t-SNE of sub-clusters (n= 2,525 cells) (b). Pseudo-time trajectory analysis of the 8 sub-clusters annotated by sub-cluster (above) and developmental time point (below) (n= 2,525 cells) (c). Deconvolution analysis heatmap of tumor cell single-cell PFA clusters (n = 9) (above) and tumor single-cell C-PA clusters (n = 6) (below) against expression signatures of the 8 murine developmental sub-clusters (d). t-SNE visualizations of clustered populations of PFA (n=4) (e) and C-PA (n=3) (f) scRNA-seq patient samples used for CIBERSORT’s deconvolution analysis. t-SNE visualization of the 6 sub-clusters obtained from re-clustering of only the gliogenic progenitor cluster (n= 1,709 cells) (g). Pseudo-time trajectory analysis of the gliogenic progenitor sub-clusters (n= 1,709 cells) annotated by sub-cluster (above) and developmental time point (below) (h). Deconvolution analysis heatmap of bulk PFA (n=22), PFB (n=25), and C-PA (n=10) patient samples against expression signatures of the 6 gliogenic progenitor sub-clusters (i).
Extended Figure 8.
Extended Figure 8.. Re-clustering of the granule cell lineage with comparison to Shh medulloblastomas.
t-SNE visualization showing 7 distinct sub-clusters from re-clustering of the granule cell lineage (n=15,011 cells) (a). Pseudo-time trajectory analysis of the 7 granule cell sub-clusters annotated by sub-cluster (above) and developmental time point (below) (n= 15,011 cells) (b). Deconvolution analysis heat-map of bulk Shh MB (n=60) patient sample transcriptomes against expression signatures of the 7 granule cell sub-clusters (c). Deconvolution analysis heatmap of Shh MB scRNA-seq tumor specific clusters (n=10) against signatures of the 7 granule sub-clusters (d). t-SNE plot of clustered populations of Shh MB scRNA-seq samples (n=2) (e). Comparison of clinical characteristics based on clustering by similarity to different points in GCP lineage of SHH-1 (n=15) and SHH-2 (n=45) comparing age at diagnosis (f). Boxplot center lines show data media; box limits indicate 25th and 75th percentiles; lower and upper whiskers extend 1.5 times the interquartile range (IQR) from the 25th and 75th percentiles respectively; outliers are represented by individual points; p value (p=0.07) was determined by Wilcoxon test. Survival curve, corrected for metastatic dissemination and molecular subtype, of SHH-1 (n=15) and SHH-2 (n=45) identified through matching to a re-clustered granule cell lineage (g). p value (p=0.00442) was determined by log rank test and + indicates censored cases. Comparison of additional clinical characteristics including histology (h), sex (i), molecular subtype affiliation (j), and metastatic status (k) of SHH-1 (n=15) and SHH-2 (n=45) patient samples. p values were determined using Fisher exact test.
Extended Figure 9.
Extended Figure 9.. Re-clustering of the unipolar brush cell lineage with comparison to Group 4 medulloblastomas.
t-SNE visualization of 6 distinct sub-clusters obtained from re-clustering of the unipolar brush cell (UBC) lineage (n= 9,605 cells) (a). Gene expression of unipolar brush cell lineage marker genes onto t-SNE of sub-clusters (n= 9,605 cells) (b). Pseudo-time trajectory analysis of the 6 sub-clusters, showing clear branching of the GCP and UBC lineage annotated by sub-clusters (above) and developmental time point (below) (n= 9,605 cells) (c). t-SNE visualization of the scRNA-seq clustered populations of Grp 4 MB human tumor samples (n=4) (d). t-SNE visualization of scRNA-seq clustering analysis of four Group 4 MB patient sample tumors colored by transcriptional match to both UBC and GCP gene expression signatures (9895 cells positive out of n= 12,129 cells) (e). Pie charts showing the percentage of cells at various states of differentiation in three G4 tumor samples based on their matches to UBC precursors, UBCs or postnatal GCPs (f). Deconvolution analysis heatmap of Group 4 MB (n=45) bulk patient sample transcriptomes against expression signatures of the 6 UBC sub-clusters (g). Deconvolution analysis heatmap of Group 4 MB scRNA-seq tumor cell clusters (n=15) against signatures of the 6 UBC sub-clusters (h). t-SNE visualization of re-clustered UBC and GCP progenitor cluster colored by the number of cells expressing UBCs transcriptional signature genes (573 cells positive out of n=2,866 cells) (i), the number of cells expressing GCP transcriptional signature genes (159 cells positive out of n= 4607 cells) (j), the number of cells expressing both UBC and GCP gene signatures (75 cells positive out of n=4607 cells) (k). Venn diagram showing Group 4 GCP-like clusters express 308/600 GCP signatures and 149/500 UBC signatures (n=3050 genes) (top) compared to Group 4 UBC-like clusters which express 136/600 GCP signatures and 182/500 UBC signatures (n=3177 genes) (bottom) (l). Comparison of clinical characteristics based on clustering by similarity to different points in UBC lineage of Group 4 E16 (n=17) and Group 4 E18 (n=28) comparing age at diagnosis (m). Boxplot center lines show data media; box limits indicate 25th and 75th percentiles; lower and upper whiskers extend 1.5 times the interquartile range (IQR) from the 25th and 75th percentiles respectively; outliers are represented by individual points; p value (p=0.45) was determined by Wilcoxon test. Survival curve, corrected for metastatic dissemination and molecular subtype, of Group 4 E16 (n=17) and Group 4 E18 (n=28) identified through matching to a re-clustered granule cell lineage (n). p value (p=0.168) was determined by log rank test and + indicates censored cases. Comparison of additional clinical characteristics including sex (o), histology (p), metastatic status (q), and molecular subtype affiliation (r) of Group 4 E16 (n=17) and Group 4 E18 (n=28) patient samples. p values were determined using Fisher exact test.
Extended Figure 10.
Extended Figure 10.
Cell cycle analysis of human scRNA-seq data. Dot plot showing the normalized ratio values of G1/S against G2/M ratios within each cell annotated by cluster identity (left) for Shh (n=2) (a-b), Group 3 MB (n=2) (c-d), Group 4 (n=4) (e-h) MBs and PFA (n=4) (i-l), C-PA (n=3) (m-o). Re-clustering t-SNE visualization of the single cell human tumors displaying cluster annotations (middle). Re-clustering t-SNE visualization with cell cycle phase ratios (G1/S, G2/M) projections (right).
Figure 1.
Figure 1.. Identification of cell types in the developing mouse cerebellum.
t-SNE visualization of transcriptionally distinct cell populations from 62,040 single cells from nine developmental time points. Clusters of cells were identified using a shared nearest neighbour (SNN) modularity optimization based clustering algorithm implemented by Seurat. The cells are color-coded by time point as indicated by the legend on the right.
Figure 2.
Figure 2.. Re-construction of cerebellar developmental lineages through pseudo-temporal ordering of cells.
t-SNE visualization and two-dimensional embedding showing constructed pseudo-time trajectories of different lineages in the developing cerebellum: Astrocyte/Bergmann glia lineage (n=12,304 cells) (a), Early glutamatergic lineage (n=14,358 cells) (b), Late glutamatergic lineage (n=14,662 cells) (c). Cells within specific lineage clusters were selected, visualized using Seurat’s t-SNE visualization and then ordered based on Monocle 2’s reverse-graph embedding (RGE) method. Heatmaps demonstrate gene normalized expression levels of cluster-specific markers, red being highest and blue being lowest.
Figure 3.
Figure 3.. Deconvolution analyses of bulk human medulloblastoma tumor transcriptomes.
Hierarchical clustering of patient samples of known molecular subgroups based on calculated relative abundance values of the mouse cell-type clusters in each sample, obtained from CIBERSORT. Expression signatures from 26 mouse cell clusters were selected to deconvolute bulk RNA-seq of human cerebellar tumors including: Shh, Group 3 and Group 4 MBs (n=145).
Figure 4.
Figure 4.. Temporal transcriptional matching of normal cerebellar cell clusters with bulk human tumors.
Deconvolution analysis of PFA (n=22) (a), PFB (n=21) (b), C-PA (n=10) (c) patient samples against different developmental time points of the gliogenic progenitor cell cluster. In situ hybridization staining of medial sagittal slices of marker genes Lmx1a, Ascl1, and Tnc during mouse cerebellar development (d). Deconvolution analysis of 45 Group 4 MB patient samples against different developmental stages of the UBC cluster (e). In situ hybridization staining of medial sagittal slice of marker genes Eomes during mouse cerebellar development (E15.5 and E18.5) (f). Deconvolution analysis of Shh MB (n=60) patient samples against P0, P5, and P7 developmental stages of the post-natal GCP-1 cell cluster (g). Expression of the post-natal GCP-1 cell cluster marker Math1 and Mfap4 in the developing P4 mouse cerebellum (h). All in situ hybridization data were obtained from Allen Brain Map: Developing Mouse Brain Atlas (http://developingmouse.brain-map.org).
Figure 5.
Figure 5.. Cell-type deconvolution analysis of tumor-cell specific clusters from human medulloblastoma scRNA-seq.
Clustering analysis and t-SNE visualization of scRNA-seq data of Shh MB (n=2) (a), Group 3 MB (n=2) (b), and Group 4 MB (n=4) (c) patient samples. Each patient’s sample is shown as a different color. Each individual tumor cell cluster was subjected to a deconvolution analysis against 26 previously identified mouse cell populations using CIBERSORT, with each individual tumor cluster identified in the far left hand column of each heatmap.
Figure 6.
Figure 6.. Cell-type deconvolution analysis of tumor-cell specific clusters from human PFA and cerebellar pilocytic astrocytoma scRNA-seq.
Clustering analysis and t-SNE visualization of scRNA-seq of PFA (n=4) (a) and C-PA (n=3) (b) human samples. Each patient’s sample is shown as a different color. Each individual tumor cell cluster was subjected to a deconvolution analysis against 26 previously identified mouse cell populations using CIBERSORT, with each individual tumor cluster identified in the far left hand column of each heatmap.

Comment in

References

    1. Cavalli FMG et al. Intertumoral Heterogeneity within Medulloblastoma Subgroups. Cancer Cell 31, 737–754 e736, doi: 10.1016/j.ccell.2017.05.005 (2017). - DOI - PMC - PubMed
    1. Northcott PA et al. Subgroup-specific structural variation across 1,000 medulloblastoma genomes. Nature 488, 49–56, doi: 10.1038/nature11327 (2012). - DOI - PMC - PubMed
    1. Dubuc AM, Mack S, Unterberger A, Northcott PA & Taylor MD The epigenetics of brain tumors. Methods in molecular biology 863, 139–153, doi: 10.1007/978-1-61779-612-8_8 (2012). - DOI - PubMed
    1. Dubuc AM et al. Subgroup-specific alternative splicing in medulloblastoma. Acta neuropathologica 123, 485–499, doi: 10.1007/s00401-012-0959-7 (2012). - DOI - PMC - PubMed
    1. Northcott PA et al. Medulloblastoma comprises four distinct molecular variants. J Clin Oncol 29, 1408–1414, doi: 10.1200/JCO.2009.27.4324 (2011). - DOI - PMC - PubMed

Methods References

    1. Nguyen QH et al. Profiling human breast epithelial cells using single cell RNA sequencing identifies cell diversity. Nat Commun 9, 2028, doi: 10.1038/s41467-018-04334-1 (2018). - DOI - PMC - PubMed
    1. De Simoni A & Yu LM Preparation of organotypic hippocampal slice cultures: interface method. Nat Protoc 1, 1439–1445, doi: 10.1038/nprot.2006.228 (2006). - DOI - PubMed
    1. Zheng GX et al. Massively parallel digital transcriptional profiling of single cells. Nat Commun 8, 14049, doi: 10.1038/ncomms14049 (2017). - DOI - PMC - PubMed
    1. Lun AT, Bach K & Marioni JC Pooling across cells to normalize single-cell RNA sequencing data with many zero counts. Genome Biol 17, 75, doi: 10.1186/s13059-016-0947-7 (2016). - DOI - PMC - PubMed
    1. Satija R, Farrell JA, Gennert D, Schier AF & Regev A Spatial reconstruction of single-cell gene expression data. Nat Biotechnol 33, 495–502, doi: 10.1038/nbt.3192 (2015). - DOI - PMC - PubMed

Publication types

MeSH terms