. 2019 May;569(7755):270-274.
doi: 10.1038/s41586-019-1170-y. Epub 2019 May 1.

CD8+ T cells regulate tumour ferroptosis during cancer immunotherapy

Affiliations

CD8+ T cells regulate tumour ferroptosis during cancer immunotherapy

Weimin Wang et al. Nature. 2019 May.

Abstract

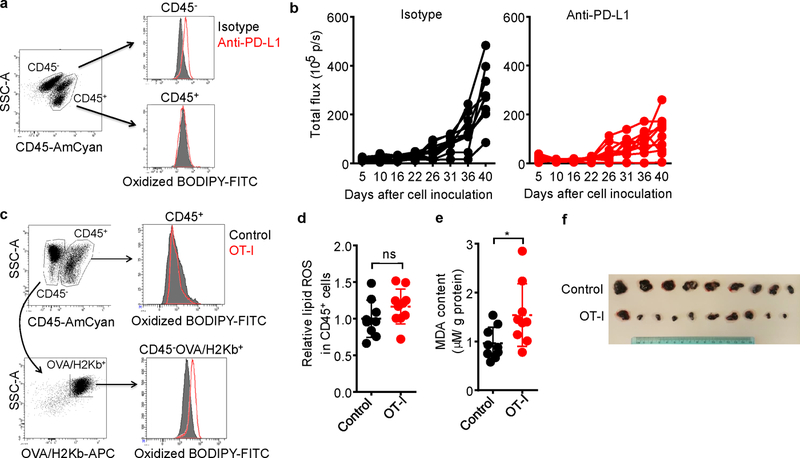
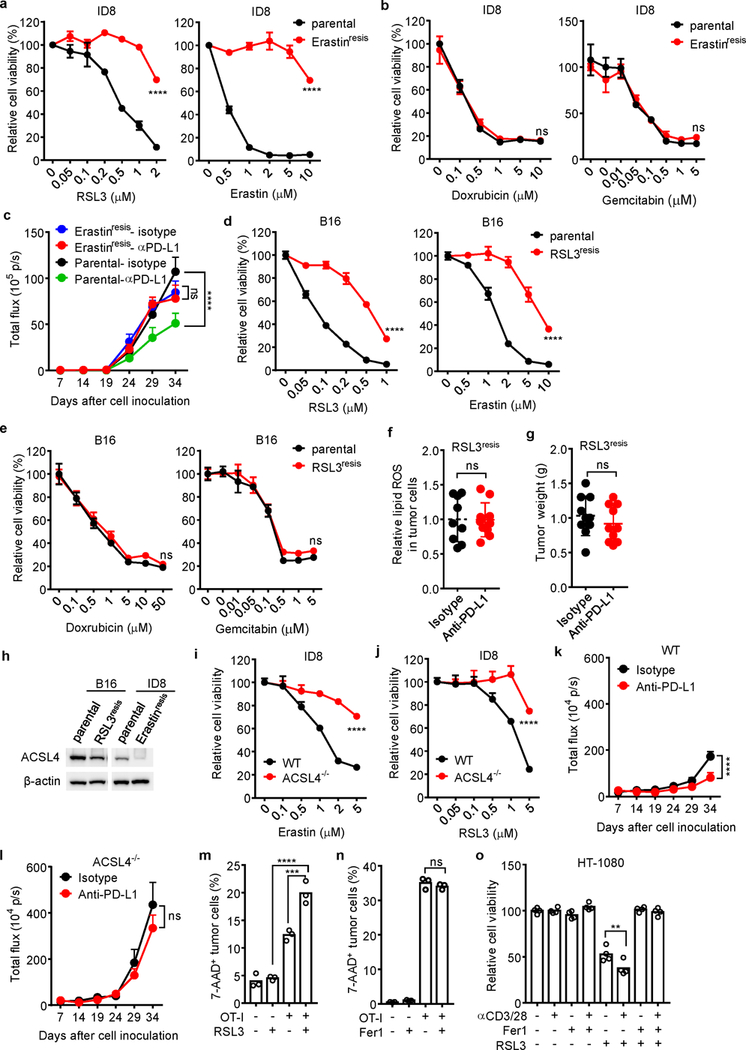
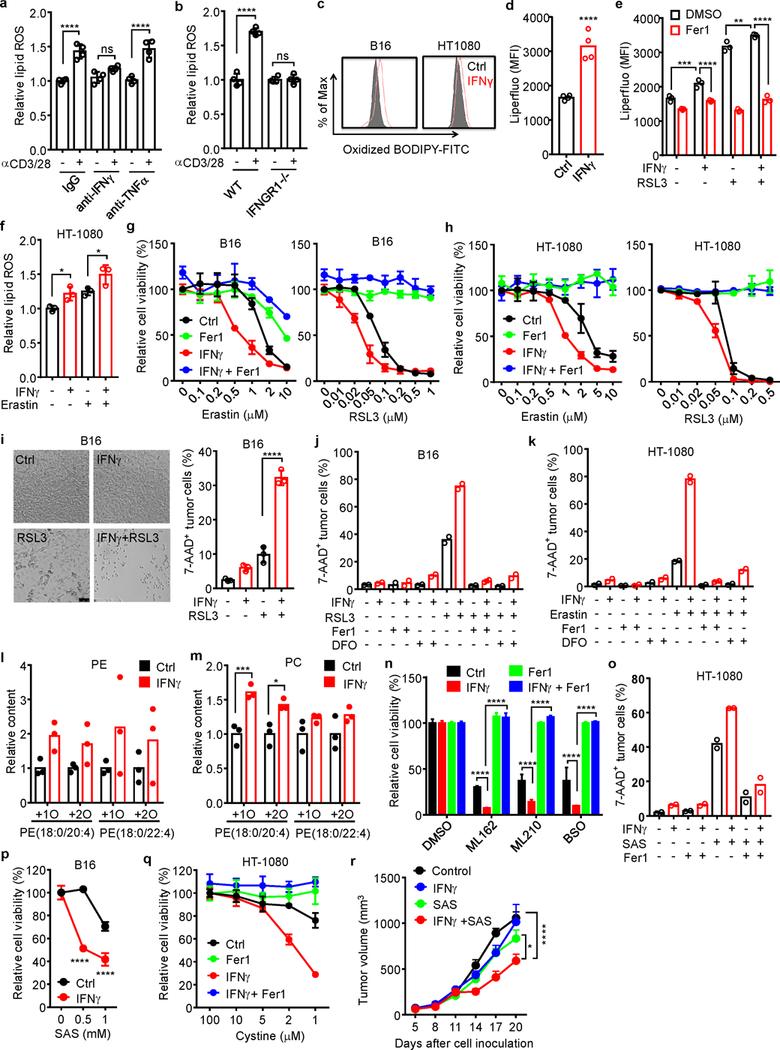
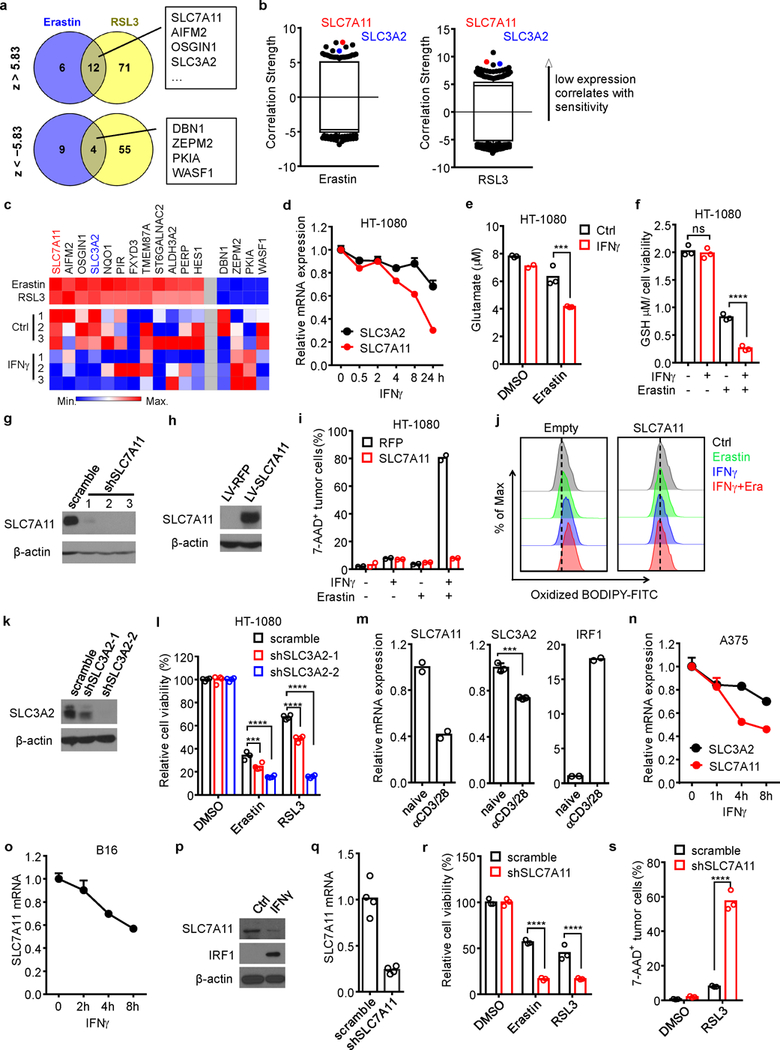
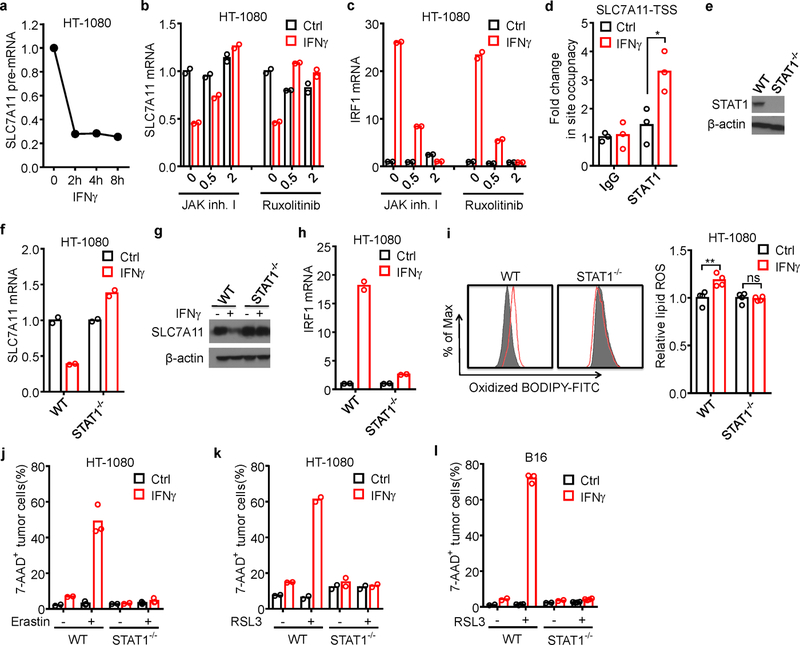
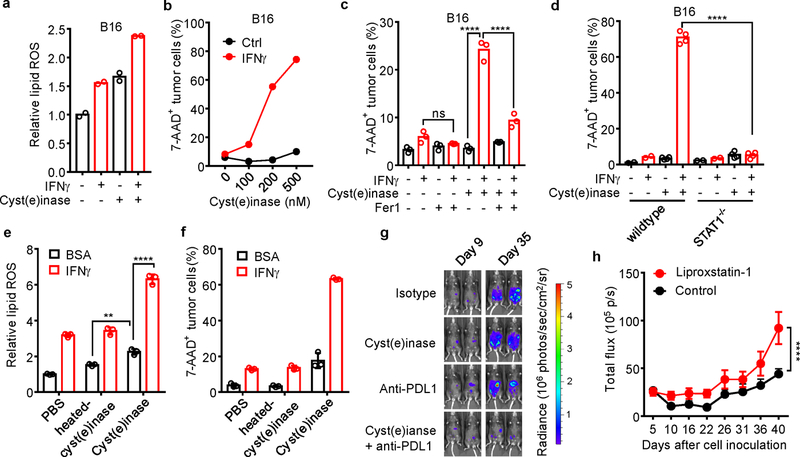
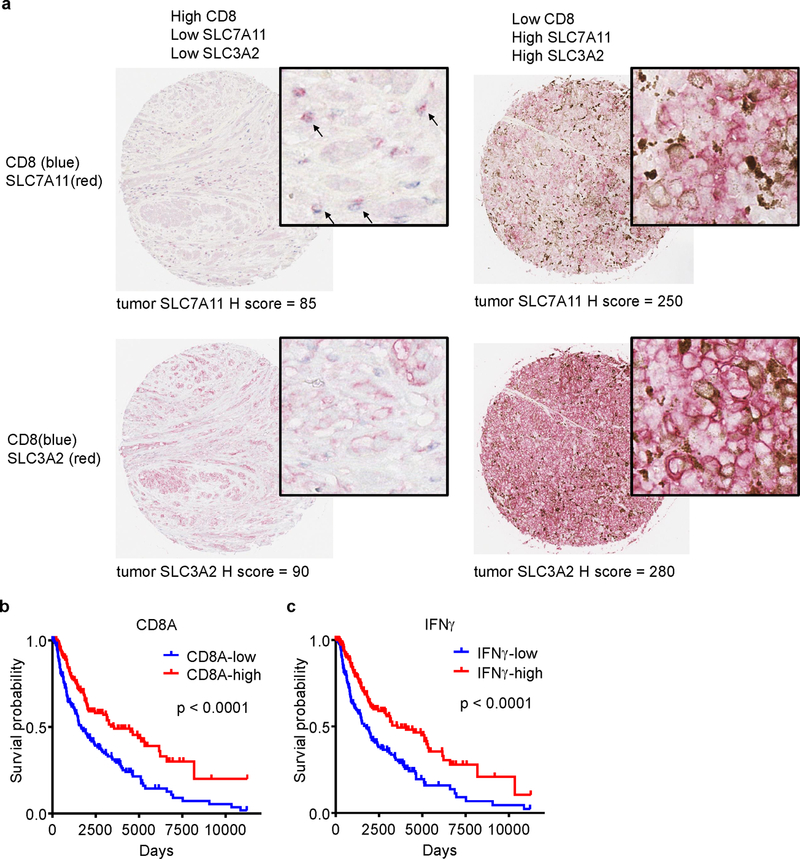
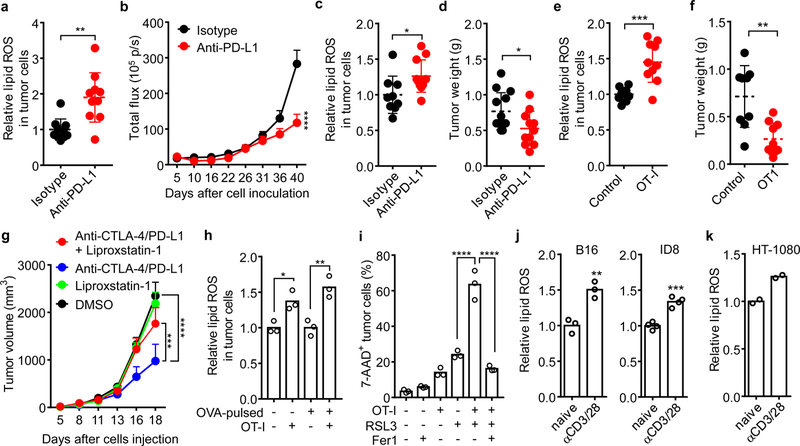
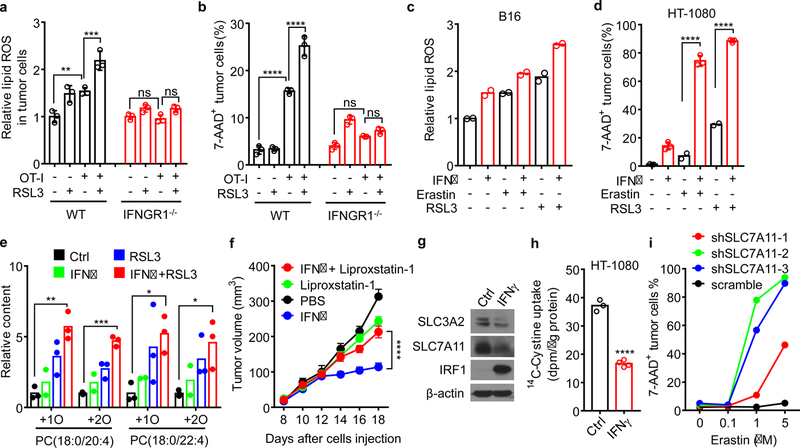
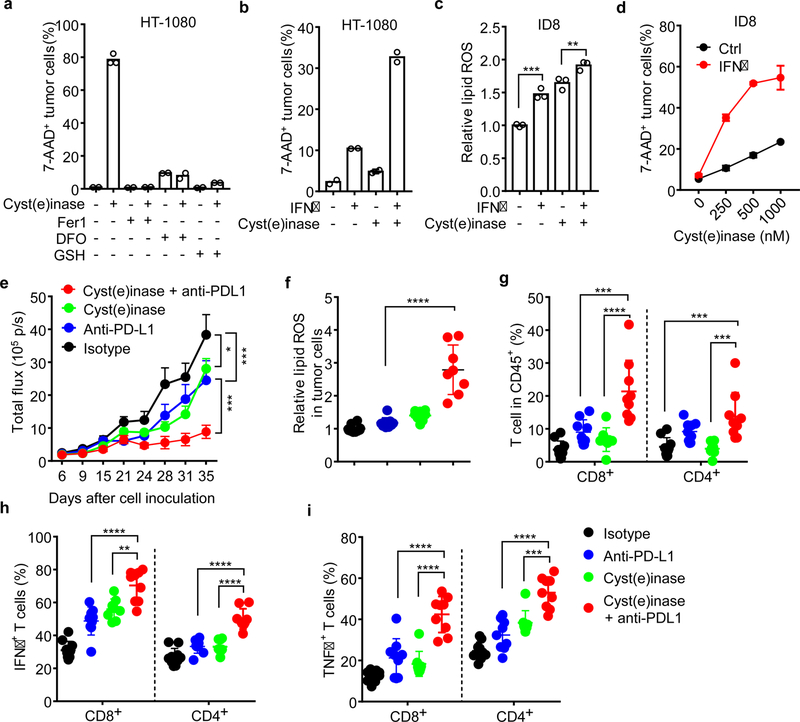
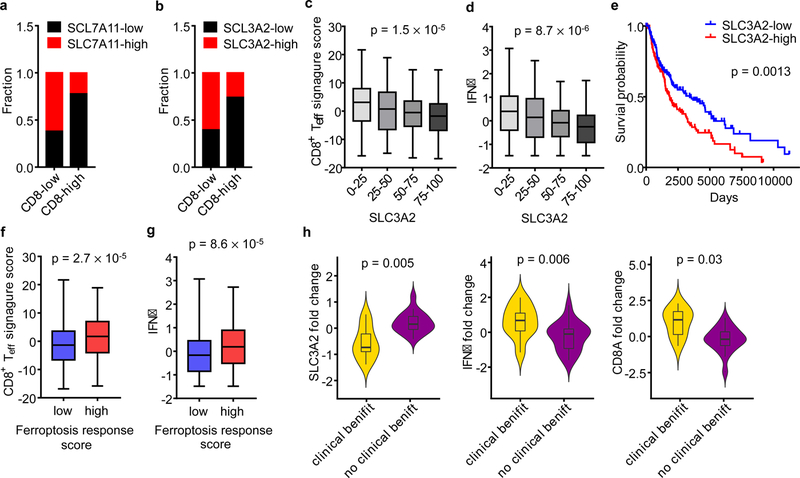
Cancer immunotherapy restores or enhances the effector function of CD8+ T cells in the tumour microenvironment1,2. CD8+ T cells activated by cancer immunotherapy clear tumours mainly by inducing cell death through perforin-granzyme and Fas-Fas ligand pathways3,4. Ferroptosis is a form of cell death that differs from apoptosis and results from iron-dependent accumulation of lipid peroxide5,6. Although it has been investigated in vitro7,8, there is emerging evidence that ferroptosis might be implicated in a variety of pathological scenarios9,10. It is unclear whether, and how, ferroptosis is involved in T cell immunity and cancer immunotherapy. Here we show that immunotherapy-activated CD8+ T cells enhance ferroptosis-specific lipid peroxidation in tumour cells, and that increased ferroptosis contributes to the anti-tumour efficacy of immunotherapy. Mechanistically, interferon gamma (IFNγ) released from CD8+ T cells downregulates the expression of SLC3A2 and SLC7A11, two subunits of the glutamate-cystine antiporter system xc-, impairs the uptake of cystine by tumour cells, and as a consequence, promotes tumour cell lipid peroxidation and ferroptosis. In mouse models, depletion of cystine or cysteine by cyst(e)inase (an engineered enzyme that degrades both cystine and cysteine) in combination with checkpoint blockade synergistically enhanced T cell-mediated anti-tumour immunity and induced ferroptosis in tumour cells. Expression of system xc- was negatively associated, in cancer patients, with CD8+ T cell signature, IFNγ expression, and patient outcome. Analyses of human transcriptomes before and during nivolumab therapy revealed that clinical benefits correlate with reduced expression of SLC3A2 and increased IFNγ and CD8. Thus, T cell-promoted tumour ferroptosis is an anti-tumour mechanism, and targeting this pathway in combination with checkpoint blockade is a potential therapeutic approach.


Conflict of interest statement

Competing interests GG and ES are inventors on intellectual property related to cyst(e)inase and hold equity interest in Aeglea Biotherapeutics Inc. TAC is a co-founder of Gritstone Oncology and holds equity. TAC holds equity in An2H. TAC acknowledges grant funding from Bristol-Myers Squibb, AstraZeneca, Illumina, Pfizer, An2H, and Eisai. TAC has served as a paid advisor for Bristol-Myers Squibb, Illumina, Eisai, and An2H. MSK has licensed the use of TMB for the identification of patients that benefit from immune checkpoint therapy to PGDx. MSK and TAC receives royalties as part of this licensing agreement. WZ has served as a consultant or advisor for Lycera, NGM, Synlogic, and Henlix.

Figures

Extended Data Fig. 1
Extended Data Fig. 1. Immunotherapy increases lipid peroxidation in cancer cells
a, Flow cytometry analysis of BODIPY fluorescence in CD45- tumor cells isolated from mouse peritoneal cavity. b, ID8 tumor growth in individual mice was monitored by quantifying total flux (photos per second). Animals were treated with either anti-PD-L1 or isotype mAb (see Fig. 1b). c, Flow cytometry analysis of oxidized BODIPY fluorescence in CD45- H2kb/OVA+ tumor cells and OT-I cells isolated from subcutaneous B16 tumor tissue. d, Relative lipid ROS in CD45+ cells isolated from subcutaneous B16 tumor tissue. Control, n = 9; OT-I, n = 10; ns, P = 0.1584 was determined by two-tailed t-test. e, Effect of OT-I cells on MDA concentration in B16 cells in vivo. MDA content in tumor tissue lysate was measured by TBRAS assay and normalized to protein concentration. Control, n = 9; OT-I, n = 9; * P = 0.0285 is determined by two-tailed t-test. f, Subcutaneous B16 tumors from control and OT-I groups were surgically removed and presented. The minimum scale of the rule is millimeters.
Extended Data Fig. 2
Extended Data Fig. 2. Ferroptosis in cancer cells is regulated by immunotherapy and contributes to anti-tumor effect of immunotherapy
a, b, Relative viability of parental ID8 or erastin-resistant ID8 cells treated with different concentrations of ferroptosis inducers RSL3 or erastin, or apoptosis inducers doxrubicin and gemcitabin for 24 hours. n = 3 or 4 biological replicates (mean ± s.d.). **** P < 0.0001 as determined by two-way ANOVA. c, Anti-tumor effect of PD-L1 blockade in parental or erastin-resistant ID8 tumor bearing mice. Mice with luciferase-expressing ID8 tumor cells were treated with either anti-PD-L1 or isotype mAb. Tumor growth was monitored by quantifying total flux (photos per second). Parental-isotype, n = 8; Parental-anti-PDL1, n = 8; Erastinresis-isotype, n = 9; Erastinresis-anti-PDL1, n = 9; **** P < 0.0001; ns, P = 0.9018; two-way ANOVA. d, e, Relative viability of parental B16 or RSL3-resistant B16 cells treated with different concentrations of ferroptosis inducers RSL3 or erastin, or apoptosis inducers doxrubicin and gemcitabin for 24 hours. n = 3 or 4 biological replicates (mean ± s.d.). **** P < 0.0001 as determined by two-way ANOVA. f, g, Effect of anti-PD-L1 therapy on tumor lipid ROS (f) and tumor growth (g) in RSL3-resistant (RSL3resis) B16 tumor bearing mice. Mice with subcutaneous tumor were treated with either anti-PD-L1 or isotype mAb. (f) Relative lipid ROS in tumor cells was measured by FACS in gated CD45- cells (Isotype, n = 9; anti-PD-L1, n = 10; two-tailed t-test; ns, P = 0.9608). (g) Tumor weight was measured on day 17 (Isotype, n = 10; anti-PD-L1, n = 10; two-tailed t-test; ns, P = 0.3621). h, Immunoblot of ACSL4 in RSL3-resistant (RSL3resis) B16 and erastin-resistant (Erastinresis) ID8 cells compared with their parental cells. i, j, Relative cell viability of wild-type or ACSL4 deficient (ACSL4−/−) ID8 cells treated with different concentrations of erastin (i) or RSL3 (j) for 24 hours. n = 3 or 4 biological replicates (mean ± s.d.). **** P < 0.0001 as determined by two-way ANOVA. k, l, Anti-tumor effect of PD-L1 blockade in WT (k) or ACSL4−/− (l) ID8 tumor bearing mice. Luciferase-expressing ID8 tumor bearing mice were treated with either anti-PD-L1 or isotype mAb. Tumor growth was monitored by quantifying total flux (photos per second). WT, isotype, n =10; WT, anti-PD-L1, n = 10; ACSL4−/−, isotype, n = 9; ACSL4−/−, anti-PD-L1, n = 9; two-way ANOVA, **** P < 0.0001 (k); ns, P = 0.317 (l). m, The percentage of 7AAD+ ID8-OVA cells in the mixed co-cultures with OT-I cells (ID8: OT-I = 1: 1) for 24 hours followed by treatment with RSL3 (0.1 μM) for 20 hours. n = 3 biological replicates. *** P = 0.0004 and **** P < 0.0001 were determined by one-way ANOVA. n, The percentage of 7-AAD+ B16-OVA cells in the mixed co-cultures with OT-I cells (B16: OT-I = 1: 2) in the presence of Fer1 (10 μM) for 40 hours. n = 3 biological replicates. ns, P = 0.4640 was determined by one-way ANOVA. o, Relative viability of HT-1080 cells primed by the supernatants from anti-CD3 and anti-CD28 activated human CD8+ T cells for 24 hours, followed with RSL3 (0.05 μM) in the presence of Fer1 (10 μM) for another 16 hours. n = 4 biological replicates. ** P = 0.0015 as determined by one-way ANOVA.
Extended Data Fig. 3
Extended Data Fig. 3. IFNγ sensitizes tumor cells to ferroptosis
a, Relative lipid ROS in B16 cells treated with the supernatants from activated CD8+ T cells in the presence of anti-IFNγ or anti-TNFα blocking antibody for 40 hours. n = 4 biological replicates. ns, P = 0.1003; **** P < 0.0001 as determined by one-way ANOVA. b, Relative lipid ROS in wild-type or IFNGR1 deficient (IFNGR1−/−) B16 cells treated with the supernatant from activated CD8+ T cells for 40 hours. n = 4 biological replicates. ns, P = 0.9981; **** P < 0.0001 was determined by one-way ANOVA. c. Lipid ROS in B16 or HT-1080 cells treated with IFNγ for 24 hours. The representative histogram plot for fluorescent of oxidized C11-BODIPY is shown. d, Mean fluorescence intensity (MFI) of LiperFluo in B16 cells treated with IFNγ for 24 hours. n = 4 biological replicates. **** P < 0.0001 as determined by two-tailed t-test. e, MFI of LiperFluo in HT-1080 cells primed with IFNγ for 24 hours, followed with RSL3 (0.05 μM) for 6 hours in the presence of Fer1 (10 μM). n = 4 biological replicates. ** P = 0.0067; *** P = 0.0003 and **** P < 0.0001 were determined by two-way ANOVA. f, Relative lipid ROS of HT-1080 cells primed by IFNγ (10 ng/ml) for 40 hours and followed with erastin (2 μM) treatment for 8 hours. n = 3 biological replicates. * P = 0.0426 or 0.0250 was determined by one-way ANOVA. g-h, Relative viability of B16 (g) or HT-1080 (h) cells primed with or without (Ctrl) IFNγ for 40 hours in the presence of Fer1 (10 μM), followed by treatment with different concentrations of erastin or RSL3 for 24 hours. n = 3 or 4 biological replicates (mean ± s.d.). i, The percentage of 7-AAD+ B16 cells primed by IFNγ (10 ng/ml) for 40 hours and followed with RSL3 (0.1 μM) treatment for 20 hours. Representative images were shown (left panel). Cell death was quantified by FACS after PI staining (right panel). n = 3 biological replicates. **** P < 0.0001 as determined by one-way ANOVA. j, k, The percentage of 7-AAD+ B16 (j) or HT-1080 (k) cells primed by IFNγ and followed with RSL3 (0.1 μM in j) or erastin (4 μM in k) in the presence of Fer1(10 μM) or deferoxamine (DFO, 100 μM). n = 2 biological replicates. l, m, Relative content of oxygenated phosphatidylethanolamine (PE) (l) and phosphatidylcholine (m) species in HT-1080 cells primed by IFNγ (10 ng/ml) for 48 hours. n = 3 biological replicates. *** P = 0.0008 and * P = 0.0167 were determined by two-tailed t-test. n, Relative viability of HT-1080 cells primed by IFNγ for 24 hours, followed by ML162 (0.1 μM), ML210 (0.1 μM), or BSO (5 μM) for 24 hours in the presence of Fer1 (10 μM). n = 3 (mean ± s.d.), **** P < 0.0001 as determined by two-way ANOVA. o, The percentage of 7AAD+ HT-1080 cells primed by IFNγ, followed with SAS (0.5 mM) for 40 hours in the presence of Fer1 (10 μM). n = 2 biological replicates. p, Relative viability of B16 cells primed by IFNγ for 24 hours, followed with different concentrations of sulfasalazine (SAS) for additional 24 hours. n = 3 (mean ± s.d.).**** P < 0.0001 as determined by two-way ANOVA. q, Relative viability of HT-1080 cells primed with or without IFNγ, then cultured with medium supplemented with decreased concentrations of cystine in the presence of Fer1 (10 μM) for 20 hours. n = 3 or 4 biological replicates (mean ± s.d.). r, Effect of IFNγ and SAS on HT-1080 tumor growth in vivo. HT-1080 cells (2 × 10⁶ cells) were subcutaneously inoculated into NSG mice. Mice were treated either with IFNγ (1.5 × 10⁵ U/ mice), SAS (120 mg/kg) or the combination. n = 5 animals in each group. * P < 0.05 and **** P < 0.0001 were determined by two-way ANOVA.
Extended Data Fig. 4
Extended Data Fig. 4. Tumor cells and T cells are differentially responsive to ferroptosis inducers
a, b, The percentage of 7-AAD+ cells in human naïve (a) and mouse (b) CD4+ and CD8+ T cells primed by IFNγ for 24 hours, followed by treatment with Fer1, and different concentrations of erastin or RSL3 for 24 hours. n = 3 biological replicates (mean ± s.d.). c, d, The percentage of IFNγ+ cells in human (c) and mouse (d) CD4+ and CD8+ T cells. T cells were activated with anti-CD3 and anti-CD28 antibodies for 1 day, followed by treatment with Fer1 and different concentrations of erastin and RSL3 for 2 days. IFNγ expression was determined by FACS. n = 3 biological replicates (mean ± s.d.).
Extended Data Fig. 5
Extended Data Fig. 5. IFNγ targets system xc- to regulate tumor cell ferroptosis
a, Venn diagram showing common genes whose expressions were negatively (z > 5.83) or positively (z < −5.83) associated with cell line sensitivity to erastin and RSL3. b, Box-and-whisker plots show 1st and 99th percentile outlier transcripts (black and colored dots) whose expression levels are correlated with cell line sensitivity to erastin and RSL3. Plotted values are z scored Pearson’s correlation coefficients. c, Heat maps of the 16 genes associated with the sensitivity to erastin and RSL3 and their expressions in IFNγ-treated HT-1080 cells (bottom). Left 12 genes are negatively associated with drug sensitivity; right 4 genes are positively associated with drug sensitivity. d, Relative mRNA expressions of SLC3A2 and SLC7A11 in HT-1080 cells treated by IFNγ at different time points. n = 3 biological replicates (mean ± s.d.). e, The concentration of glutamate released from HT-1080 cells primed by IFNγ, followed by DMSO or erastin treatment. n = 3 biological replicates. *** P < 0.001 as determined by one-way ANOVA. f, Intracellular GSH in HT-1080 cells treated with IFNγ (10 ng/ml) for 24 hours and followed with erastin (0.5 μM) for 16 hours. n = 3 biological replicates. ns, P = 0.8843 and **** P < 0.0001 were determined by one-way ANOVA. g, h, Immunoblots of SLC7A11 in HT-1080 cells. HT-1080 cells expressed scramble shRNA, 3 independent shRNAs targeting SLC7A11 (g) and lentivector-expressing RFP and SLC7A11 (h). i, The percentage of 7-AAD+ cells in HT-1080 cells with red fluorescent protein (RFP) or SLC7A11 cDNA, primed with or without IFNγ, then treated with or without erastin (5 μM) for 20 hours. n = 2 biological repeats. j, Lipid ROS in HT-1080 cells with empty vector (Empty) or SLC7A11 cDNA primed with IFNγ, followed with erastin treatment for (1 μM) for 20 hours. The representative histogram plot for fluorescent of oxidized C11-BODIPY is shown. k, Immunoblots of SLC3A2 in HT-1080 cells expressed scramble shRNA or 2 independent shRNAs targeting SLC3A2. l, Relative viability of HT-1080 cells expressing scramble shRNA or shRNA targeting SLC3A2 (shSLC3A2–1, 2), treated with erastin or RSL3 for 24 hours. n = 4 biological replicates; *** P < 0.001, **** P < 0.0001 as determined by two-way ANOVA. m, Relative mRNA expressions of SLC7A11, SLC3A2, and IRF1 in HT-1080 cells treated for 24 hours with the supernatants from naïve or activated CD8+ T cells. *** P < 0.001 as determined by two-tailed t-test. n, Relative mRNA expressions of SLC3A2 and SLC7A11 in human A375 cells treated by IFNγ at different time points. o, Relative mRNA expression of SLC7A11 in B16 cells treated by IFNγ at different time points. p, Immunoblots of mouse SLC7A11 and IRF1 in B16 cells treated with IFNγ (10 ng/ml) for 24 hours. β-actin serves as the loading control. Images are representative of two experiments. q, Relative mRNA expression of SLC7A11 in B16 cells expressing shRNA against SLC7A11. r, Relative viability of B16 cells expressing scramble shRNA or shRNA targeting SLC7A11 treated with erastin or RSL3 for 24 hours. **** P < 0.0001 as determined by two-way ANOVA. s, The percentage of 7-AAD+ B16 cells expressing scramble shRNA or shRNA targeting SLC7A11 treated with RSL3 for 16 hours. **** P < 0.0001 as determined by one-way ANOVA.
Extended Data Fig. 6
Extended Data Fig. 6. IFNγ inhibits SLC7A11 through the JAK-STAT1 pathway
a, Relative expression of SLC7A11 pre-mRNA in HT-1080 cells treated by IFNγ at different time points. b, c, Relative mRNA expressions of SLC7A11 (b) or IRF1 (c) in HT-1080 cells treated by IFNγ and JAK inhibitor I or ruxolitinib (0, 0.5 or 2 µM) for 24 hours. d, ChIP of STAT1 in HT-1080 cells treated with or without IFNγ. STAT1 binding to SLC7A11 TSS region was quantified by qPCR. Results are expressed as the fold changes in site occupancy over control. * P = 0.0156 as determined by two-way ANOVA. e, Immunoblot of STAT1 in HT-1080 cells with STAT1 wild-type or STAT1 deficiency (STAT1−/−) generated by CRISPR-Cas9. f-k, STAT1 wild-type or STAT1 deficient (STAT1−/−) HT-1080 cells treated with or without IFNγ. SLC7A11 mRNA level (f), SLC7A11 immunoblot (g), IRF1 mRNA level (h), relative lipid ROS (i), erastin-induced cell death (j), and RSL3-induced cell death (k) were analyzed. ** P = 0.0033; ns, P > 0.9999 (two-way ANOVA) (i, right panel). l, The percentage of 7-AAD+ STAT1 wild-type or deficient (STAT1−/−) B16 cells treated with or without IFNγ, followed with RSL3 treatment for 24 hours. n = 3 biological replicates.
Extended Data Fig. 7
Extended Data Fig. 7. Cyst(e)inase and PD-L1 blockade synergistically induce ferroptosis
a, Relative lipid ROS in B16 cells primed by IFNγ, followed by 500 nM cysteinase for 12 hours. n = 2 biological repeats. b, The percentage of 7-AAD+ B16 cells primed by IFNγ for 24 hours, followed with treatment with different concentrations of cyst(e)inase for 40 hours. n = 2 biological repeats. c, The percentage of 7-AAD+ B16 cells primed by IFNγ, followed by 400 nM cysteinase treatment in the presence of 10 µM Fer1 for 24 hours. n = 3 biological replicates. ns, P = 0.7290 and **** P < 0.0001 were determined by one-way ANOVA. d, The percentage of 7-AAD+ STAT1 wild-type or STAT1−/− B16 cells treated with or without IFNγ, followed by 500 nM cyst(e)inase treatment for 40 hours. n = 2 or 4 biological replicates. **** P < 0.0001 as determined by one-way ANOVA. e, f, Relative lipid ROS (e) or the percentage of 7-AAD+ B16 cells (f) primed by IFNγ or BSA, followed by treatment with 500 nM heated-cysteinase or cyst(e)inase for 24 hours (e) or 40 hours (f). n = 3 biological replicates. ** P = 0.0023 and **** P < 0.0001 were determined by two-way ANOVA. g, Effect of cyst(e)inase combined PD-L1 blockade on IB8 tumor growth. Tumor was monitored over time by quantifying total flux in mouse peritoneal cavity and IVIS imaging of representative mice from indicated days was shown. h, Effect of liproxstatin-1 on anti-tumor efficacy of the combination therapy. ID8 tumor-bearing mice receiving the combination of cyst(e)inase and anti-PD-L1 were treated with liproxstatin-1 (10 mg/kg, n = 9) or DMSO (control, n = 9). Tumor growth was monitored over time by quantifying total flux in peritoneal cavity. **** P < 0.0001 as determined by two-way ANOVA.
Extended Data Fig. 8
Extended Data Fig. 8. System xc- expression correlates to immune signatures and patient outcome
a, Representative images of dual staining of CD8 and SLC7A11 (upper panel) or CD8 and SLC3A2 (lower panel) by immunohistochemistry in human melanoma tissues. The levels of SLC7A11 and SLC3A2 expression on tumor cells were assessed by the H-score method. b, c, Kaplan–Meier survival curves for melanoma patients with low (n = 231) and high (n = 232) CD8A expression (a), and low (n = 231) and high (n = 232) IFNγ signature score (b). P values were determined by log-rank test.
Figure 1
Figure 1. Immunotherapy activated CD8+ T cells regulate cancer cell ferroptosis
a, b, Tumor lipid ROS (a) and growth (b) in luciferase-expressing ID8 tumor-bearing mice treated with isotype (n = 10) or anti-PD-L1 antibody (n = 10). (a) Relative lipid ROS are expressed as the ratio of oxidized and reduced BODIPY MFI in gated CD45- tumor cells. ** P = 0.0014 as determined by two-tailed t-test. (b) Tumor growth was monitored by quantifying total flux (photos per second). **** P < 0.0001 on day 40 as determined by two-way ANOVA (b). c, d, Tumor lipid ROS (c) and growth (d) in B16 tumor-bearing mice treated with isotype or anti-PD-L1 antibody. (c) Relative lipid ROS was quantified in CD45- cells (Isotype, n = 9; anti-PD-L1, n = 11; two-tailed t-test; * P = 0.0274). (d) Tumor weight was measured on day 17 (Isotype, n = 13; anti-PD-L1, n = 11; two-tailed t-test; * P = 0.0284). e, f, Tumor lipid ROS (e) and growth (f) in OVA+ B16 tumor-bearing mice treated with OT-I transfusion. (e) Relative lipid ROS was measured in CD45-H2kb-OVA+ cells. (f) Tumor weight was measured on day 14. Control, n = 9; OT-I, n = 10; *** P = 0.0003 (e) and ** P = 0.0013 (f) are determined by two-tailed t-test. g, Tumor growth in B16 tumor-bearing mice that were treated with DMSO (n = 10), liproxstatin-1 (n = 9), the anti-CTLA-4 and anti-PD-L1 combination therapy (n = 10) or the combination plus liproxstatin-1 (n = 9). *** P = 0.0008, **** P < 0.0001 as determined by two-way ANOVA. h, Relative lipid ROS in B16 or OVA-pulsed B16 cells co-cultured with or without activated OT-I (B16: OT-I = 1: 1) for 30 hours. n = 3 biological replicates; * P = 0.0230 and ** P = 0.0027 were determined by one-way ANOVA. i, Percentage of 7AAD+ B16-OVA cells in the co-cultures with OT-I cells (B16: OT-I = 1: 1) for 24 hours followed by RSL3 (0.2 μM) treatment in the presence of ferrostatin-1 (Fer1) (10 μM) for additional 20 hours. n = 3 biological replicates; **** P < 0.0001 as determined by one-way ANOVA. j, k, Relative lipid ROS in B16, ID8 (j) or HT-1080 (k) cells treated with the supernatants from naïve or activated mouse (j) or human (k) CD8+ T cells for 30 hours. ** P = 0.0047 (m); *** P = 0.0002 (j) as determined by two-tailed t-test. n = 2, T cells are from two different donors (k).
Figure 2
Figure 2. IFNγ sensitizes tumor cells to ferroptosis by inhibiting system xc-
a, b, Relative lipid ROS (a) or the percentage of 7-AAD+ dead cells (b) in OVA-pulsed wild-type or IFNGR1 deficient (IFNGR1−/−) B16 cells co-cultured with OT-I cells (B16: OT-I = 1: 1) for 24 hours followed by treatment with RSL3 (0.1 μM) for additional 20 hours. n = 3 biological replicates. In a, ** P = 0.0012; *** P = 0.0001; ns, P = 0.9995 and 0.4244 were determined by one-way ANOVA. In b, **** P < 0.0001; ns, P = 0.2306 and 0.7842 were determined by one-way ANOVA. c, Relative lipid ROS of B16 cells primed by IFNγ (10 ng/ml) for 40 hours and followed with erastin (1 μM) or RSL3 (0.1 μM) treatment for 8 hours. n = 2 biological replicates. d, The percentage of 7-AAD+ HT-1080 cells primed by IFNγ (10 ng/ml) for 40 hours and followed with erastin (4 μM) or RSL3 (0.05 μM) for 20 hours. n = 2 or 3 biological replicates; **** P < 0.0001 as determined by one-way ANOVA. e, Relative content of oxygenated PC species in HT-1080 cells primed by IFNγ for 40 hours and followed with RSL3 (0.01 μM) for 10 hours. n = 3 biological replicates; ** P = 0.0016; *** P = 0.0001; * P = 0.0440 and * P = 0.0325 were determined by one-way ANOVA. f, Tumor growth in HT-1080 tumor-bearing NSG mice that were treated with PBS (n = 9), IFNγ (n = 11), liproxstatin-1 (n = 12) or IFNγ plus liproxstatin-1 (n = 11). **** P < 0.0001 as determined by two-way ANOVA. g, Immunoblots of SLC7A11, SLC3A2, and IRF1 in HT-1080 cells treated with IFNγ (10 ng/ml) for 24 hours. β-actin serves as the loading control. Images are representative of three experiments. h, 14C-Cystine content in IFNγ-treated HT-1080 cells incubated in 14C-Cystine supplemented medium for 45 minutes. n = 3 or 4 biological replicates; **** P < 0.0001 as determined by two-tailed t-test. i, The percentage of 7-AAD+ dead cells in HT-1080 expressing scramble shRNA or 3 individual shRNA targeting SLC7A11 (shSLC7A11–1, 2, 3) treated with different concentrations of erastin for 24 hours. One of 3 repeats is shown.
Figure 3
Figure 3. Cyst(e)inase and PD-L1 blockade synergistically induce ferroptosis
a, The percentage of 7-AAD+ HT-1080 cells treated with cyst(e)inase (1 µM) in the presence of ferroptosis inhibitors, Fer1 (10 µM), DFO (100 µM) or GSH (500 µM) for 24 hours. n = 2 or 3 biological replicates; b, The percentage of 7-AAD+ HT-1080 cells primed by IFNγ (10 ng/ml) for 24 hours, followed with cyst(e)inase (250 nM) for 24 hours. n = 2 biological replicates. c, Relative lipid ROS in ID8 cells primed by IFNγ for 24 hours, followed with cyst(e)inase (500 nM) for 12 hours. n = 3 biological replicates; *** P = 0.0002 and ** P = 0.0075 were determined by one-way ANOVA. d, The percentage of 7-AAD+ ID8 cells primed by IFNγ for 24 hours, followed with different concentrations of cyst(e)inase for 24 hours. n = 2 biological replicates. e-i, Effect of cyst(e)inase in combination with PD-L1 blockade on tumor growth and immune responses. ID8 tumor-bearing mice were treated with isotype antibody (n = 10), anti-PD-L1 antibody (n = 9), cyst(e)inase (n = 8) or the combination of cyst(e)inase and anti-PD-L1 (n = 9). Tumor growth was monitored over time by quantifying total flux (e); relative lipid ROS in CD45- ID8 cells (f); the percentages of CD8+ and CD4+ T-cells in CD45+ cells (g); and the percentage of IFNγ (h) and TNFα (i) expressing cells in CD8+ and CD4+ T cells were analyzed. * P < 0.05, ** P < 0.01, *** P < 0.001, **** P < 0.0001 as determined by two-way ANOVA (e) or one-way ANOVA (f-i).
Figure 4
Figure 4. System xc- expression correlates to immune signatures and patient outcome
a, b, Correlation between tumor cell SLC7A11 (a), SLC3A2 (b) protein expression and the number of CD8+ T cells in human melanoma. n = 90, two-sided Fisher’s exact test; P = 0.0011 (a); P = 0.0052 (b). c, d, Correlation between SLC3A2 mRNA quartiles and effector CD8+ T cell signature score (c) or IFNγ (d) in the melanoma TCGA dataset. n = 463, one-way ANOVA. e, Kaplan–Meier survival curves for melanoma patients with low and high expression of SLC3A2 mRNA in melanoma TCGA dataset. P value is determined by log-rank test. f, g, Ferroptosis response signature score is positively associated with effector CD8+ T cell-signature score (f) or IFNγ (g) in melanoma TCGA dataset. Mann-Whitney test; P = 0.002 (f); P = 0.003 (g). h, Fold changes of SLC3A2, CD8A and IFNγ in matched pre- and on-therapy samples from melanoma patients who had clinical benefit (n= 9) or no clinical benefit (n = 18). P values are determined by Mann-Whitney test.

Comment in

References

    1. Zou W, Wolchok JD & Chen L PD-L1 (B7-H1) and PD-1 Pathway Blockade for Cancer Therapy: Mechanisms, Response Biomarkers and Combinations. Sci Transl Med 8, 328rv324 (2016). - PMC - PubMed
    1. Khalil DN, Smith EL, Brentjens RJ & Wolchok JD The future of cancer treatment: immunomodulation, CARs and combination immunotherapy. Nature reviews. Clinical oncology 13, 394, (2016). - PMC - PubMed
    1. Barry M & Bleackley RC Cytotoxic T lymphocytes: all roads lead to death. Nat Rev Immunol 2, 401–409 (2002). - PubMed
    1. Golstein P & Griffiths GM An early history of T cell-mediated cytotoxicity. Nat Rev Immunol, 18, 527–535 (2018). - PubMed
    1. Dixon SJ et al. Ferroptosis: an iron-dependent form of nonapoptotic cell death. Cell 149, 1060–1072 (2012). - PMC - PubMed

Publication types

MeSH terms